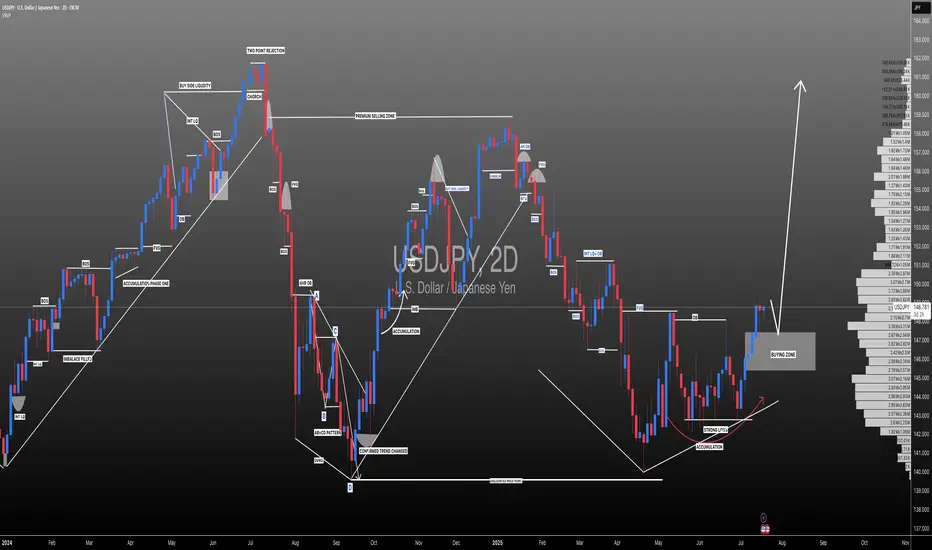
#USDJPY: Swing Buy Almost +2000 Pips! Dear Traders,
The USDJPY currency pair appears to be in an accumulation phase at the moment, as evidenced by the lack of significant price movement throughout the current week. Several factors contribute to this trend.
Firstly, several significant economic events are scheduled for this week, particularly tomorrow and Friday. These developments will have substantial implications for the future trajectory of the USDJPY pair. Consequently, there’s a possibility that the price may experience a decline before initiating a bullish trend. We’ve recently seen a strong bullish candle, which suggests a strong bullish move in the coming weeks. Additionally, the strong USD could continue rising, while the JPY is dropping.
Secondly, there are two primary areas where the price could reverse its course. The extent to which the USD reacts to the economic data will indicate potential reversal zones.
It’s crucial to conduct your own analysis before making any financial decisions. This chart should be used solely for educational purposes and does not guarantee any specific outcome.
Regarding the stop loss, as this is a swing trade, it’s advisable to employ a larger stop loss if the price reaches entry zones. The take profit level can be determined based on your entry type and analysis.
We wish you the best of luck in your trading endeavours and emphasise the importance of trading safely.
Please share this analysis with others through likes, comments, and social media platforms. If you have any questions or require further assistance, don’t hesitate to comment below. We’re here to provide support.
Team Setupsfx_
❤️🚀
Fundamental Analysis
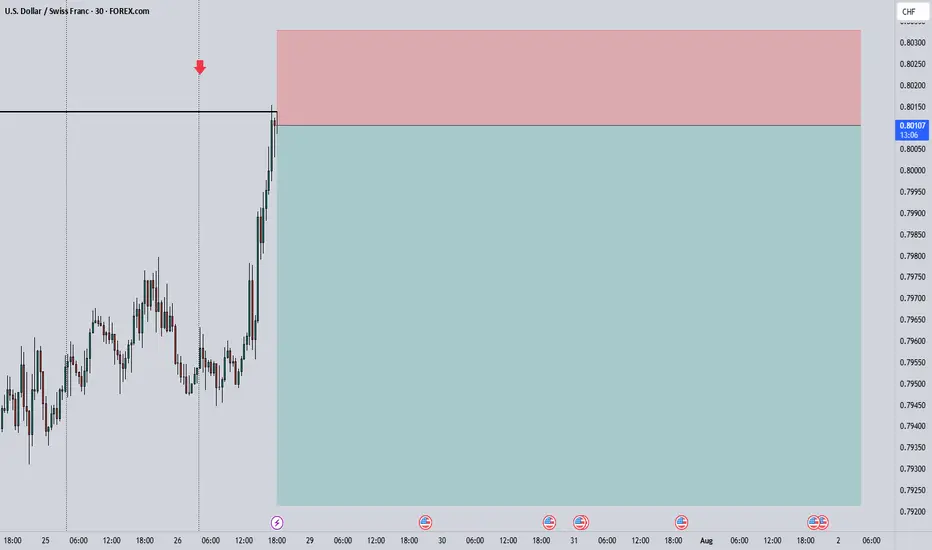
USDCHF Short ProjectHi guys...😎
My custom indicator says it's time to do a Short Project on USDCHF with 3 key reasons:
1. Price Drivers: institutional shorting
2. Trend: down
3. Momentum: bearish
Action: waiting for entry on the intraday timeframe (entry will be published further)


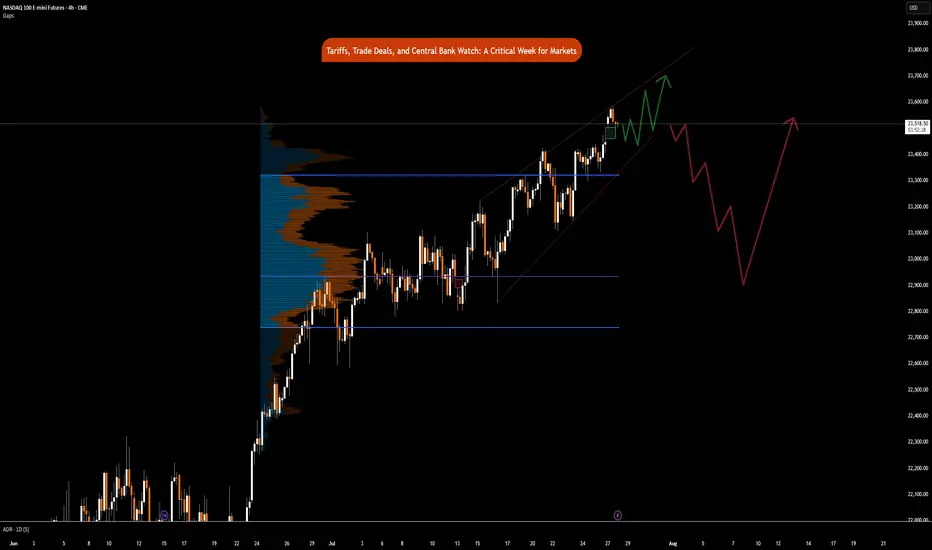
Tariffs, Trade Deals, & Central Bank Watch: Key Week in MarketsCME_MINI:NQ1! CME_MINI:ES1! CME_MINI:MNQ1! COMEX:GC1! CME_MINI:MES1! NYMEX:CL1!
This is a significant week in terms of macroeconomic headlines, key data releases, central bank decisions, and major trade policy developments. We get numbers for growth, inflation and decision and insights into monetary policy. Combining this with ongoing trade policy developments, we have a key week which may shape how the rest of the year unfolds.
Below is a consolidated summary of the latest trade negotiations, scheduled economic releases, and policy outlooks.
US - EU Trade Deal:
• US–EU Tariffs: The US will impose a 15% tariff on most EU goods, including cars, semiconductors, and pharmaceuticals, but retain a 50% tariff on steel and aluminium with a new quota system.
• Exemptions: Zero-for-zero tariffs agreed for agriculture, aircraft parts, and chemicals; aircraft exports are temporarily exempt.
• EU Commitments: The EU will invest $600 billion in the US and purchase $750 billion in US energy, mainly LNG.
• Agriculture: The EU will lower tariffs on many US agricultural goods, though not comprehensively.
• Political Reactions: EU leaders are mixed, Germany and the Netherlands praised the deal, France called it unbalanced, and Hungary viewed it unfavorably.
• The deal is not final until it is ratified by all EU national parliaments and the EU Parliament.
China Talks: US and China expected to extend their trade truce by 90 days. US-China meeting expected in Stockholm on Monday and Tuesday. Trump to freeze export controls to secure a deal. A group of US executives will visit China for trade discussions, organized by the US-China Business Council.
South Korea Trade Talks: Korea proposes a shipbuilding partnership with the US and is preparing a trade package.
UK–US Relations: PM Starmer and Trump to meet in Scotland to discuss the UK–US trade deal implementation, Middle East ceasefire, and pressure on Russia.
Thus far, the US has announced trade deals with the UK, Vietnam, Philippines, Indonesia, Japan and The EU. Trade delegations are working to finalize deals with China, Mexico, Canada
Key Economic Data Releases:
Monday: Treasury refunding financing estimates.
Supply: 2-Year and 5-Year Note Auction, 3 & 6-Month Bill Auction
Tuesday: US Advance Goods Trade Balance, Wholesale Inventories Advance, CB Consumer Confidence, JOLTS Job Opening (Jun), Atlanta Fed GDPNow, Australian CPI Q2
Supply: 7-Year Note Auction
Wednesday: German GDP Q2, EUR GDP Q2, US ADP Non-farm Employment, US GDP Q2, Crude Oil Inventories, Chinese Manufacturing PMI
Canada: BoC Interest Rate Decision, Rate Statement, Monterey Policy Report, BoC Press Conference
US: Fed Interest Rate Decision,FOMC Statement, Fed Press Conference.
Japan: BoJ Interest Rate Decision, Monetary Policy Statement
Thursday: EU Unemployment (Jun), US PCE & Core PCE Price Index (Jun)
Japan: BoJ Press Conference
Friday: EU CPI, US NFP, Unemployment Rate, Average Hourly Earnings, ISM Manufacturing PMI, Michigan 1-Year & 5-Year Inflation Expectations.
It is also a busy earnings week. See here for a complete earnings schedule .
Markets are interpreting trade deals as positive news thus far. The dollar is strengthening.
As we previously mentioned, we anticipate no rate cuts this year as economic data proves to be resilient and inflation largely under control. WSJ also posted an article stating that most tariffs costs are being absorbed by companies due to weaker pricing power. We previously wrote about this on our blog: “ In our analysis, the inflation impact of tariffs may not show up until Q4 2025 or early 2026, as tariff threats are mostly used as a lever to negotiate deals. While effective tariff rates have increased, as Trump reshapes how tariffs are viewed, cost pass-through to consumers will be limited in Q3 2025, as companies’ front-loaded inventory helps mitigate the risks of increased tariff exposure.
So, what we have is an interesting development shaping up where, while inflation may rise and remain sticky, it is yet to be seen whether slowing consumer spending will weaken enough to the point where companies must start offering discounts, which would nullify the tariff risk to the end consumer and result in companies absorbing all tariffs. This scenario will see reduced earnings margins leading into the last quarter and early 2026. However, it will materially reduce risks of higher inflation.”
In our view, the US dollar has a higher probability to rally in the short-term i.e., Q3 as markets re-align FX rate differentials. Bond yields stabilize, Equities continue pushing higher, while Gold retraces as previously mentioned. This in our view, is what investors and participants refer to as the Goldilocks scenario. If this plays out as expected we anticipate continued strength with AI, tech, energy and defense sectors outperforming into mid- 2026.
Institutional View: Morgan Stanley
Morgan Stanley also sees no rate cuts in 2025, despite market pricing for two 25 bps cuts. They forecast more aggressive cuts in 2026 due to:
• Tariff-related inflation emerging before labor market deterioration
• Slowing US growth, as fiscal support fades
• Impact of tighter immigration policy and global trade realignment
That said, MS continues to cite longer-term risks to the dollar, including:
• Twin deficits (fiscal + current account)
• Ongoing debate around USD’s safe haven status
• USD hedging activity picking up by international investors
• Strained credibility of the Fed due to tension between Fed Chair and the US Administration
How Fed policy evolves in Q4 2025 and Q1 2026 will depend heavily on the incoming Fed Chair nominee, who is expected to replace Jerome Powell in May 2026. This nomination could significantly influence future policy direction around growth and inflation targets.
Australian dollar down, eyes US GDP, Australian CPIThe Australian dollar is down for a third straight trading day. In the North American session, the US dollar has posted gains against most of the major currencies, including the Aussie. The greenback received a boost after the US and the EU reached a framework trade agreement after protracted negotiations.
The data calendar is bare on Monday, with no events out of the US or Australia. Things get very busy on Wednesday, with Australian inflation, US GDP and the Federal Reserve rate decision.
Even with no US releases, the US dollar has posted gains against most of the major currencies, including the Aussie. The greenback received a boost after the US and the EU reached a framework trade agreement after protracted negotiations.
President Trump had threatened to impose 30% tariffs on European goods if a deal was not reached by Aug. 1. With the deal, a nasty trade war between the world's two largest economies has been avoided and the US will tariff most EU products at 15%.
The deal with the EU comes on the heels of a similar agreement with Japan, bringing a sigh of relief from the financial markets that have been worried about the economic fallout from Trump's tariff policy. The agreements remove a great deal of uncertainty and investors are hopeful that the US and Chinese negotiators will wrap up their talks with an agreement in hand.
The Federal Reserve meets on Wednesday and is virtually certain to maintain interest rates for a fifth straight meeting. It will be interesting to see if President Trump, who has been sharply critical of Fed policy, reacts to the decision. The money markets are expecting at least one cut before the end of the year, with the money markets pricing in a 61% likelihood a cut in September, according to FedWatch's CME.

7/28/25 - $pltr - Profit taking into print7/28/25 :: VROCKSTAR :: NASDAQ:PLTR
Profit taking into print
- no idea what print brings
- but mgmt have been sell-only
- valuation is what it is... inexplicable by anyone
- i'd not be surprised to see anything happen on the result
- but into result, big holders (read: not you) are likely going to see some profit taking/ risk mgmt given tape, outperformance
- could be a good hedge against other risk-on
- and if tape does see risk off, -ve gamma/ reflexivity largest here
V

ICT CONCEPT OF LOOKING FOR THE FIRST FAIR VALUE GAP AFTER 9:30 This was my short idea that turned out profitable today with an 8.5RR. My bias was bearish, and once I noticed bullish PD arrays failing, I waited until 9:30 local NY time to look for the first FVG after that. I identified a SIBI with a 1-minute bearish order block after 9:30. I used the SIBI as an entry point for a sell, with my take profit set at a low from last week's New York trading session.

Gold weekly chart with both buy and sell entriesAnalysis of the Buy Entry: 2350/52
This level has been chosen as a potential long entry point due to a confluence of several technical factors.
Smart Money Concepts (SMC) - Discount Zone: The chart has a "Premium - Discount" range drawn over the recent downward price leg. The equilibrium (EQ) level is marked in the middle. According to SMC principles, traders look to buy assets at a "discount" (below the 50% EQ level) and sell at a "premium" (above the EQ level). Your buy entry at 2350/52 is located deep within the discount zone, making it an attractive price from this perspective.
Key Horizontal Support Level: The 2350 price is a significant psychological and technical level. Looking to the left of the chart, this area has previously acted as both support and resistance. By placing a buy order here, you are anticipating that this historical support level will hold again and cause price to bounce.
Potential Mean Reversion: At the point of entry, the price is significantly extended below the moving averages (the thin red, orange, and green lines). This can sometimes indicate an "oversold" condition in the short term, increasing the probability of a corrective bounce back up towards the moving averages (the "mean").
In summary, the buy entry is a calculated risk, betting on a bounce from a confluence of a deep discount price, a strong historical support level, and an oversold condition.
Analysis of the Sell Level: 2328
This level is critically important and likely serves two potential purposes: as a stop-loss for the buy trade, or as a trigger for a new short (sell) position.
Breakdown of Major Support: The chart highlights a significant support zone (the thick blue/grey box) roughly between 2330 and 2334. Your sell level at 2328 is placed just below this entire support structure and also below the most recent swing low. A price break below 2328 would signify a failure of this support, confirming that sellers are still in firm control.
Confirmation of Bearish Trend Continuation: In a downtrend, the price makes a series of lower highs and lower lows. A move down to 2328 would create a new lower low, reinforcing the bearish market structure and suggesting that the price is likely to continue much lower. This makes it an ideal place to exit a long position (cut losses) or to initiate a new short position to follow the dominant trend.
Order Flow and Volume Clues:
The note "Delta Volume?" next to this level suggests you are looking for confirmation from order flow data. A strong negative delta (more aggressive sellers than buyers) as the price breaks 2328 would provide strong confirmation for a short trade.
The label "LVN 2334.86" indicates a Low-Volume Node from a volume profile analysis. Price tends to move very quickly through these areas of low liquidity. By placing the sell level below the LVN and the support zone, you are anticipating an acceleration or a "flush" downwards once these key levels are breached.
In summary, the 2328 level is the invalidation point for the bullish "bounce" idea. If the price reaches this level, the reasons for buying are no longer valid, and the evidence strongly points towards a continuation of the downtrend.
Overall Strategy
The plan is to:
Enter a counter-trend long at 2350/52, anticipating a bounce from a strong support and discount zone.
Define risk by placing a stop-loss just below the key support structure at 2328.
Potentially use the 2328 level as a trigger to close the long and open a new short position to trade with the dominant bearish trend if the support level fails.

The correction is quite surprise. What direction for GOLD price?✏️Quite surprised with the adjustment of gold at the end of the previous trading week. The rising price channel is still holding around the lower border of the price channel around 3316. A liquidity sweep and candle wick removal in this area is considered a good buying opportunity.
If h1 closes below this border, limit trading BUY signals until the bottom support of 3286. When the price can close the candle below 3316, gold will trade in a wide range and there is no main trend dominating the market.
📉 Key Levels
Support: 3316-3286
Resistance: 3372-3400-3418
Buy trigger: Reject and Trading above 3316
BUY DCA Break 3372
Target: 3400
SELL Trigger: Break bellow and Retest 3416
Leave your comments on the idea. I am happy to read your views.

BTC Macro Trend ViewDaily chart of BTCUSDT with MA200 and volume. Used to monitor short-term market structure and trend support.

EURUSD at Make-or-Break Zone: Time to Short?EURUSD – Key Data Out Today, Short Setup Confirmed?
Today, several important economic indexes were released for both the Euro(EUR) and the Dollar(USD) . Let’s break them down in a simple way:
Eurozone PMI Data: Mixed to Weak
France:
Manufacturing PMI: 48.4 (slightly lower than forecast)
Services PMI : 49.7 (flat, but below 50 = contraction)
Germany:
Manufacturing PMI: 49.2 (weaker than expected)
Services PMI : 50.1(slightly expansionary)
Eurozone Overall:
Manufacturing PMI: 49.8 (still below 50)
Services PMI : 51.2 (slightly stronger than forecast)
ECB left the Main Refinancing Rate unchanged at 2.15% , which was widely expected.
U.S. Data( TVC:DXY ): Strong and Surprising
Unemployment Claims: 217K (better than expected 227K)
Manufacturing PMI: 49.5 (below forecast of 52.7 – a negative surprise)
Services PMI: 55.2 (well above forecast and previous – bullish for USD)
Interpretation :
The Eurozone's growth remains sluggish, especially in France and Germany.
Despite a drop in U.S. manufacturing, the services sector remains strong, and unemployment data confirms labor market resilience.
This mixed picture slightly tilts the balance in favor of the U.S. dollar, especially as the ECB remains on hold while the Fed may still consider being restrictive.
Bias: Short EURUSD ( FX:EURUSD )
Fundamentals support a Short position in EURUSD, in line with the current technical setup.
---------------------------------
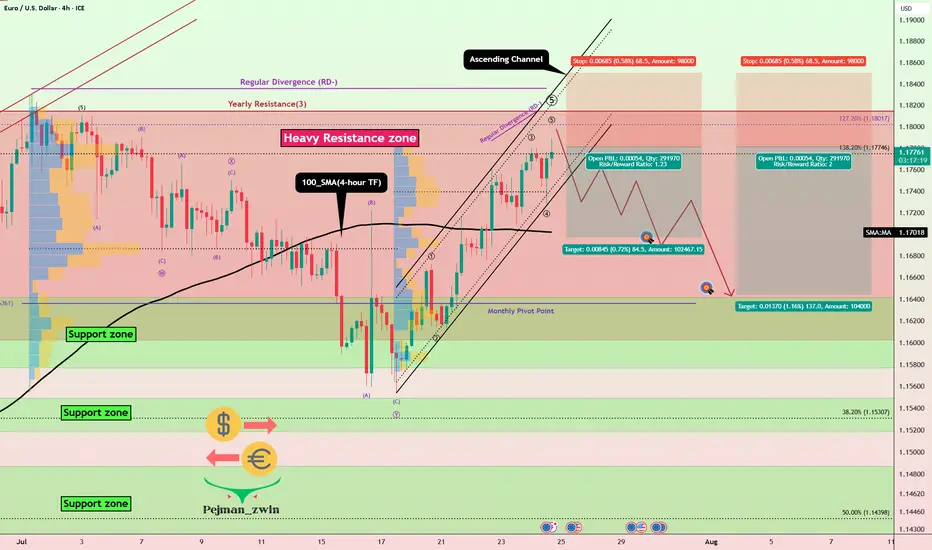
Now let's take a look at the EURUSD chart on the 4-hour time frame to find the best Short position .
EURUSD is currently trading in an Ascending Channel and at a Heavy Resistance zone($1.1845-$1.1602) .
Also, in terms of Elliott wave theory , it seems that EURUSD is completing a microwave 5 of the main wave 5 .
One of the most important supports ahead for EURUSD could be the 100_SMA(4-hour TF) .
If the currently 4-hour candlestick forms a Shooting Star Candlestick Pattern , it is a better sign for EURUSD to fall .
Also, we can see the Regular Divergence(RD-) between Consecutive Peaks .
I expect EURUSD to decline to at least $1.169 AFTER breaking the lower line of the ascending channel .
Second Target: Support zone($1.1642-$1.158) and Monthly Pivot Point.
Note: Stop Loss(SL)= $1.1850
Please respect each other's ideas and express them politely if you agree or disagree.
Euro/U.S. Dollar Analyze (EURUSD), 4-hour time frame.
Be sure to follow the updated ideas.
Do not forget to put a Stop loss for your positions (For every position you want to open).
Please follow your strategy and updates; this is just my Idea, and I will gladly see your ideas in this post.
Please do not forget the ✅' like '✅ button 🙏😊 & Share it with your friends; thanks, and Trade safe.
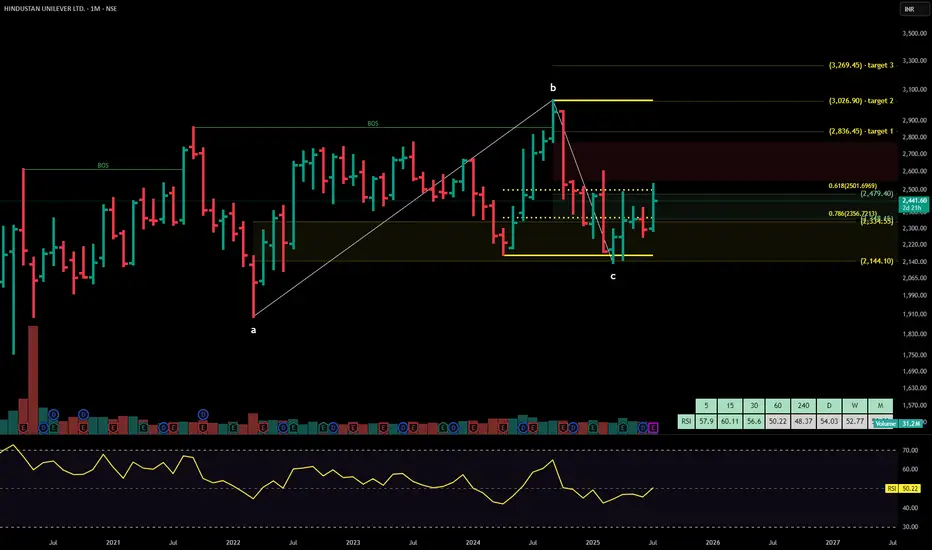
HINDUSTAN UNILEVERHindustan Unilever Ltd. is India’s leading fast-moving consumer goods (FMCG) company, with a portfolio spanning personal care, home care, foods, and beverages. Backed by strong brand equity, extensive distribution, and consistent innovation, the company maintains dominant market share across categories like soaps, shampoos, detergents, tea, and ice creams. The stock is currently trading at ₹2441.
Hindustan Unilever Ltd. – FY22–FY25 Snapshot
Sales – ₹52,446 Cr → ₹56,370 Cr → ₹59,625 Cr → ₹63,180 Cr – Steady topline growth driven by volume and premiumization
Net Profit – ₹9,846 Cr → ₹10,340 Cr → ₹10,790 Cr → ₹11,270 Cr – Margins stable across business lines with cost leverage
Order Book – Moderate → Moderate → Strong → Strong – Strong urban retail and rural penetration continuing Dividend Yield (%) – 1.43% → 1.48% → 1.52% → 1.57% – Consistent payouts reflecting robust free cash flows Operating Performance – Strong → Strong → Strong → Strong – Operational discipline and category leadership Equity Capital – ₹234.96 Cr (constant) – No dilution Total Debt – ₹0 Cr (debt-free) – Fully equity-funded operations
Total Liabilities – ₹12,740 Cr → ₹13,180 Cr → ₹13,560 Cr → ₹13,970 Cr – Stable and aligned with scale
Fixed Assets – ₹3,985 Cr → ₹4,100 Cr → ₹4,240 Cr → ₹4,390 Cr – Modest capex focused on automation and digitization
Latest Highlights FY25 net profit rose 4.4% YoY to ₹11,270 Cr; revenue grew 5.9% to ₹63,180 Cr EPS: ₹48.00 | EBITDA Margin: 24.2% | Net Margin: 17.83% Return on Equity: 22.44% | Return on Assets: 17.15% Promoter holding: 61.90% | Dividend Yield: 1.57% Premium personal care and food innovations led category outperformance Expansion in digital-first channels and rural activation remained strong
Institutional Interest & Ownership Trends Promoter holding stands high at 61.90%, with no pledging or dilution. FIIs and DIIs maintain steady positions given HUL’s status as a portfolio staple. Mutual fund holdings are concentrated in consumption and defensives, and delivery data reflects sustained long-term holding.
Business Growth Verdict Yes, Hindustan Unilever continues to demonstrate category leadership and resilience Margins and cash flows are consistently strong with minimal volatility Debt-free operations underscore financial strength Capex remains targeted, driving process and product innovation
Company Guidance Management expects low-to-mid single-digit revenue growth in FY26, led by continued premiumization, cost optimization, and digital outreach initiatives.
Final Investment Verdict Hindustan Unilever Ltd. remains one of India’s most durable compounders in the FMCG sector. With iconic brands, robust financials, and operational excellence, the company continues to deliver steady returns for long-term investors. Its balance sheet strength, innovation-led strategy, and defensive positioning make it ideal for sustained accumulation in consumption-focused portfolios.
Report - 28 jully, 2025Executive Summary
In a historic move to defuse transatlantic trade tensions, the United States and the European Union have struck a landmark agreement imposing a 15% blanket tariff on EU goods. The deal, brokered between President Trump and EC President Ursula von der Leyen, includes sweeping European commitments to increase purchases of American energy and military equipment—amounting to more than $1.35 trillion. This not only averts a trade war but realigns fiscal, defense, and industrial policy across the Atlantic. Meanwhile, Germany will escape EU sanction for deficit overruns due to elevated defense spending, and China has intensified its diplomatic push to lead AI governance, openly challenging U.S. technological hegemony.
These developments unfold amid a broader recalibration of global capital flows, with Chinese investors pouring record funds into Hong Kong equities, Brazil doubling down on BRICS despite tariff threats, and private equity investors increasingly opting for liquidity over continuation vehicles. All these signals point to a shifting world order, where economic fragmentation, tech rivalry, and military investment dominate the strategic calculus.
Market Reactions
Markets have reacted with cautious optimism. The resolution of the US-EU dispute has removed one of the most immediate risks to global trade, stabilizing risk sentiment. Equities across developed markets are firmer, while defense, energy, and industrial stocks in the U.S. have caught a fresh bid. European auto and export sectors remain under scrutiny given the tariff imposition, despite the broader stability.
The dollar softened slightly on expectations that the trade deal will reduce the likelihood of retaliatory disruptions, even as tensions over chip tariffs and Brazil’s alignment with BRICS persist. Gold briefly rallied but then settled as inflation expectations were tempered by diplomatic de-escalation. Oil prices remain subdued as demand signals remain weak despite energy reordering.
Fiscal and Political Implications
The US-EU agreement marks a major geopolitical win for Trump. The EU's commitment to spend $750 billion on U.S. energy and $600 billion on military procurement illustrates a fundamental pivot in the bloc’s external policy alignment. Politically, this underscores Washington’s ability to extract economic concessions under threat of tariffs—further validating Trump’s unilateralist negotiation style.
Germany’s exemption from EU deficit procedures further highlights Brussels’ strategic flexibility in an era where defense is taking precedence over fiscal austerity. Berlin will be allowed to run a deficit of 3.3% of GDP in 2025, thanks to a “national escape clause” invoked to cover expanded defense spending. This sets a precedent for other member states to follow suit, potentially unleashing a wave of fiscally supported rearmament across the EU.
Meanwhile, China's unveiling of a 13-point AI governance plan signals an emerging regulatory bifurcation in global technology. The push for a UN-backed AI governance body—and the positioning of its open-source models for Global South collaboration—challenges U.S. regulatory primacy and may spark a new front in the AI cold war.
Strategic Forecasts
The medium-term outlook is increasingly defined by strategic spending, tech sovereignty, and the weaponization of trade. The U.S. will likely continue to deploy tariffs not just for balance-of-trade concerns, but also to enforce strategic compliance. This tactic will carry mixed implications for global markets: inflationary near-term, but ultimately supportive of U.S. industrial and defense equities.
Europe’s gradual pivot toward U.S. alignment will create internal friction, especially among member states hesitant to cede strategic autonomy. At the same time, China’s AI diplomacy and Brazil’s defiance of U.S. tariffs will continue to fragment global consensus, creating an increasingly multipolar and protectionist macro environment.
Continued uncertainty around the Federal Reserve’s independence—as Trump ramps up pressure on Powell—will contribute to short-term volatility in bond and currency markets. The likelihood of delayed rate cuts or a politically forced pivot is increasing.
Risks and Opportunities
Risks include renewed tariff escalations, especially targeting tech, chips, and Brazil. Europe’s fiscal leniency could spook bond markets if perceived as unsustainable. In private equity, continuation vehicle fatigue risks forcing markdowns across illiquid portfolios.
Opportunities emerge in defense, energy, and AI-linked equities. The U.S. stands to benefit from a surge in industrial demand, while Chinese tech firms could capitalize on regulatory arbitrage in emerging markets. Open-source AI adoption will favor hardware and semiconductor exporters, particularly in Asia.
Asset Impact Analysis
Gold (XAUUSD):
Gold showed initial strength on trade fears but retraced as the deal lowered immediate inflation risk. With Powell’s position under political threat and long-term fiscal expansion in play, the bullish bias remains intact. Expect gold to test $3,400 in Q3 if Fed guidance shifts dovishly. Near-term support lies at $3,300.
S&P 500 (SPX):
Markets welcomed the trade clarity and defense spending surge. Industrials, defense, and energy are clear beneficiaries, while tech gains from relaxed macro pressure. Continued pressure on Powell could add volatility.
Dow Jones (DJIA):
Dividend-heavy Dow components in defense and manufacturing are poised to outperform. Trade normalization and fiscal leniency in Europe favor global cyclicals.
USDJPY:
With Japanese inflation slightly below forecast and the BoJ still cautious, yen strength is capped. U.S. political drama may induce mild USD weakness but not enough to break 145 convincingly.
DXY (US Dollar Index):
The dollar may weaken modestly as tariff resolution reduces safe-haven demand and the Fed comes under pressure to cut. A break below 103.00 would confirm a bearish turn.
Crude Oil (WTI):
Oil remains stuck in a neutral range. Although the EU will buy more U.S. energy, weak demand signals and lackluster PMI data keep prices rangebound. A breakout above $72 requires more forceful geopolitical tension.

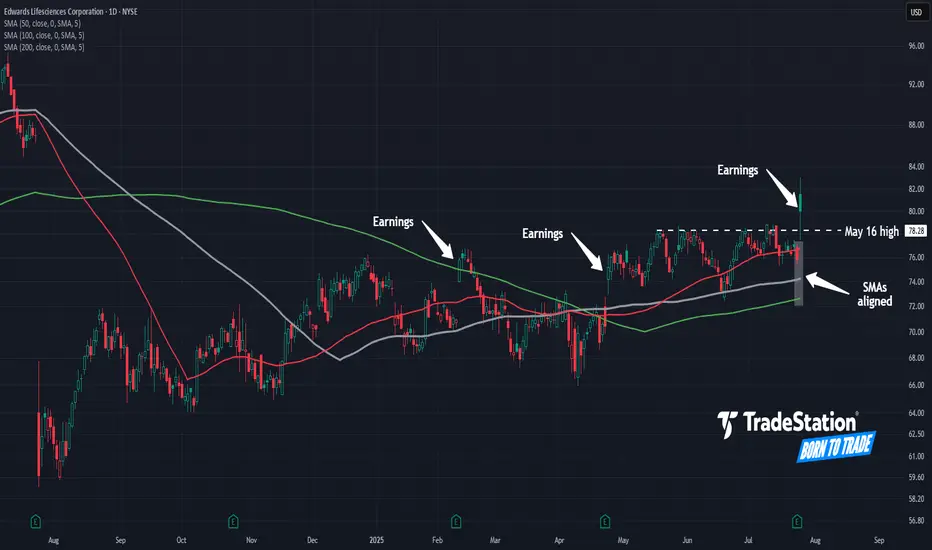
Edwards Lifesciences Enters the GapHealthcare has been the weakest sector in the past year, but some traders may expect a comeback in Edwards Lifesciences.
The first pattern on today’s chart is the breakout on Friday after earnings and revenue beat estimates. That rally brought EW into a bearish gap from one year ago.
Second is the May 16 high of $78.28. The heart-valve company spent more than two months mostly below that resistance, but now it’s been breached. Is there a confirmed breakout?
Third, the 50-day and 100-day simple moving averages (SMAs) crossed above the 200-day SMA in April. The 50-day SMA climbed above the 100-day SMA in May. Such an alignment, with the faster SMAs above the slower, may suggest a bullish trend is developing over the longer term.
Finally, the pair of bullish gaps after the previous earnings reports in February and April could reflect improving sentiment toward the company’s fundamentals.
TradeStation has, for decades, advanced the trading industry, providing access to stocks, options and futures. If you're born to trade, we could be for you. See our Overview for more.
Past performance, whether actual or indicated by historical tests of strategies, is no guarantee of future performance or success. There is a possibility that you may sustain a loss equal to or greater than your entire investment regardless of which asset class you trade (equities, options or futures); therefore, you should not invest or risk money that you cannot afford to lose. Online trading is not suitable for all investors. View the document titled Characteristics and Risks of Standardized Options at www.TradeStation.com . Before trading any asset class, customers must read the relevant risk disclosure statements on www.TradeStation.com . System access and trade placement and execution may be delayed or fail due to market volatility and volume, quote delays, system and software errors, Internet traffic, outages and other factors.
Securities and futures trading is offered to self-directed customers by TradeStation Securities, Inc., a broker-dealer registered with the Securities and Exchange Commission and a futures commission merchant licensed with the Commodity Futures Trading Commission). TradeStation Securities is a member of the Financial Industry Regulatory Authority, the National Futures Association, and a number of exchanges.
TradeStation Securities, Inc. and TradeStation Technologies, Inc. are each wholly owned subsidiaries of TradeStation Group, Inc., both operating, and providing products and services, under the TradeStation brand and trademark. When applying for, or purchasing, accounts, subscriptions, products and services, it is important that you know which company you will be dealing with. Visit www.TradeStation.com for further important information explaining what this means.
GBPCAD | One Kiss at 1.8390, and I’m All In!The big picture of GBPCAD is BUY possible up to 1.8550
See the H4 BUY range?
It slid love note to BUY into my DMs since 17/JulY. I didn't fall blindly since H4 SELL range came in like a jealous ex.
So I flipped to SELL and I shared my love signal with you here. (check my last week GBPCAD signal).
See that bottom black line at 1.8370?
It got a gentle kiss from the Daily candle (REJECTION).
Then 15m already whispered, "a sweet breakout"!
📌LONG STORY SHORT, I'M BUY AT 1.8390
If H4 comes and kisses 1.8390 (just a touch and wick), I’m BUYING — no more playing hard to get. 😘
TP? 1.8490 — that’s a sweet 100-pips date night!
But if it cuddles (closes by body) That’s it — my heart will be broken. 💔
WISH ME LUCK...or TISSUES! 😂!!!

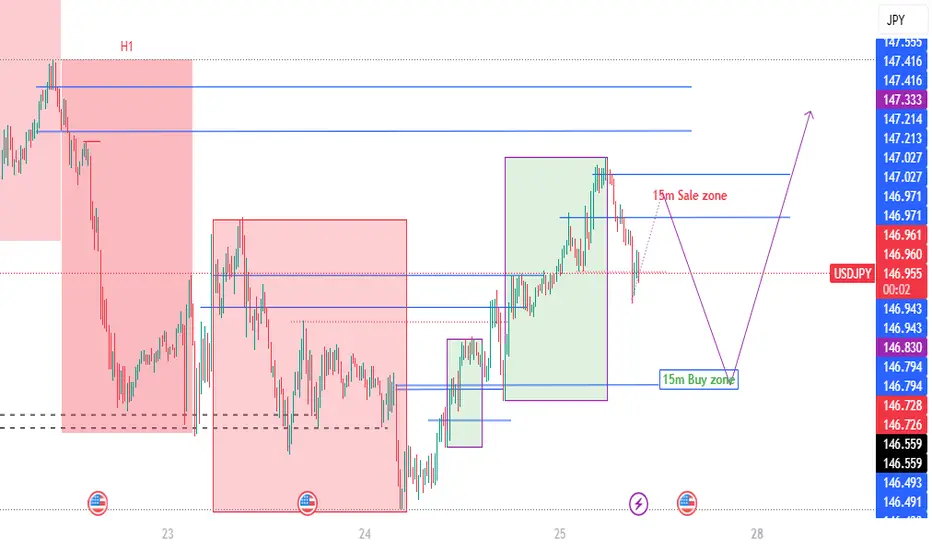
Temporary SELL then BUYAs we said, BIG picture BUY.
Yesterday temporary sell since H1 range was still SELL.
Today H1 range is BULLISH.
We expect temporary SELL from 147.22/42 (After confirmation we will get Snip entry)
TP1: 146.45 (BUY ZONE)
Note: If It will go to BUY ZONE (146.45) first before SELL ZONE (I wont sell)
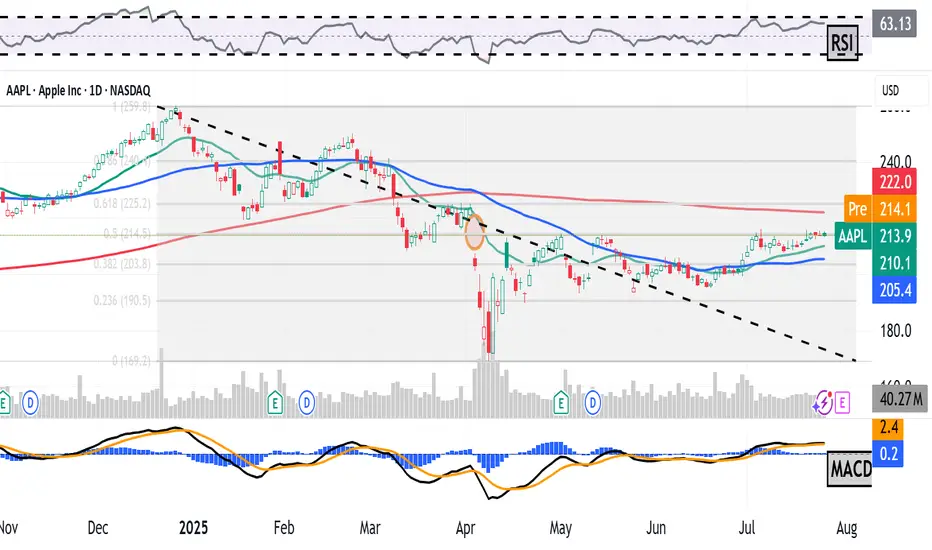
Apple Is Down YTD Ahead of Earnings. What Does Its Chart Say?Apple NASDAQ:AAPL will report earnings Thursday at a time when the tech giant has been struggling more than most other "Magnificent Seven" stocks or higher-end, AI-focused companies. What does fundamental and technical analysis say about AAPL heading into the report?
Let's see:
Apple's Fundamental Analysis
Apple was down 14.4% year to date as of Friday's close, while the S&P 500 was up 8.6%.
Meanwhile, fellow Mag-7 members Nvidia NASDAQ:NVDA and Microsoft NASDAQ:MSFT -- the only publicly traded U.S. companies other than Apple with more than a $3 trillion market cap -- are up 29.2% and 21.9%, respectively.
AAPL has lagged largely because the consumer-electronics giant has dragged its feet on innovation, as well as on the great chase into the world of generative artificial intelligence.
Readers might recall that back in early May, Apple's board increased the firm's dividend payout and authorized a whopping $100 billion share-repurchase program in an attempt to attract investment. But so far, that hasn't seemed to impress Wall Street much.
As for Apple's upcoming fiscal Q3 earnings, the Street is looking for the company to post $1.42 a GAAP EPS of $1.42 on some $89 billion of revenue.
That would represent 1.4% earnings growth and 3.7% better revenues from the $1.40 EPS on $85.8 billion of revenues that the iPhone maker reported in the same period last year.
If this sounds like weak growth, it is. Apple saw 6% year-over-year growth during fiscal Q2 2025, as well as 4.9% in fiscal Q3 2024.
In fact, 20 of the 29 sell-side analysts that I found that cover AAPL lowered their earnings estimates lower for the fiscal Q3 since the period began. (Five have boosted their numbers, while four have made no changes.)
Apple's Technical Analysis
Now let's look at Apple's chart going back to November:
Readers will see that the stock appears to be at a crossroads.
On one hand, Apple developed a "triple-top" pattern of bearish reversal beginning in early May, as marked with red boxes at the above chart's right.
A triple top occurs when a "double-top" pattern fails and a stock retests its resistance from below for a third time.
However, we can see at the chart's extreme right that AAPL has just about reached its resistance level for a fourth time.
What now? Often when someone knocks on a door often enough, that door will open.
Perhaps even more interestingly, we can see that Apple's roughly $215 resistance level (vs. the $213.88 AAPL closed at Friday) appeared at almost precisely the 50% retracement point of the stock's December 2024-April 2025 sell-off.
Note that while they're included with most Fibonacci retracement models, 50% retracements aren't true Fibonacci levels. They are their own thing, but just as technically noteworthy.
All in, Apple now has two potential upside pivots.
One would be the break above the apex of the pattern that's in place. The other would be Apple's 200-day Simple Moving Average (or "SMA," marked with a red line above.)
That creates a potentially bullish set-up. Apple could see support from both its 21-day Exponential Moving Average (or "EMA," denoted with a green line above) and from its 50-day SMA (the blue line above). That's likely where we'll find out if professional managers are willing to defend the stock.
Meanwhile, Apple's Relative Strength Index (or "RSI," marked with a gray line at the chart's top) is robust, but not in a technically overbought state.
Similarly, the stock's daily Moving Average Convergence Divergence indicator (or "MACD," denoted with black and gold lines and blue bars at the chart's bottom), has a bullish look to it, but not overwhelmingly so.
The histogram of Apple's 9-day EMA (the blue bars) is above zero, which is historically a short-term positive signal.
Additionally, both the 12-day EMA (black line) and 26-day EMA (gold line) are above zero, with the black line above the gold line. That's traditionally a short- to medium-term positive signal as well.
Still, it's what happens at that fourth top in the above chart that will likely decide Apple's fate technically.
(Moomoo Technologies Inc. Markets Commentator Stephen “Sarge” Guilfoyle had no position in AAPL at the time of writing this column.)
This article discusses technical analysis, other approaches, including fundamental analysis, may offer very different views. The examples provided are for illustrative purposes only and are not intended to be reflective of the results you can expect to achieve. Specific security charts used are for illustrative purposes only and are not a recommendation, offer to sell, or a solicitation of an offer to buy any security. Past investment performance does not indicate or guarantee future success. Returns will vary, and all investments carry risks, including loss of principal. This content is also not a research report and is not intended to serve as the basis for any investment decision. The information contained in this article does not purport to be a complete description of the securities, markets, or developments referred to in this material. Moomoo and its affiliates make no representation or warranty as to the article's adequacy, completeness, accuracy or timeliness for any particular purpose of the above content. Furthermore, there is no guarantee that any statements, estimates, price targets, opinions or forecasts provided herein will prove to be correct.
Moomoo is a financial information and trading app offered by Moomoo Technologies Inc. In the U.S., investment products and services on Moomoo are offered by Moomoo Financial Inc., Member FINRA/SIPC.
TradingView is an independent third party not affiliated with Moomoo Financial Inc., Moomoo Technologies Inc., or its affiliates. Moomoo Financial Inc. and its affiliates do not endorse, represent or warrant the completeness and accuracy of the data and information available on the TradingView platform and are not responsible for any services provided by the third-party platform.
USDJPY Cooking Something – Here's Where I’ll BiteTHE BATTLE OF MY BLUE LINES 📉
The big picture of USDJPY is BUY possible up to 149.35.
I see H1 send me love note to BUY (range) but 15m reject it by forming SELL range.
Conflict? No! This means there is temporary reversal (BEARISH).
Two top BLUE LINES (147.75/85) are where I can SELL my love story. I will first wait H4 to Kiss either of the line. Since 15m SELL range already formed, I ’ll jump in like a love-struck fool (AGGRESSIVE).
TP: Middle BLUE LINE (147.21) = Dating spot for Buyers.
Middle BLUE LINES (147.21, 147.00)
If H4 price come and KISS (touches and leave wick) in either of these, I’m rushing to 15m to catch that BUY breakout.
If H4 price come and CUDDLE (close by body),I’ll cozy up to SELL (after confirmation) and ride it all the way down to 146.42, the Bottom BLUE LINE. 📉
In Bottom BLUE LINE (146.42) = Buyers Chilling Zone
If H4 price come and KISS (touches and leave wick), I’m rushing down to 15m to catch that BUY breakout — love at first touch!
If H4 price come and CUDDLE (close by body), my trading heartbreak season will start!
WISH ME LUCK.!!!

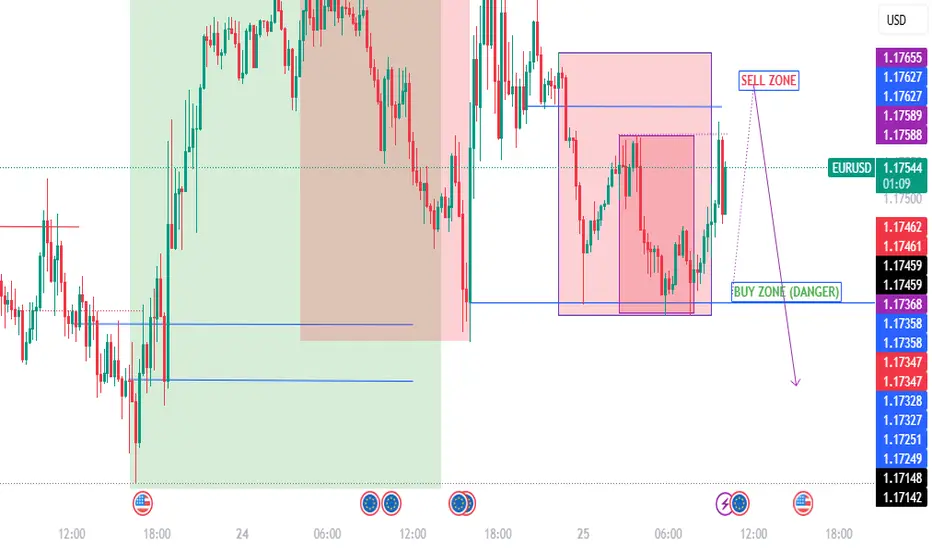
EURUSD TEMPORARY BUY THEN SELLBIG picture SELL
There is Temporary BUY since 15m SELL range swiped to BULL.
The BULLISH can start from 1.1736 (BUY ZONE) (I WONT BUY IF SELL ZONE TAPPED FIRST)
TP: 1.1762 (SELL ZONE)
SELL ZONE (1.1762/1.1770) After confirmation SELL.
TP: 1.1710
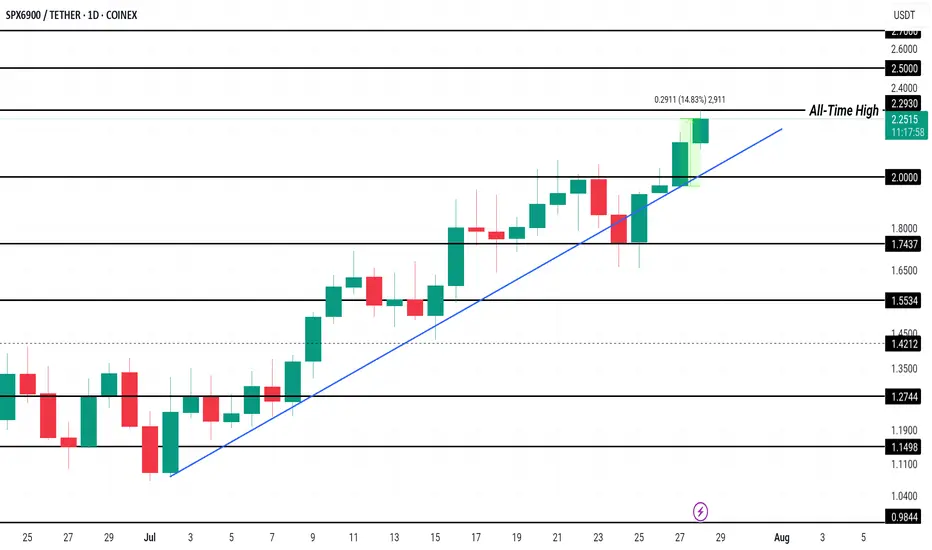
SPX Price Hits New All-Time High, $2.50 Up NextCOINEX:SPXUSDT has been experiencing a consistent uptrend since the beginning of the month, leading to the formation of multiple all-time highs, including one today at $2.27 . This price action reflects strong investor interest, pushing the altcoin to new levels and generating a positive market sentiment.
Currently trading at $2.23, COINEX:SPXUSDT has gained 14% in the past 24 hours . The Ichimoku Cloud, acting as support, signals bullish momentum. This suggests that SPX could rise further, with the potential to reach $2.50 or higher if market conditions remain favorable and investor confidence persists.
However, if selling pressure intensifies, COINEX:SPXUSDT could experience a reversal . A dip below the $2.00 support could push the altcoin toward $1.74 or lower, invalidating the bullish outlook.
From Hype to Hesitation: What’s Next for Pump Fun ($PUMP)?Today, I want to break down the recent developments and fundamentals of Pump fun ( BYBIT:PUMPUSDT ) and its token PUMP — a project that initially launched with strong hype but is now facing serious investor concerns .
What is Pump fun?
Pump fun is a memecoin launchpad that allows users to launch and trade memecoins in a gamified, simplified environment. The idea was to create a frictionless way for anyone to generate and speculate on meme tokens, leveraging viral growth and community culture.
Its native token, PUMP , was introduced via an ICO priced at $0.004, with 12.5% of the total 1 trillion supply offered during the sale.
Latest Updates – Past 24 Hours Recap
PUMP Crashes Over 50% After ICO :
The token initially spiked to $0.0068 on launch day (July 16) , but has now dropped over 50%.
This is roughly 14% below its ICO price , creating concerns for short-term investors.
Founder Confirms No Airdrop Anytime Soon:
In a livestream with ThreadGuy , project founder Alon Cohen confirmed:
“ The airdrop is not going to be taking place in the immediate future. ”
While the team still plans to deliver an airdrop, Alon emphasized it must be well-executed and meaningful, not rushed for hype.
The current focus is on long-term growth and ecosystem sustainability, not short-term incentives.
Mixed Investor Sentiment:
High-profile trader Machi Big Brother ( Jeffrey Huang ) reportedly increased his long position in PUMP — even though he’s down over $5.8M on his position.
Meanwhile, two wallets linked to private sale investors dumped over 1.2B PUMP at $0.003 , taking a combined loss of $1.19M.
Declining Volume and Market Cap:
Trading volume has dropped significantly.
PUMP has lost over 40% of its value in the past 7 days.
Short-term holders appear uncertain, while the project team asks for patience and long-term vision.
Fundamental Outlook:
Pump fun’s future now heavily depends on:
The real utility of the platform as a meme coin incubator.
The team’s ability to regain trust after delaying the airdrop.
Whether new features or hype can revive volume and user engagement.
-------------------------------
Now, let's examine the PUMP token from a technical analysis perspective
From the outset, I must say that due to the small number of candlesticks that create the PUMP token, technical analysis may be a bit difficult , but we will use technical analysis tools to analyze this token.
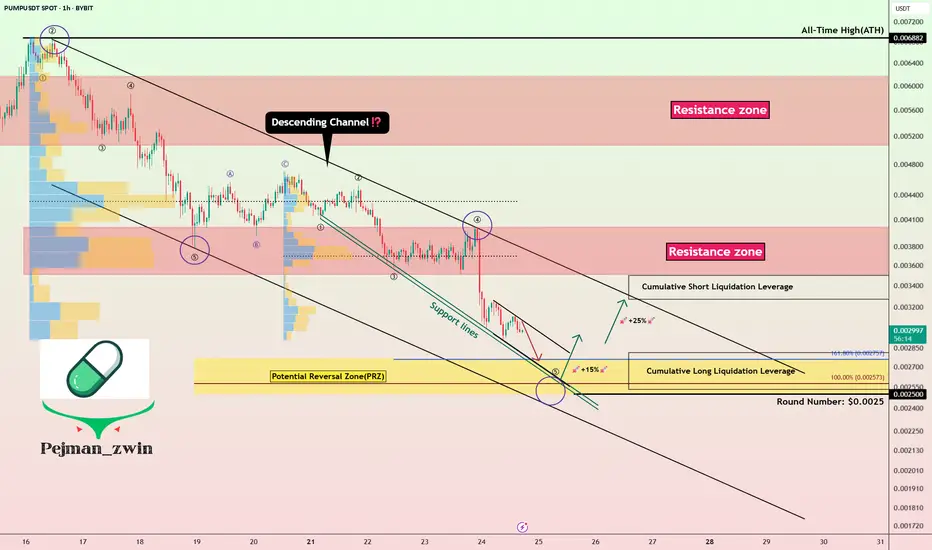
The PUMP token seems to be moving in a descending channel since the beginning of its correction (over -50%) until now, we need a second price bottom to confirm the descending channel.
I expect the PUMP token to rise from the Potential Reversal Zone(PRZ) and near the Support lines to $0.0029(+15%) . PUMP Token increase can also be from the bottom of the ascending channel .
Second target: the upper line of the ascending channel.
Cumulative Long Liquidation Leverage: $0.002810-$0.002530
Cumulative Short Liquidation Leverage: $0.003498-$0.00327
Note: Stop Loss(SL): $0.002391
Please respect each other's ideas and express them politely if you agree or disagree.
Pump fun Analyze (PUMPUSDT), 1-hour time frame.
Be sure to follow the updated ideas.
Do not forget to put a Stop loss for your positions (For every position you want to open).
Please follow your strategy and updates; this is just my Idea, and I will gladly see your ideas in this post.
Please do not forget the ✅' like '✅ button 🙏😊 & Share it with your friends; thanks, and Trade safe.