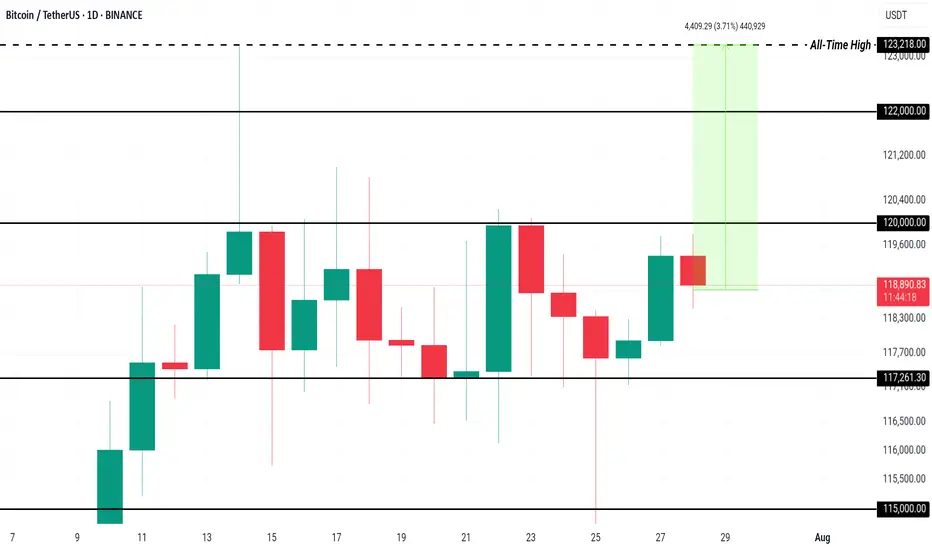
Here’s Why Bitcoin Price Could Rewrite History in AugustBINANCE:BTCUSDT price is currently hovering at $118,938, within a consolidation range between $117,261 and $120,000 . While this range has held steady, the possibility of breaking through $120,000 is high if investor sentiment remains strong.
The current sell-side risk ratio for BINANCE:BTCUSDT is at 0.24, well below the neutral threshold of 0.4 and closer to the low-value realization threshold of 0.1. This suggests that the market is experiencing consolidation, with investor behavior indicating a pause in large sell-offs.
Historically, August has been a bearish month for BINANCE:BTCUSDT , with the median monthly return sitting at -8.3%. However, given the current accumulation trend and the low sell-side risk, Bitcoin may defy its historical trend this year. If Bitcoin can secure $120,000 as support, it would likely push past $122,000 and move toward the ATH .
However, there remains a risk that the market could turn bearish if investors shift their stance due to unforeseen market factors. In this case, BINANCE:BTCUSDT could lose support at $117,261 and slide to $115,000, reversing the bullish thesis.
Fundamental Analysis
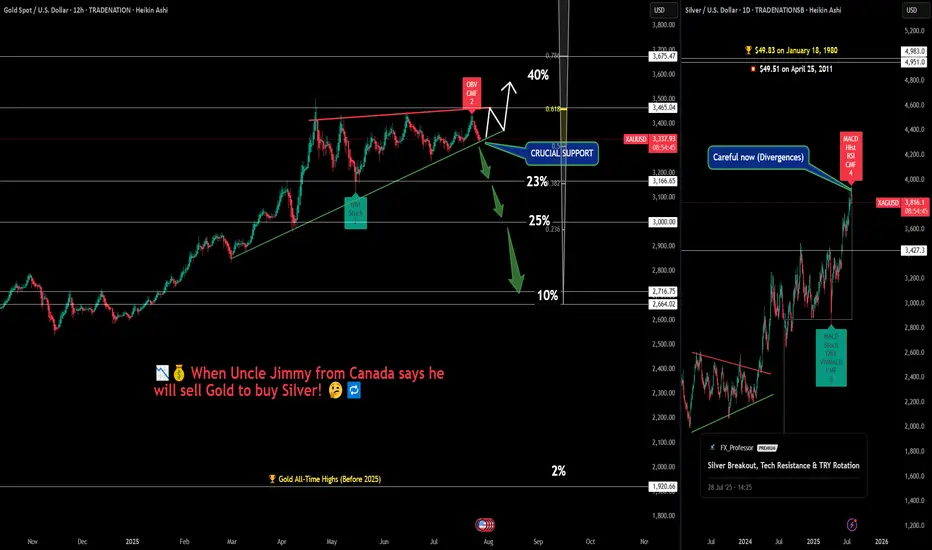
When Gold Believers Flip – Uncle Jimmy, Silver & New Safe Havens💰📉 When Gold Believers Flip – Uncle Jimmy, Silver, and the New Safe Havens 🧠🔄
Let me tell you a story that says more than any chart ever could.
📜 Meet Uncle Jimmy (from Canada) . He’s not really my uncle, but out of respect, that’s what I call him.
A true OG — early stockbroker, big mustache , 20+ apartments, a life built on commissions, charts, and one sacred truth: '' Gold never lies. ''
He's bought gold at every dip, every crisis, every whisper of war or inflation.
But now?
“I’m thinking of selling gold to buy silver.” ( WHAT?! 😳👀💥)
That’s it. That’s the moment.
📉 A gold maxi flipping into silver. A generational pivot.
And that’s the real divergence the chart doesn’t always show.
⚖️ Macro Sentiment Rotation:
📊 Gold
Sitting on crucial support. Breakout potential to $3,465+ remains — but divergences (OBV, CMF) are stacking. A breakdown? Targets stretch down to $3,000 or even $2,716.
🪙 Silver
Just hit $38.14 — now eyeing the legendary $49.83 ATH from 1980. Legacy capital rotating in. Silver’s moment? (My chart says 'wait a bit'...divergences!)
💻 NASDAQ/Tech
Some now call it the “new safe haven” — not because of bonds, but because of trust in corporate resilience vs. geopolitical chaos. When Nasdaq rises, silver often outperforms gold — risk appetite returns, and so does industrial metal demand.
₿ Bitcoin
And then there’s Bitcoin…
The safe haven that legacy minds still don’t trust.
I told Uncle Jimmy to buy it at:
→ $4,000
→ $18,000
→ $45,000
→ Even $70,000.... I stopped doing that at some point, he just wouldn't get it, or wouldn't make a move into the 'crypto unknown'. Respect!
So...He never did. Maybe Bitcoin just became what gold once was — but for the next generation. Not for Big Jimmy.
🧠 What to Watch:
Sentiment is shifting
Safe havens are evolving
Charts show structure — but stories show psychology
Whether you're long metals, crypto, or tech — the key is knowing when beliefs break and rotations begin.
Watch price. Listen to sentiment. And never underestimate Uncle Jimmy.
What would you tell Jimmy today if he was your uncle? Let me know below!
One Love,
The FX PROFESSOR 💙
Disclosure: I am happy to be part of the Trade Nation's Influencer program and receive a monthly fee for using their TradingView charts in my analysis. Awesome broker, where the trader really comes first! 🌟🤝📈
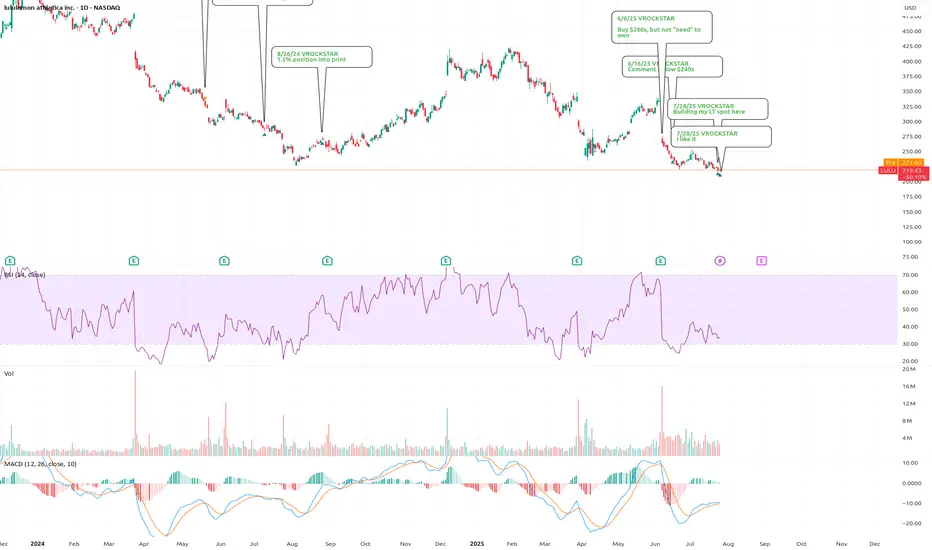
7/28/25 - $lulu - and goodbye7/28/25 :: VROCKSTAR :: NASDAQ:LULU
I like it
Apparently i can't post my thoughts anymore w/o it being flagged. so what's the point?
And i don't play stupid games and win stupid prizes... so goodbye public notes. ez decision.
Also... purely technical analysis will go the way of AI. So beware. Learn to think independently without just drawing lines on charts like 99.999% of content here. there r other places where people post more thoughtful fundamental analysis.
in the meanwhile this is the chart i thought might be helpful for anyone looking at $lulu. i literally post this for the last time... because, well, i think it's a helpful data pt.
the chart i'm trying to post now the 3rd time...
V
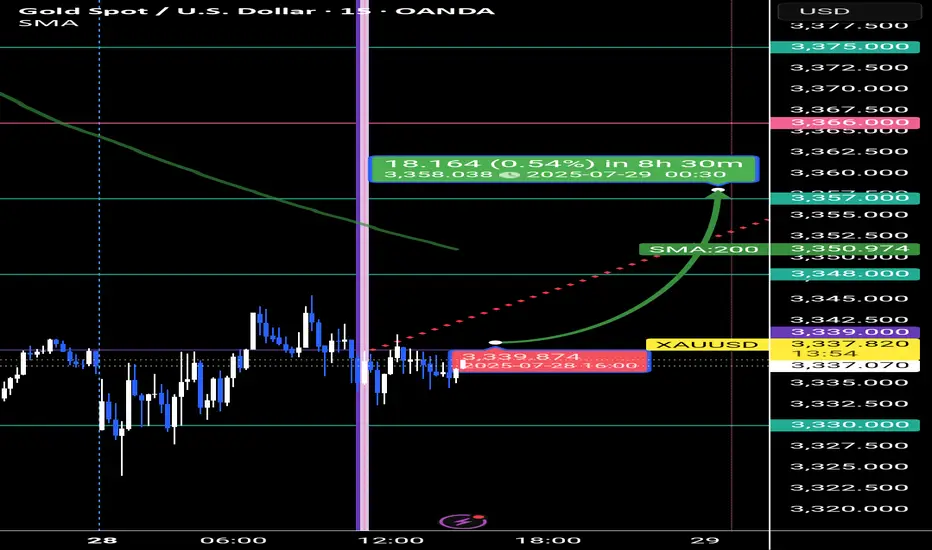
XAU/USD Forecast — GANN DAILY PIPP STRATEGYTimeframe: 15min | Period: July 2 – August 1
In this time-based setup, the working hours between 2 July and 1 August are divided into 6 equal parts, and on the 15-minute chart, each part is subdivided into 6 smaller slices — a precise GANN-inspired structure that identifies key turning points in time.
---
🎯 Key Levels
Pivot Price: 3258
Point of Interest: 3339
↳ If a 1H candle fully closes above 3339, this marks the end of consolidation, and we may see a move toward 3420.
Below 3330, the correction is likely to continue.
---
🧠 Strategy Insight
This chart is built using time fractals, not indicators. To truly understand the rhythm, you must view it across multiple timeframes — each layer adds clarity.
---
🖼️ Click to view the full chart
Open the chart and witness how time meets price in perfect harmony.
This is precision trading, not prediction.
We Got The Deal - Time To Sell The NewsOkay, so we have the long-awaited deal between the US and the EU. After a large up-gap was announced last night, it now seems as if a “sell the facts” scenario is unfolding.
Such a wave of selling would also fit in well with the typical seasonal weakness that we often see in the markets from August onwards.
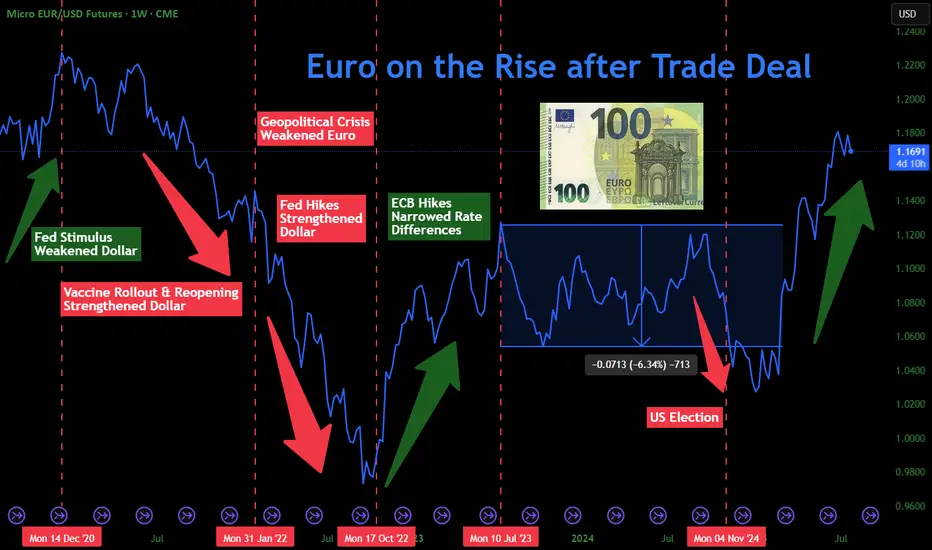
Euro to Rise as Trade Tensions DefusedCME: Micro Euro/USD Futures ( CME_MINI:M6E1! ), #microfutures
On July 27th, U.S. President Donald Trump and European Commission President Ursula von der Leyen announced the U.S. has reached a trade deal with the European Union.
• President Trump said that the deal imposes a 15% tariff on most European goods
• The EU will open its vast market to U.S. products, with 0% tariff
• The EU agreed to purchase $750 billion worth of U.S. energy
• The EU will also invest $600 billion into the U.S. above current levels
Financial market breathes a sigh of relief as the tariff was only half of the 30% rate previously feared. This critical deal marks the de-escalation of US-EU trade tensions. The two trading blocs together represent 30% of global trade and 43% of global GDP. In 2024, bilateral trade reached over €1.68 trillion, according to the EU.
The transatlantic partnership was at its lowest point since WWII. The US was prepared to exit NATO, leaving Europe the monumental challenge to rebuild its military and defense industry. The EU also faces problems in energy supply as well as rising social instability.
In my opinion, the Euro will benefit significantly with the stabilization of US-EU relations.
• Firstly, it allows the 27 EU nations to continue doing business with their biggest customer. The U.S. accounts for 20% of all EU exports in 2024, according to the EU.
• Secondly, due to its approach to energy policy, the EU now imports 55% of its energy needs. Natural gas imports fall by half as Europe reduces its reliance on Russian gas.
• Meanwhile, imports of liquefied natural gas (LNG) have doubled to fill the gap. The U.S. supplies half of LNG imports, according to Eurostat. The trade deal will secure low-cost LNG from the U.S., without tariff.
• Thirdly, while NATO members raise defense budget to 5% of GDP from 2-3%, the money will be spent more wisely by buying U.S. military equipment. Previously, for a worst-case scenario, I estimated a drag of 2% on GDP if EU were to rebuild its military and to directly engage in the Russia-Ukraine conflict. With the U.S. continuing its presence in NATO defense, this could be avoided.
• Fourthly, the Trump administration no longer pursues a strong Dollar. Instead, officials suggest that a weak dollar supports U.S. exports and helps raise the amount of tariff.
• Finally, the European Central Bank (ECB) kept interest rates unchanged in July, ending eight rate cuts over the past year. Meanwhile, the U.S. Federal Reserve eyes one or two rate cuts this year. The divergence in monetary policies would make the dollar weaken against the Euro, according to Interest Rate Parity (IRP).
The CFTC Commitments of Traders report shows that, as of July 22nd, CME Euro FX futures ($6E) have Open Interest of 843,447 contracts.
• Leveraged Funds have 102,310 in long, 73,901 in short, and 23,786 in spreads
• The long-short ratio of 1.4 shows that the “Smart Money” is bullish on the Euro
• The data reflects market sentiment before the trade deal
Micro Euro/FX Futures
A trader sharing a bullish view on Euro could explore the Micro Euro/FX futures ($M6E).
Each M6E contract has a notional value of 12,500 euro. On Monday afternoon, the September M6E contract (M6EU5) is quoted at 1.176, making it worth $14,700. Buying or selling one contract requires an initial margin of $340. The margining requirement reflects a built-in leverage of 43-to-1.
Let’s use a hypothetical trade to illustrate how to use a long futures position to take advantage of a potential rise of Euro.
Hypothetical Trade:
• Long 1 M6EU5 at 1.176, and set a stop loss at 1.15
• Trader pays $340 for initial margin
Scenario 1: Euro rises 5% to 1.235
• Long position gains: $737.5 (= (1.235-1.176) x 12500)
• The hypothetical return will be 217% (= 737.5 / 340)
Scenario 2: Euro falls 5% to 1.117
• The maximum loss: $325 (= (1.176-1.15) x 12500)
• While the position lost most of the money, the trader would not face a margin call due to the stoploss feature. Without it, the loss would have been $737.5
Happy Trading.
Disclaimers
*Trade ideas cited above are for illustration only, as an integral part of a case study to demonstrate the fundamental concepts in risk management under the market scenarios being discussed. They shall not be construed as investment recommendations or advice. Nor are they used to promote any specific products, or services.
CME Real-time Market Data help identify trading set-ups and express my market views. If you have futures in your trading portfolio, you can check out on CME Group data plans available that suit your trading needs tradingview.sweetlogin.com
Palantir Technologies (PLTR) Shares Surpass $160Palantir Technologies (PLTR) Shares Surpass $160 for the First Time
Shares of Palantir Technologies (PLTR), a company specialising in big data analytics software, have continued their impressive performance. Following an extraordinary rally of approximately 340% in 2024, the stock remains among the top performers in the equity market:
→ since the beginning of 2025, the share price has climbed by approximately 113%;
→ on Friday, PLTR set another all-time high, with the share price exceeding $160 for the first time.
What Is Driving Palantir Technologies (PLTR) Higher?
The bullish sentiment is underpinned by the following factors:
→ Major partnerships. Among the contracts are an agreement with the US Army to develop a command system, collaboration with Accenture Federal Services, and many others.
→ Positive analyst outlooks , highlighting Palantir’s unique growth model and high margins. Analysts at Piper Sandler have set a price target of $170 for PLTR, while Wedbush recently raised their target to $160.
In addition, investors are looking ahead with optimism to the upcoming quarterly report scheduled for 4 August, which is expected to reinforce Palantir’s leadership position in a market increasingly driven by AI technologies.
Technical Analysis of Palantir Technologies (PLTR) Chart
Price action has formed an ascending channel (shown in blue), with a notable bullish pattern: each pullback (marked with arrows) has been followed by:
→ a lack of further downside momentum;
→ a rebound above the level where the decline began.
From a sentiment perspective, it is reasonable to infer that price dips are perceived not as warning signs, but as opportunities to accumulate a high-performing stock at a relative discount.
Given these factors, we expect that the upcoming earnings report could propel PLTR shares towards the upper boundary of the blue channel.
This article represents the opinion of the Companies operating under the FXOpen brand only. It is not to be construed as an offer, solicitation, or recommendation with respect to products and services provided by the Companies operating under the FXOpen brand, nor is it to be considered financial advice.

XAUUSD - Gold is in for a big week?!Gold is trading below the EMA200 and EMA50 on the 4-hour timeframe and near the bottom of its medium-term ascending channel (breakout or no break is yet fully confirmed). A correction towards demand levels would provide us with a better risk-reward buying position, and if it rises, we could consider shorting it in supply levels.
In the past week, gold experienced two distinct phases in its price movement: a strong upward trend in the first half that stalled at key resistance levels, leading the market into a more cautious mode. The latest surveys reveal a clear division among gold analysts—some foresee a bearish outlook, while others prefer to remain neutral and wait for further signals. Meanwhile, retail traders remain optimistic about gold’s short-term trajectory and emphasize the continuation of its upward trend.
Analysts at Commerzbank believe the gold market is currently directionless and searching for a clear trend. In their view, recent news around potential trade agreements has weakened demand for gold as a safe-haven asset. They have adopted a neutral stance in the short term, stating that gold prices are near their upper limit with limited room for further gains at the moment.
Conversely, some experts are confident in the continuation of gold’s bullish trend. Rich Checkan, President and CEO of Asset Strategies International, declared: “Gold is in an uptrend. Today’s pullback is setting the stage for next week’s rally. If the Federal Open Market Committee (FOMC) meets expectations and holds rates steady, both gold and silver will keep climbing. And if the Fed exceeds expectations by cutting rates, we’ll see an even stronger surge in both metals. Either way, the direction is upward.”
At the same time, other analysts remain cautious about the trend’s sustainability. Mark Leibovit, editor of VR Metals/Resource Letter, warned that the U.S. dollar may be forming a bottom, which could exert downward pressure on gold and calls for increased caution from investors.
Despite continued political pressure from President Trump, the Federal Reserve is not expected to lower interest rates at the upcoming meeting. Central bankers have stated that they want to observe the economic effects of tariffs before making any adjustments. Although some Fed officials are moving away from the “wait and see” approach, analysts still believe the Fed will leave rates unchanged this week—though markets are closely watching for any signals suggesting that rate cuts could begin as early as September.
Meanwhile, China’s gold consumption in the first half of 2025 declined, though the drop was less severe than in previous years. The primary reason was increased demand for gold as a safe-haven investment, which partially offset reduced jewelry purchases due to high prices.
According to data from the China Gold Association, a government-affiliated body, gold consumption fell by 3.54% year-over-year in the first half of the year to 505,205 tons. In comparison, Q1 saw a 5.96% annual decline, and the same period in 2024 recorded a 5.61% drop.
The association stated that growing geopolitical tensions and ongoing economic uncertainty have strengthened gold’s role as a store of value and safe asset, prompting a significant rise in private investment in bars and coins.
Gold bar and coin purchases—a key indicator of safe-haven demand—surged by 23.7% to 264,242 tons, accounting for 52% of total consumption and overtaking jewelry as the largest consumption segment. Meanwhile, gold jewelry demand fell by 26% to 199,826 tons, reflecting weakened consumer interest due to high prices.
Still, the association noted that lighter jewelry products with unique designs and higher value-added features remain popular. Additionally, official data from the People’s Bank of China (PBOC) showed that the central bank increased its gold reserves in June for the eighth consecutive month.
On the supply side, domestic gold production fell by 0.31% year-over-year to 179,083 tons in the first half of the year, while output from imported sources rose by 2.29% to 76,678 tons. Altogether, China’s total gold production grew by 0.44%, reaching 252,761 tons.

Silver Breakout, Tech Resistance & TRY Rotation 📊🔥 Silver Breakout, Tech Resistance & TRY Rotation – Structure Meets Reality 🌍📉
Hey traders, FXPROFESSOR here 👨🏫
Today’s charts show how technical structure and real-world capital behavior can tell one powerful story. We’re watching Silver surge, Tech stall, and the Turkish Lira react to local capital flows — all aligning with clean market levels.
Let’s break it down:
🔍 Silver (XAG/USD)
Price exploded into $39.30, reaching the top of a well-defined ascending channel.
Now stalling — pullbacks toward $35.38 or even $32.17 would be natural.
🧠 Structurally strong, fundamentally backed by industrial demand, inflation hedging, and tight supply dynamics. Just not a good timing to 'ape it' today.
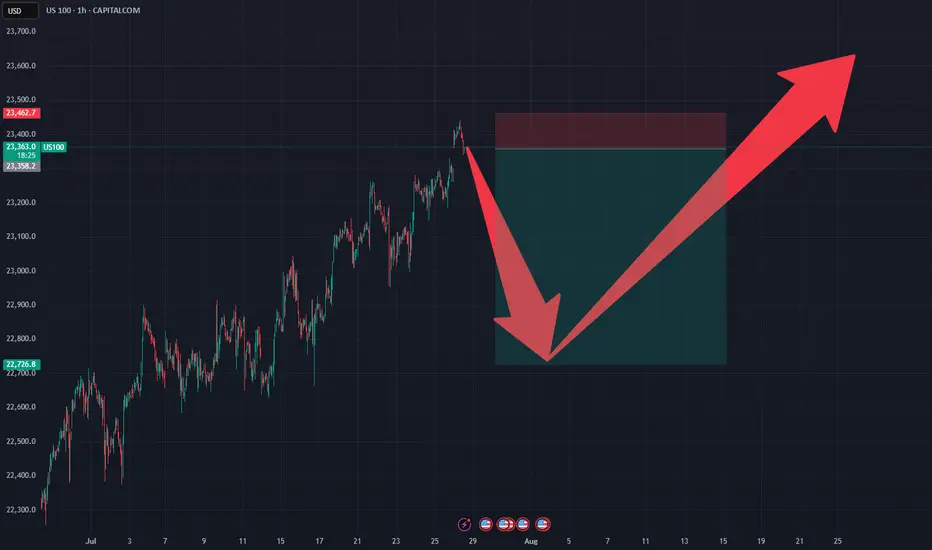
📉 US Tech 100 (USTEC)
Testing resistance around 23,434.
RSI and OBV show signs of exhaustion, suggesting potential pause or pullback.
In a stretched macro environment, tech is vulnerable to rotation — especially if yields shift or inflation expectations change.
💱 EUR/TRY – Turkish Lira Rotation
We just saw a sharp rejection at 47.78, a key round-number resistance.
On the ground, there’s a notable shift — My Turkish brother says 'FX profits being converted into real estate and hard assets, especially by locals and returning expats'. And I trust a good Turk as much as i trust my Greek family! (yes, we can be friends when there is respect and no hatred! common interests work best in this troubled world)
The chart reflects this move: potential drop toward 46.00 → 45.45 → 43.79 if momentum fades.
🧩 What These Charts Teach Us
This is a perfect storm where technical resistance, macro rotation, and local capital behavior all align:
🔹 Silver rising = hard assets in favor
🔹 Tech pausing = overextension risk
🔹 TRY dropping = profit-taking & capital redeployment
Trade what you see — but understand why it’s happening.
One Love,
The FX PROFESSOR 💙
Disclosure: I am happy to be part of the Trade Nation's Influencer program and receive a monthly fee for using their TradingView charts in my analysis. Awesome broker, where the trader really comes first! 🌟🤝📈

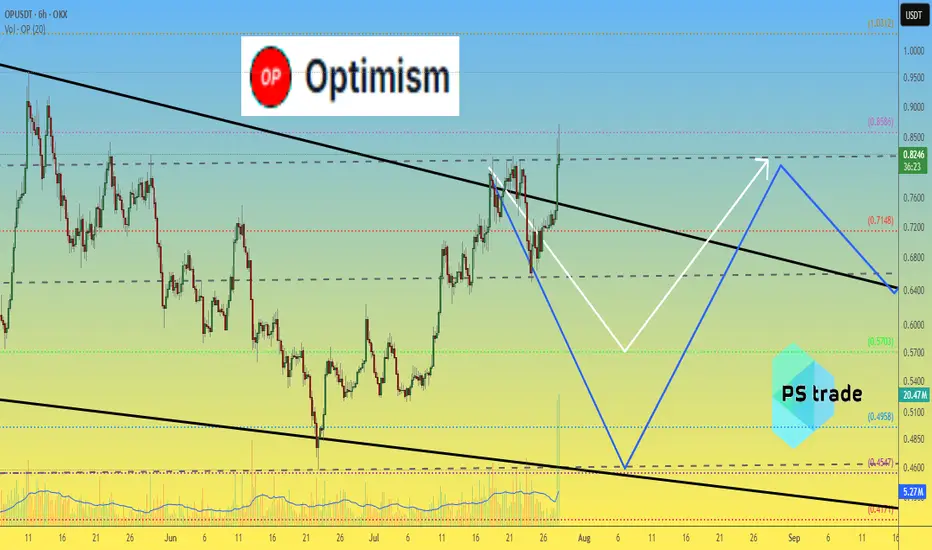
Optimism Op price analysis - be careful After the listing of #OP on the Korean exchange, known for its "pump events", we observe a surge in volume along with a breakout from the downtrend.
🐻 The current 6-hour candle on OKX:OPUSDT is attempting to form a pin bar — a potential reversal signal.
⚠️ High volumes often indicate the final phase of a move. Such pumps are usually short-lived — proceed with caution.
👌 Our previously published medium-term forecast for #Optimism remains relevant
________________
📚 Follow us ❤️ for daily crypto insights & updates!
🚀 Don’t miss out on important market moves!
Semiconductors & SOXL: A Bull ThesisWhy Semiconductors?
Virtually every single electronic device contains some form of a semiconductor unit within its components. The entire Bull theory on semiconductors as an industry could be reduced to this one sentence. The following, however, will introduce concepts contingent to the understanding of what is shaping the market for semiconductors. The weight of intra-industry, political, macroeconomic, and physical factors discerning an inconceivable upside potential for certain investments carrying maximum exposure to the sector, such as AMEX:SOXL . The last section contains my technical approach to trading SOXL.
We begin with the fundamental, and by fundamental, I refer to the simplest reasons for what is happening in the market up until now; [ Early morning Monday, 7/28 ].
Macroeconomic Context
Like essentially the rest of the market, SOXL hit its 1 year low of 7.23 USD on Monday, 4/7, following the announcement (and soon postponement) of global tariffs at levels not observed since the early 30's. This of course sparked a panic spiral in the entire market, leading to outflows from the S&P 500 of approximately 70 billion USD during the month of April. During this time we also saw a new, but familiar narrative emerge. Asset Managers, Such as J.P. Morgan set historically low price targets on the S&P 500, going as low as 5,200 USD. They reinforced their PTs with publications warning investors across the world that the risk of recession in the United States was raised to 80%, and this message was relayed across all media in parabolic fashion. While it does not seem too outward to assume an increased risk of recession due to tariffs by looking back on what we learned of the consequences from the Smoot-Hawley Tariff Act of 1930. There exists a widely overlooked, fundamental , reason as to why I can claim that the REAL risk of recession at the time that J.P. Morgan assigned an 80% risk of recession, was in actuality, 0% (I assume J.P. Morgan knew this but pushed the narrative anyways in order to acquire massive equity at a discount). If anyone has taken introductory macroeconomics in their lifetime, they may be familiar with the function for calculating GDP via the expenditure approach: GDP = C + I + G - NX. Now, why am I referencing high school/college economics basics, the answer to that lies in how we determine our rate of economic growth in the context of tariffs. The part of this formula that we must focus on is NX or Net Exports, the negative factor to GDP. Tariffs, if implemented would effectively decrease import volume, resulting in a smaller Net Exports, and ultimately a higher GDP calculation. Now, what makes this scenario unique, the tariffs having been postponed shortly after their inception, allowed US retailers to engage in front running, or the accelerated purchasing of foreign goods in advance of tariffs. During the month of April, we saw a 5.4% increase in import volume in US west coast ports. This increase in imports effectively caused the inverse impact on GDP growth that import tariffs themselves would have caused: front-running lead to import uptick, leading to a greater Net Exports, which results in lower (negative) GDP growth. Essentially, tariffs in the short-term increases GDP growth (in the long term deadweight loss, and cost structure distortion comes in to play, but that doesn't matter yet), however , tariffs that are announced but not immediately implemented will result in a lower GDP growth, coupled with uncertainty surrounding the whole situation that translated into a cut in CapEx as companies scrambled to determine if tariffs would f*ck them over or not. This argument is further supported by the trends observed in the foreign exchange market. You may have heard in the news that we are experiencing a period of "Dollar Weakness", and while, yes, you can clearly see that the USD has fared rather poorly against other currencies in most major dollar pairs over the past few months. The agent behind this isn't just that the dollar happens to be weak, it is a combination of factors that generate noise and volatility in the forex market. The two main factors highlighted by the media are 1. The obvious political policy instability, pushing bond yields higher, plus a significant debt ceiling raise as per the BBB and 2. the expectations of interest rate cuts over the next year. The other, less recognized major factor to dollar weakness is exactly what we described above: Increased imports means more dollars flowing out of the economy. When these dollars land abroad, they are converted into the native currency, driving down the demand for the dollar. Notice how none of the reasons described above, actually have anything to do with what truly drives foreign exchange markets. Over time, the strength/weakness of a currency is directly correlated to the strength/weakness of the underlying economy. To say that we can expect dollar weakness due to the aforementioned reasons outright ignores the economic growth potential that exists in our economy at this current time, subsiding the out-of-proportion tariff fears as a proponent to an economic crisis. In an all-encompassing view, what I would describe to be occurring on the macro level is a sort of "slingshot" effect: Trade imbalances and private sector response to policy unclarity results in a pullback in economic growth, one that we are now experiencing as a short-term effect. From a medium-long term perspective, assuming that tariffs aren't persistent in the long term, we would see full fledge economic boom, driven by non other than the growth of our technology sector, which at it's core, lies the almighty semiconductor.
Growth of AI as a driver of Semiconductor demand: Stable trajectory or Bubble Territory?
Having laid the economic framework for picking the general direction our market is heading in, we can now begin to talk about the internal combustion occurring within the world of technology, and the two letter term associated with just about every cool thing in the business world, that is of course AI. Now just to clarify, AI is not new, its been around for at least 20 years and has a well established role in the world prior to the existence of ChatGPT. What changed so drastically in recent years is the breakthrough into a new form of artificial intelligence, known as "Artificial General Intelligence" or AGI. Long story short: AGI's primary difference in the business context is the colossal amount of electrical infrastructure and computing power that is demanded by the development of these mega language models. As a result of the high barrier for entry to this new industry, only 5 AGI companies have arisen to the global stage: OpenAI, Google DeepMind, Anthropic, Microsoft, and DeepSeek. Increasing competition in this space through more players entering the market is unlikely at this time as the cost to create a standalone AGI model is so astronomical. This is a particularly good thing because it tells us that AGI as an industry can result in natural monopolies. The ultra-intensive RnD costs and Data Center infrastructure demands make it more sensical to have a greater number of resources dedicated to producing 1 AGI model, instead of dividing resources to develop multiple less optimized models (similar to how a water company holds a natural monopoly as competition in that industry would result in no foreseeable benefit to it's customers). A further effect from this dynamic lies in how businesses in this industry scale to expand, and its pretty straightforward: the more megawatt computing power a model can access, the more parameters a model can account for, and the more vast the dataset that model can train on, with enhancing speed and efficiency (GPT 4o takes into account >500B parameters in a given query). We see the concept of natural monopoly playing out as the concentration of market capitalization is becoming more extreme where firms like Google, Microsoft, and NVIDIA are absorbing larger share of the market, while trading at ever increasing Price/Earnings multiples. To many, this reflects a trend we saw during the dot com bubble, however what makes the AGI industry different is the nature of the good or service provided. During the dot com boom, companies saw speculative value based on only the fact that their business existed on the .com domain. We know that each of these businesses are unique, providing a good or service across whatever industry they were part of, the only thing having in common was that dot com. The major oversight that took place during the turn of the dot com era was that the success of these businesses wasn't in truth due to them ending in .com, but whether the idea, and execution behind the underlying business is strong or not. Like how Amazon and Facebook saw unparalleled success not just because they were .coms, but because they were pioneering business models that would attract global demand to the services they were providing. The business of AGI has a sort of homogenous property. All AGI companies produce a service that is extremely similar in nature, the only ways they can compete with one another is through Capital Expenditure towards harnessing more computing power. This is the main reason capital is concentrating in a handful of companies trading at high multiples. To me, this is not an indication of a tech bubble but rather a product of how the AGI industry is poised to grow within our economy.
AGI as a Factor of Production
To get even more philosophical, we can think about how AGI itself enhances economic growth. We already see AGI tools applied in various ways, but the most widespread application pertains to the enhancement of human capital. While it is possible to make AGI models complete ongoing tasks completely on their own with zero human input, its far more common to see AGI tools be used, well, as tools. What I mean is that firms are not looking to replace human workers with AI ones (certain exceptions may include the manufacturing industry), instead they want to integrate AGI tools into their workforce as a means of optimizing regular processes, allowing them to access and process information with tremendous efficiency. The most observable economic outcome of this is firms being able to cut costs in human capital requirements, allowing them to achieve the same level of workflow with a smaller number of employees, or outsourcing solutions to business processes by way of automation utilizing AGI. The possibilities are endless and the economic impact of AGI appears to write itself new economic theory to explain how business growth is accelerating in unprecedented ways.
Semiconductor Physical Limitations: Blessing or Burden?
In 1965, Gordon Moore articulated his observation which would come to be known as Moore's Law. He observed that the number of transistors in an integrated circuit doubles approximately every 2 years. Based not so much on law of physics, Moore's law describes an empirical relationship between time and the number of transistors per chip, suggesting that the rate of production advancements would allow for such doubling to occur on a biannual basis. And to Gordon's own surprise, he was right. Transistor count for a given chip roughly doubled every 2 years for the following 50 years. However, Gordon also predicted that Moore's Law would come to an end in 2025, where transistor sizes would reach the physical limit of 2 nanometers (10-15 silicon atoms in width). While it may appear as a bottleneck to the semiconductor and AI industry, not being able to fit anymore transistors on one chip, but in reality, this limitation pressures companies to pursue innovations such as semiconductor packaging, which is NVIDIA's bread and butter. This technique allows for the stacking and integrating of many different chips to perform together as one. This technology has already proven wildly successful and is the backbone to virtually all of NVIDIA's GPU products. Google has invented their own method to getting around the physical limitation of silicon chips, producing AI-specialized integrated circuits known as Tensor Processing Units (TPUs). Catering these innovative solutions to expanding the frontier of AGI is almost a given.
How to play this market: A Technical Approach
If you have made it this far, I commend you. The following describes my approach to analyzing price activity in SOXL:
My First entry into SOXL took place on 5/30 with a unit cost of 16.50 USD. Two things can be noted prior to this entry. 1: Fund flows during late February, into March, and through April were extremely high, net inflow of 6.85 Billion USD, however price movement did not reflect the huge inflow until late April/early May where we began to see upward price direction. The beginning of June marked the start of the market bull rally which consolidated into our current price range of 25-28 USD, following contingent earnings releases of NASDAQ:ASML , NYSE:TSM , NASDAQ:NXPI and NASDAQ:INTC . The most recent pullback was a combination of a slightly concerning outlook from ASML, stating that tariffs on the EU would negatively affect projected sales growth for the 2026 fiscal year. As for TSM, there is not one concerning thing that could be said regarding the state of its business growth other than the New Taiwan Dollar gaining considerable strength over the USD amid trade relations between the US and Taiwan, affecting TSM's gross margin by an estimated 6%. NXPI released a sub par earnings and revenue growth outlook, but in my opinion this is not to be too heavily objectified as NXPI produces chips primarily for the Automotive sector, thus making it's sales heavily contingent on supply chain issues being faced by automotive manufacturers in leu of tariffs. NXPI carries a 3.5% market share in semiconductors whereas TSM carries a 68% market share. Lastly, INTC, earnings release I am almost embarrassed to talk about. If it were up to me I'd say they sell their plants in Ohio to TSM and look into opening a fruit stand instead. The most important earnings releases have yet to come though. NASDAQ:MSFT is just around the corner on 7/30, and NASDAQ:NVDA announces on 8/27. These two earnings reports will carry major weight in hinting the overall direction, momentum the market sees in AI demand growth, and the technology sector as a whole. Speculating, I have high expectations that both MSFT and NVDA will top all estimates, pushing the bar higher for 2025 into 2026.
If we look at our short-term 50-day SMA/EMA, you will notice a crossover occur on 5/6, a minor indication of a short term positive trend. Alone this is insignificant, but if we look at our 14-day Average True Range, we can see that this crossover aligns with a fall in ATR that would persist between the values of 1.37 and 1.59. This low ATR value signals that trailing volatility is actually quite low for semiconductors, considering the currently mixed market sentiment. Further along we see that price has crossed above both our long-term, 200-day SMA/EMA and a crossover occurred between the two on 7/23, serving as a small indication of a positive long term trend. Once again, not super significant on its own, but you will notice that the convergence aligns perfectly with a sharp increase in fund inflows, netting 491 Million USD in a matter of 3 trading days. If we see a continuation of net inflows over the several days, we can expect a near future extension of our bull rally, a semi-cyclical wave of inflows that concentrate during consolidation periods (which we have seen take place in the current price range between 25-28 USD following my first exit at 27.50 USD). If we extrapolate both our short-term and long-term SMA/EMA, we can anticipate a crossover to occur in the coming days to weeks. If this occurred, that would further reinforce our expectation for a positive long term trend. I have already locked in my entry 2 with a limit order executed at 25 USD. If all of the above conditions are met, I would confidently predict that we may see SOXL trade at around 42 USD in the coming months.
One more thing I would like to note, if we zoom out to our 5 year historical price progression, we can identify the previous high of 70.08 USD occurring on 7/11/2024. We know that the bull rally which took place in July of last year can be attributed to the first realization of AI as a driver for semiconductor demand, combined with renewed interest in GPU technology for applications in crypto. If we compare AI-related Capital Expenditure in fiscal year 2024 to AI-related Capital Expenditure of the first half of 2025 fiscal year: 246 Billion USD made up AI-related CapEx for all of 2024, vs first 6 months of 2025, adding up to 320 Billion USD. That is a 30% increase in capex, and we still have another 5-6 months to go. Just some food for thought.
Do you believe all of the above has been priced into SOXL, leave your thoughts in the comments!
Disclaimer
You must obviously keep in mind, SOXL is a 3x leveraged ETF, you can expect volatility with such type of investment. However, in capturing a bullish market, a 3x leveraged investment may produce greater than 3x the returns as the underlying (non leveraged) assets, due to the effect of compounding growth of returns over time. However, the same is true for sideways, or bearish markets, losses may be amplified to greater than 3x. If this is an uncertainty you do not wish to be exposed to, I would opt for the non-leveraged Semiconductor ETF ( NASDAQ:SOXX ), or divide your allocation across the top 5-10 equity holdings of SOXL. Please remember to employ your OWN due diligence before making any investment decision, as none of what I am saying shall serve as financial advise to you, the reader.

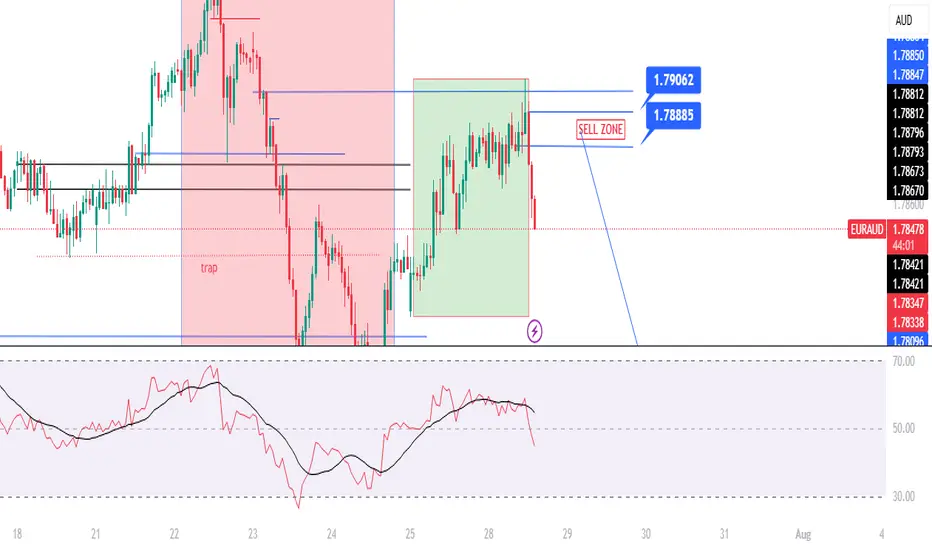
EURAUD | One Kiss from 1.7906 and I’m In – TP 140 Pips!The big picture of EURAUD is SELL possible up to 1.7750
Spot that H1 BUY range?
Inside it, there is conflict. A sneaky SELL range form inside it after rejection H4 BLUE LINE.
See that top blue line at 1.7916?
It got a gentle kiss from the H4 candle (REJECTION).
Then H1 already whispered, "a sweet breakout"!
📌LONG STORY SHORT, I'M SELL AROUND 1.7888 - 7906
If H4 comes and kisses one of the line (just a touch and wick), I’m SELLING — no more playing hard to get. 😘
Other wise, I’ll quietly cry in the corner
TP? 1.7750 — that’s a sweet 140-candlelit dinner!
WISH ME LUCK...!!!
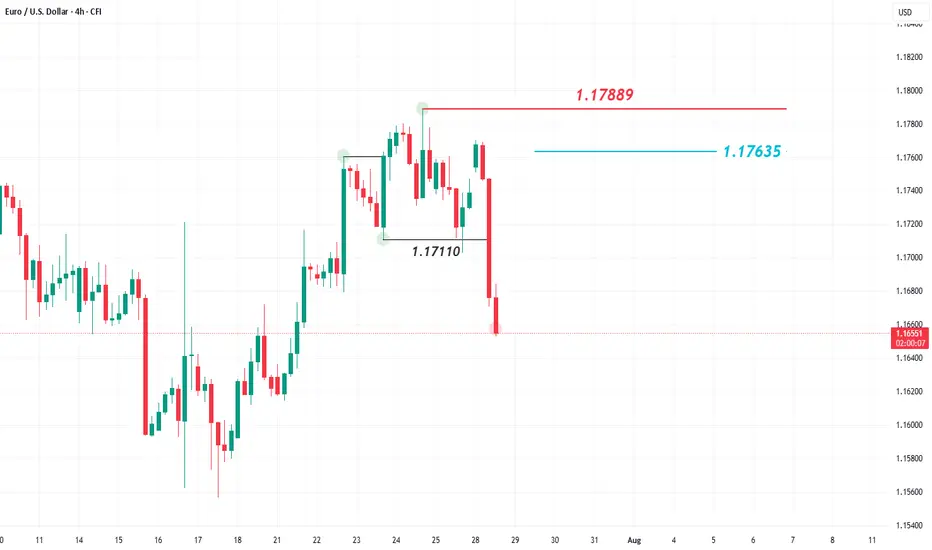
Euro takes a hit as trade deal with the US sparks a market rallyTrading this week kicked off with a trade agreement between the United States and the European Union, which pushed both the US and European indices to open in the green.
However, this development had a negative impact on the euro, which is experiencing a significant decline during today's session, Monday, July 28, 2025. Meanwhile, the US dollar is making a strong comeback, rising by 0.60% ahead of the US session open.
This recent decline has reversed the euro’s upward trend that it had maintained since the beginning of this month. The EUR/USD pair dropped again, hitting a new low below the 1.17110 level, which represents the last lower high of the bullish trend.
What is the likely upcoming scenario?
A price increase for the pair to the 1.17635 level would be considered a corrective move within the ongoing bearish trend. The negative outlook would not change unless the price records a higher high above the 1.17889 level on the 4-hour timeframe.
However, the EUR/USD is heading into an important week filled with key economic data and news, particularly from the US. This includes the US Non-Farm Payrolls set to be released on Friday, August 1, 2025, and the Federal Reserve meeting on Wednesday, July 30, 2025. The later will cover interest rate decisions and upcoming economic projections. The outcomes of these events are expected to have a direct impact on both the US dollar and the EUR/USD pair.
Key Events That Could Shape the Dollar This Week🇺🇸 Key Events That Could Shape the Dollar This Week
Three major catalysts are on the radar for USD traders:
📊 ADP Employment Report
💰 Advance GDP (Q2)
🧠 Fed Chair Powell’s Speech
Additionally, ongoing trade developments with the EU may add to volatility.
📊 1. ADP Employment Report
The July ADP report is forecast to show 82K job additions. While this may seem consistent with recent NFP strength, several red flags suggest growing labor market weakness:
Decline in labor force participation
Slowing wage growth
Emerging contraction signals in the services sector
Even if ADP meets expectations, it may not reflect broad-based labor market health. Historically, ADP and NFP have often diverged—so the market reaction may be muted unless the data surprises meaningfully.
💰 2. Advance GDP (Q2)
Q2 GDP is expected to show modest growth, possibly supported by:
Higher tariff revenues boosting government income
A weaker dollar improving export competitiveness
Reduced imports due to elevated import costs
However, much of this growth is likely nominal rather than real. With inflation remaining sticky, headline GDP may be inflated by price effects rather than true economic expansion. Real GDP could remain flat or weak.
🧠 3. Fed Chair Powell’s Speech
This is arguably the most market-sensitive event of the week.
Goldman Sachs and other major banks believe the recent resilience in U.S. data lowers the chances of a rate cut at this meeting. However, political dynamics could add nuance:
With Donald Trump actively campaigning—and reportedly pressuring the Fed to ease rates to boost exports and growth—Powell may face a fine balancing act in his tone.
Markets will dissect every word for clues on future policy.
🌐 U.S.-EU Trade Developments
The U.S. recently announced a new trade agreement with the EU, including a 15% tariff on selected European imports.
In the short term, this could be dollar-supportive, as it:
Favors domestic producers
Reduces reliance on imports
Potentially improves the trade balance
Yet over the longer term, such tariffs can be inflationary and disrupt global supply chains—possibly complicating the Fed’s decision-making.
⚠️ Final Thought
In times of policy uncertainty, markets lose their predictability.
Tariffs, in particular, often have a stronger and more immediate impact than calendar-based economic data.
As a result, traders must monitor trade-related news and tariff decisions just as closely—if not more—than traditional economic releases in order to stay ahead of market direction and central bank decisions.
Bitcoin Cycles Signal Major Move — BIT500 on What Comes NextBitcoin’s historical price action is known for its cyclical behavior — driven not only by supply dynamics like halving events, but also by global macroeconomic forces. This week, leading crypto macro analyst TechDev released a widely discussed model projecting that Bitcoin may be entering a new explosive phase, closely linked to a shift in monetary policy, global liquidity cycles, and risk asset rotation.
At BIT500, we see this as more than a theory — it’s a playbook. Understanding macro-driven crypto cycles gives institutional and high-net-worth investors a clear advantage. And, when used properly, it can become the foundation for consistent alpha generation in the digital asset space.
TechDev’s Model: Liquidity as the True Driver
According to TechDev, Bitcoin’s major uptrends are synchronized with global liquidity expansions. In particular, the model links Bitcoin price surges with:
Falling real interest rates,
Expanding global M2 money supply,
Weakening U.S. dollar (DXY decline).
This pattern played out in 2016–2017 and again in 2020–2021. As global central banks prepare to shift toward more accommodative policies — especially amid slowing GDP growth and rising debt burdens — similar conditions may be taking shape for late 2025 and into 2026.
BIT500 analysts agree: the macro landscape is increasingly favorable for risk-on positioning, especially in hard assets like Bitcoin.
On-Chain Indicators Confirm the Thesis
Supporting the macro thesis is a growing set of on-chain signals. Our internal models — as well as public indicators like Dormancy Flow, MVRV ratio, and Realized Cap metrics — show long-term holders are accumulating, while short-term holder activity has flattened.
The decline in exchange reserves, increased self-custody trends, and decreased miner selling pressure all align with prior pre-bull market phases. This combination of tightening supply and macro liquidity can act as fuel for the next leg up — one that could catch passive investors off-guard.
How BIT500 Capitalizes on Bitcoin Cycles
At BIT500, we convert insights into execution. Our team applies cycle-based, quantitative strategies to capture asymmetric upside while managing downside risk.
Here’s how we turn macro analysis into market performance:
Phased Capital Deployment
We deploy capital in staggered allocations, entering during compression phases and scaling in as trend confirmation emerges — minimizing exposure during volatility and maximizing return during expansions.
Volatility Harvesting
We implement delta-neutral and volatility-arbitrage strategies across Bitcoin derivatives markets, generating income in all phases of the cycle — especially when price is range-bound.
Multi-Asset Rotation Models
Based on cyclical rotation, we dynamically adjust exposure between Bitcoin, Ethereum, and select altcoins. These models are tested to outperform static portfolios across halving-based and macro cycles.
Custom Risk Monitoring Systems
BIT500 clients benefit from our proprietary Cycle Risk Dashboard, which sends alerts when market structure shifts — enabling proactive rebalancing rather than reactive trading.
Conclusion
Bitcoin’s next major price movement is likely to be shaped not just by crypto-native factors, but by broader shifts in global liquidity, interest rates, and investor sentiment. TechDev’s research confirms what BIT500 has long modeled — that understanding economic cycles is key to anticipating large-scale Bitcoin breakouts.
For investors seeking not just exposure but performance, the coming months represent a rare window of opportunity. At BIT500, we don’t just track cycles — we build strategies to monetize them with discipline and precision.
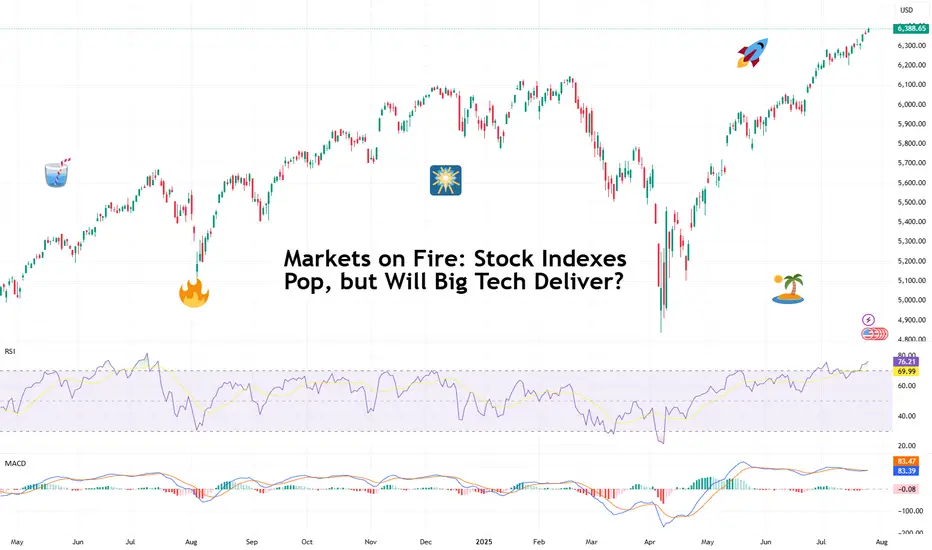
Markets on Fire: Stock Indexes Pop, but Will Big Tech Deliver?S&P 500 and Nasdaq set records. Now it's up to big tech to justify that.
Talk about forward-looking valuation. Tech companies’ valuations are largely based on future potential rather than current performance. And that’s what we’re seeing right now getting priced in across the big indexes.
You’d think we’d be bored of record highs by now. But no — Wall Street keeps hitting refresh on its all-time-high counter. 🎵 Over and over again. 🎵
On Friday, the S&P 500 SP:SPX notched its 14th record close this year, ending at 6,388.64. The Nasdaq Composite NASDAQ:IXIC followed with its 15th at 21,108.32. Even the Dow TVC:DJI — the older sibling who prefers yield over hype — climbed nearly 0.5% to 44,901.92, within a latte’s foam of its December record .
And while indexes are breaking personal bests, investors are buying ahead of some big data deliveries. Why? Because the week ahead is the Super Bowl of Earnings, and the bigger chunk of the Magnificent Seven is up next.
😎 What in the Magnificent Seven?
A highly exclusive club with just seven members, the Mag 7 has entered the earnings spotlight — and the audience isn’t going mild. Traders are pricing perfection, and the script better deliver.
Meta NASDAQ:META kicks things off Wednesday after the close with expected revenue of $44.8 billion and EPS of $5.87. Can Zuckerberg’s AI narrative get investors to forget about the metaverse?
Microsoft NASDAQ:MSFT shows up at the same time, hoping to dazzle with $73.8 billion in revenue and $3.38 EPS. Copilot AI better be doing overtime.
Then on Thursday, again after lights out, Amazon NASDAQ:AMZN joins the chat with its AWS and ecommerce empire expected to pick up $162.1 billion in revenue. Right behind is Apple NASDAQ:AAPL , fighting to stop its slide into meh-land with projected revenue of $89.2 billion and $1.43 EPS. (Fast fact: AAPL is down 12% year to date — among the worst performers in the crew.)
So far, Alphabet NASDAQ:GOOGL already crushed its quarter , posting $96.4 billion in revenue and $2.31 EPS, plus a spicy raise in capex to $85 billion.
Tesla NASDAQ:TSLA ? Not so great. The EV maker reported a 12% revenue drop and a 16% net income decline, spooking investors with a warning of “rough quarters ahead.” The stock is lower by 17% year to date.
Nvidia NASDAQ:NVDA , the AI trailblazer, reports in late August. Until then, it’s chilling on a $4 trillion throne, as per our Top companies rankings, watching its friends sweat it out.
💸 Can the Mag 7 Keep Carrying?
Here’s a harsh dose of reality: the entire S&P 500 is riding on the backs of these seven stocks. Analysts expect them to post 14% earnings growth, while the other 493 companies limp along at 3.4%. Talk about top-heavy things.
So what happens if even one tech titan misses the mark big time and spooks with scary guidance? A market correction? A buy-the-dip opportunity?
And let’s not forget: valuations are stretched. The S&P 500 is now trading at nearly 23x forward earnings (that’s projected profits per share). And the Nasdaq? Don’t even ask. (We’ll tell you anyway — it’s close to 30x). In all that, now’s a great time to keep a close eye on the Earnings Calendar .
📊 Not All Is Big Tech: Fed and Jobs Loom
As if this week wasn’t already packed enough, macro is back on the menu. The Federal Reserve meets Tuesday and Wednesday, and Chair Jay Powell is expected to hold rates steady at 4.5%.
But don’t rule out drama. A single hawkish word and this party could quickly get some rain on. Powell, the man who moves trillions with a simple “Good afternoon,” has a track record of putting markets in their place when they get too euphoric.
And then there’s Friday’s nonfarm payrolls report. Consensus calls for just 108,000 jobs added in July — soft, but not disastrous, and fewer than June’s 147,000 . Blame summer hiring slumps, tariff uncertainty, or the market finally digesting its own hype.
Off to you : Can the Magnificent Seven keep this market magnificent? Or are we about to learn what happens when you ride too close to the sun on AI-generated wings?
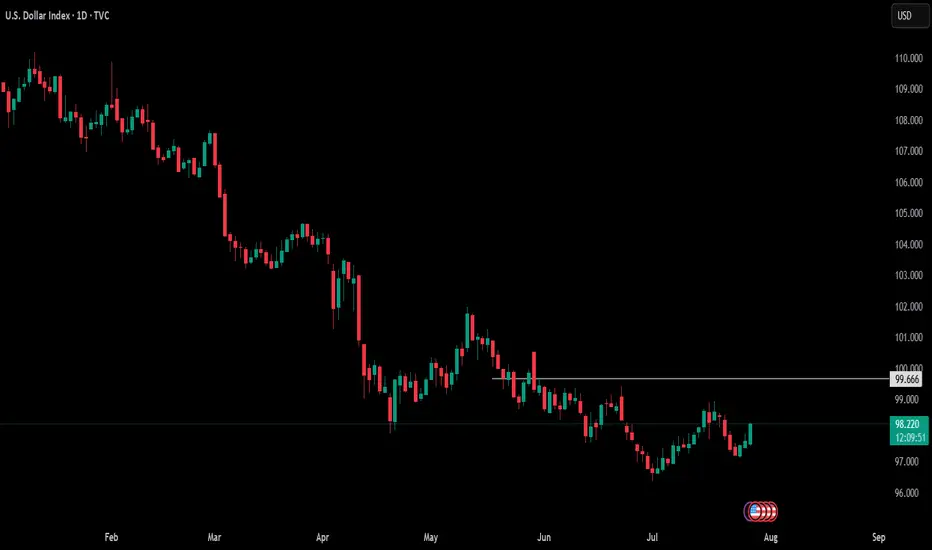
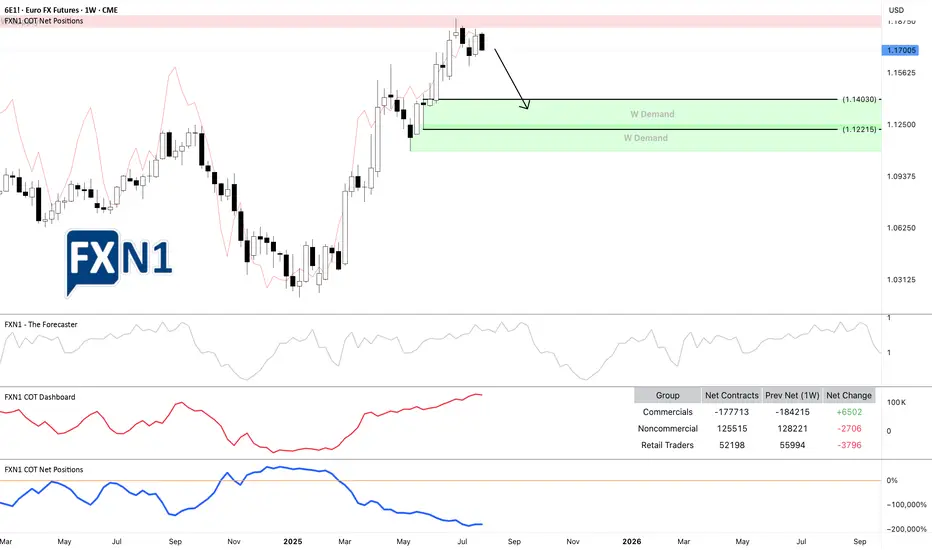
6E1!: Rebound at Weekly Supply Sparks Potential ReversalThe EURUSD (6E1! futures) experienced a rebound from a weekly supply zone * and now appears to be approaching a potential reversal toward a demand area. The overall picture is clear: we already capitalized on the rebound off the previous weekly supply zone, and at this point, we're simply observing the price as it approaches another key area of interest. It may be too late to initiate new short positions at this stage, but traders still holding shorts could potentially benefit from a continued move downward.
From a fundamental perspective, our Friday analysis of the DXY ** indicated the possibility of a bullish impulse, and today the US Dollar opened the session with a 0.58% gain. Currently, both commercial and non-commercial traders are aligned with the prevailing scenario. The most optimistic outlook suggests the price could decline to around 1.14030 over the coming weeks.
*
Previous analysis on EURUSD 6E1!
**
DXY Analysis
✅ Please share your thoughts about 6E1! in the comments section below and HIT LIKE if you appreciate my analysis. Don't forget to FOLLOW ME; you will help us a lot with this small contribution.
Eigen Labs CEO CriticalMilestone ReducesETH Scalability TradeoffIn a major leap toward next-generation blockchain infrastructure, Eigen Labs, the developer behind EigenLayer, has announced the achievement of what its CEO describes as a “critical milestone” in the evolution of Ethereum scalability—reducing the long-standing trade-off between decentralization, security, and performance.
Speaking at the Ethereum Scaling Summit in Seoul, Eigen Labs CEO Sreeram Kannan unveiled the platform's updated modular architecture, which enables “restaked security” for a broad spectrum of Layer 2 networks and decentralized applications.
“Scalability without compromise has always been the holy grail,” Kannan noted. “This milestone changes the calculus—we no longer have to sacrifice decentralization or security for throughput.”
The Challenge: Balancing the Blockchain Trilemma
Since its inception, Ethereum has faced the so-called blockchain trilemma: optimizing only two out of three key elements—security, scalability, and decentralization. While Layer 2s such as Arbitrum and Optimism address throughput, they often introduce trade-offs in validator assumptions or operational complexity.
EigenLayer aims to address this through a novel re-staking mechanism, which leverages the security of Ethereum’s mainnet by allowing ETH stakers to “re-stake” their assets to secure other networks and services.
This innovation could radically expand Ethereum’s trust footprint without duplicating infrastructure or introducing centralized checkpoints—a persistent issue with several scaling models.
Institutional Interest and Market Significance
Venture capital and institutional crypto funds are watching closely. In Q2 2025, Eigen Labs closed a $100M Series B round, with participation from a16z, Polychain, and Jump Crypto. The firm’s long-term roadmap includes interoperability modules that will allow Ethereum-based Layer 2s to share consensus and security guarantees—a breakthrough for composability and capital efficiency.
“EigenLayer is fast becoming a backbone protocol,” says Nadia Liu, a partner at crypto VC firm Framework Ventures. “By minimizing fragmentation, it unlocks value across the entire Ethereum ecosystem.”
What It Means for Developers and Enterprises
For developers, EigenLayer offers a plug-and-play model for building secure applications without launching bespoke validator sets. For enterprise clients, the appeal lies in a more cost-efficient, composable Web3 stack, opening the door to scalable DeFi, gaming, and tokenized asset platforms.
Kannan emphasized that several pilot integrations are already underway with major DeFi protocols and data availability layers. While he did not name them, sources close to the matter hint at collaborations with StarkWare, Celestia, and Coinbase’s Base.
Looking Ahead
The broader implications of EigenLayer’s progress are hard to overstate. If adopted at scale, the protocol could standardize how Ethereum-based projects achieve security, replacing fragmented systems with a unified, market-driven security layer.
With this milestone, Eigen Labs may have just shifted the scalability conversation—from a compromise-based model to one of scalable consensus as a service.
“The modular era is here,” Kannan concluded. “And it's one that doesn’t ask builders to choose between performance and principles.”

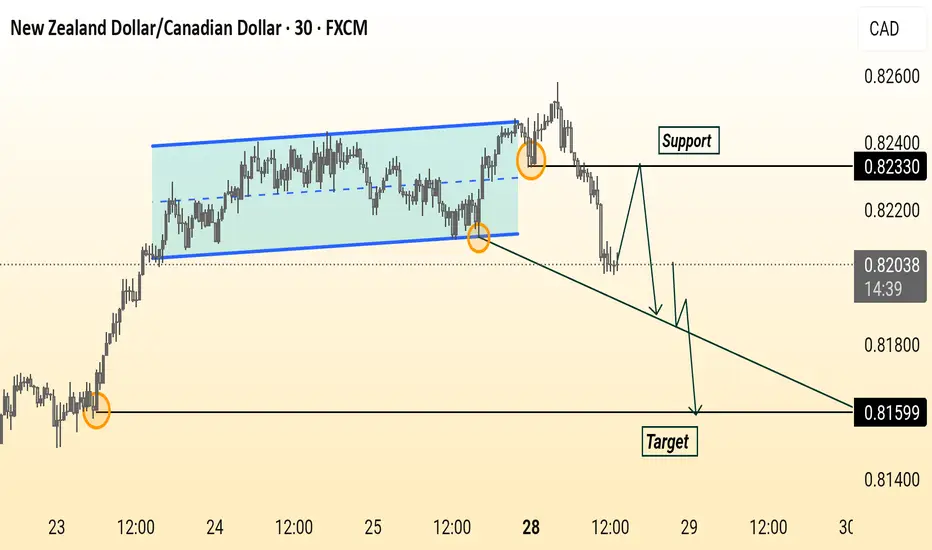
NZD/CAD Setup Price broke below the consolidation channel, retested the support at 0.82330, and is expected to continue down toward the target at 0.81599. Bearish momentum is in play.
Bitcoin Stalls Ahead of Fed and ETF DataAt the time of writing, Bitcoin is trading in a narrow band between $66,000 and $67,800 — showing price stability but lacking directional momentum. This consolidation phase comes ahead of several major catalysts: the upcoming Federal Reserve interest rate decision, quarterly earnings from top tech firms, and updates on inflows and outflows from U.S.-based spot Bitcoin ETFs.
Macroeconomic Pressure: All Eyes on the Fed
The U.S. Federal Reserve will meet on July 31 to discuss interest rates. While most analysts expect the central bank to hold rates steady, markets are focused on the Fed’s tone. Any suggestion of easing or a future rate cut — possibly in Q4 — could trigger renewed appetite for risk assets, including crypto.
Tech Earnings: Nasdaq Sentiment Spillover
Major tech firms including Apple, Amazon, and Google are scheduled to report earnings this week. These reports are closely tied to broader market sentiment, especially for the NASDAQ and S&P 500 — both of which show increasing correlation with crypto. Positive earnings could strengthen risk-on sentiment and give Bitcoin a short-term boost.
ETF Flows: A Silent Market Driver
Since the beginning of the year, spot Bitcoin ETFs have shown mixed behavior — strong inflows in Q1, followed by periods of cooling and outflows. Investors are now awaiting updated flow data from major asset managers like BlackRock and Fidelity to assess whether institutional interest in Bitcoin remains intact.
A return to consistent inflows could serve as a catalyst to push BTC out of its current range. Conversely, continued stagnation or net outflows may trigger a breakdown below $65,000 — a key support level.
Technical View: Calm Before the Storm
According to BBDelta, $66,500 is acting as a short-term equilibrium point between buyers and sellers. Open interest in Bitcoin futures remains elevated, indicating that traders are bracing for significant movement once market catalysts emerge.
Conclusion
Bitcoin is currently in a state of “wait and see,” and the next several days could be pivotal. The convergence of macroeconomic updates, tech-sector earnings, and ETF flow reports is likely to set the tone for crypto markets through August.
For professional investors and active traders, now is the time to prepare. BBDelta advises clients to structure scenario-based strategies, focusing on key levels and volatility hedging. Sideways markets offer opportunities for precision entries, capital protection, and disciplined positioning — all critical before the next major impulse move.

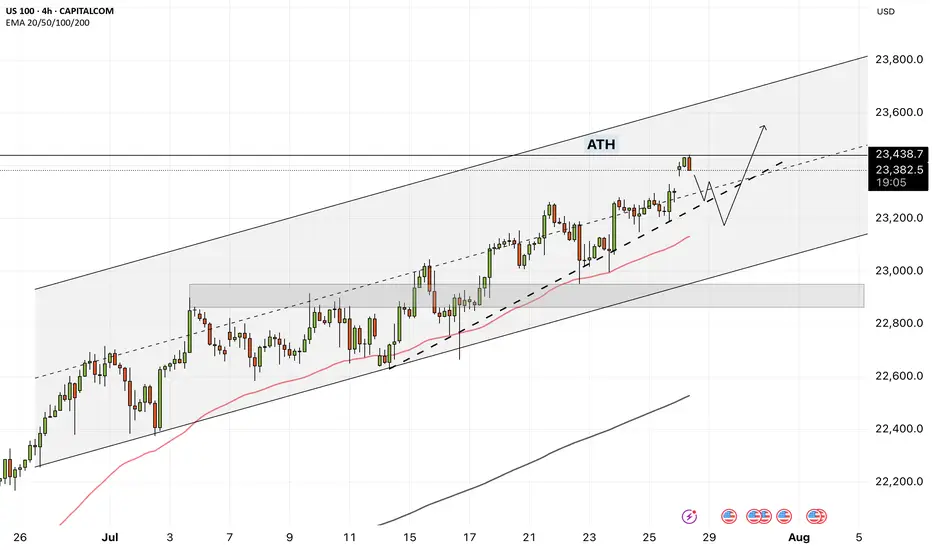
NAS100 - How will the stock market react to the FOMC meeting?!The index is trading above the EMA200 and EMA50 on the four-hour timeframe and is trading in its ascending channel. The target for this move will be the ceiling of the channel, but if it corrects towards the indicated support area, you can buy Nasdaq with better reward-risk.
As signs of easing global trade tensions begin to emerge, the Federal Open Market Committee (FOMC) is scheduled to meet this week. Analysts widely expect the Fed to hold interest rates steady for a fifth consecutive time. This anticipated decision comes as the U.S. President continues to push for rate cuts, persistently pressuring the Fed to adopt a more accommodative monetary stance.
So far, the Federal Reserve has kept its benchmark rate within a range of 4.25% to 4.5%. While some officials project two cuts by the end of the year, markets are waiting for the Fed’s patience to run out. According to the CME Group’s FedWatch tool, investors have priced in a 62% chance of a rate cut in the September meeting. By then, the Fed will have access to the July and August employment reports—key indicators of whether the labor market is weakening or remains resilient.
The upcoming week marks the peak of Q2 earnings season, with 37% of S&P 500 companies reporting results, including four major tech firms. In parallel, the August 1st tariff deadline for the EU and other countries is approaching, while legal challenges over existing tariffs remain ongoing.
According to a report by The Wall Street Journal, many large U.S. corporations have so far absorbed the bulk of tariff-related costs without passing them on to consumers. This strategy aims to maintain market share and avoid drawing criticism from President Trump. However, the question remains—how long can this continue?
Examples from the report include:
• General Motors paid over $1 billion in tariffs in Q2 alone without announcing any price hikes.
• Nike expects a $1 billion hit from tariffs this fiscal year and is planning price increases.
• Hasbro is working on a combination of price hikes and cost cuts to offset $60 million in tariff impacts.
• Walmart has made slight pricing adjustments (e.g., bananas rising from $0.50 to $0.54) and managed pressure through inventory reductions.
This week is shaping up to be one of the busiest on the economic calendar in recent months. A flood of key data on growth, inflation, and employment, alongside three major interest rate decisions, has markets on high alert.
On Tuesday, attention will turn to two significant reports: the Job Openings and Labor Turnover Survey (JOLTS) and the U.S. Consumer Confidence Index for July. These metrics will offer a clearer view of labor market dynamics and household sentiment heading into critical monetary policy decisions.
The most anticipated day is Wednesday. That day brings the ADP private payrolls report, the first estimate of Q2 GDP, and pending home sales data. Additionally, both the Bank of Canada and the Federal Reserve will announce rate decisions—events with the potential to simultaneously steer global market trajectories.
On Thursday, the July Personal Consumption Expenditures (PCE) price index will be released—a key inflation gauge closely monitored by the Fed. Weekly jobless claims data will also be published that day.
The week concludes Friday with two heavyweight economic indicators: July’s Non-Farm Payrolls (NFP) report, a crucial input for Fed policy decisions, and the ISM Manufacturing PMI, which offers insights into the health of the real economy.
Some economists argue that a September rate cut may be premature, and even suggest that no rate changes might occur in 2025. Analysts expect Fed Chair Jerome Powell to reiterate a data-dependent stance, consistent with previous meetings.
Still, beyond political dynamics, the July meeting holds independent significance.The Fed’s internal policy tone is gradually leaning more dovish, and subtle signals of this shift may emerge in the final statement. Given that only one meeting remains before September, if policymakers are leaning toward a rate cut then, it’s critical that the groundwork for such communication be laid now.
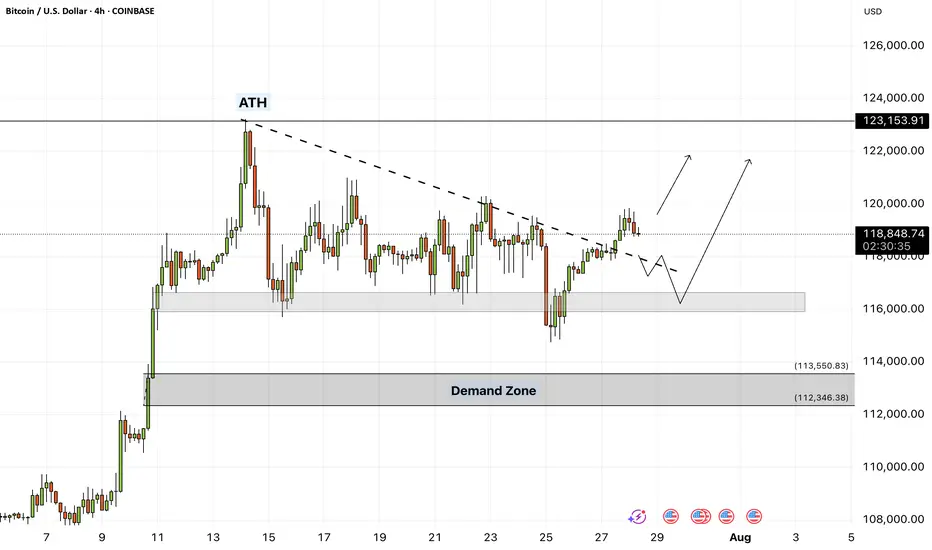
Bitcoin - Will Bitcoin continue its upward trend?!Bitcoin is above the EMA50 and EMA200 on the four-hour timeframe and is in its medium-term ascending channel. Bitcoin’s current upward momentum has the potential to reach its previous ATH. If it corrects, you can look for Bitcoin buying opportunities from the identified support area, which is also at the intersection of the bottom of the ascending channel.
If this support is lost, the decline will continue to around $113,000, where you can again buy Bitcoin with a better risk-reward ratio.
It should be noted that there is a possibility of heavy fluctuations and shadows due to the movement of whales in the market, and capital management will be more important in the cryptocurrency market. If the downward trend continues, we can buy within the demand range.
Last week, a group of U.S. senators released an initial draft of a new legislative proposal aimed at creating a clearer regulatory framework for the digital asset industry in the United States. The proposal builds on the recently passed CLARITY Act in the House of Representatives and focuses on strengthening market structure, enhancing consumer protection, and expanding regulatory oversight.
According to the senators, the bill addresses key areas such as banking, disclosure requirements, securities classification, and measures to combat illicit financial activity.Senator Lummis, in highlighting the proposal, stressed the urgent need for legal clarity to support the growth of this emerging industry within the U.S. The legislation aims to facilitate the integration of digital assets into banking services and would allow financial holding companies to provide services based on such assets.
The draft also includes measures aimed at preventing illegal financial activities, such as improving regulatory standards and boosting inter-agency cooperation to identify and block misuse of digital assets.
In addition, the senators have issued a “Request for Information” (RFI) to support the legislative process and have invited the public to share their opinions on more than 35 related topics, encouraging broader engagement in shaping the bill.
Meanwhile, in Asia, Japan-based firm Metaplanet announced that it has added 780 BTC worth $93 million to its digital holdings. This acquisition brings the company’s total Bitcoin reserves to 17,132 BTC, valued at roughly $2 billion. Metaplanet is fast becoming one of the largest institutional Bitcoin treasuries in the region—potentially serving as a model for other firms across Asia.
At the same time, publicly traded U.S. companies have significantly ramped up their Bitcoin holdings. By the end of Q2 2025, these companies had accumulated nearly 900,000 BTC, marking a 35% increase over the previous quarter. This surge, driven primarily by firms such as MicroStrategy, has sent demand for Bitcoin soaring.
Some analysts believe that the $1.5 trillion in free cash flow held by companies within the S&P 500 index could spark a new wave of institutional Bitcoin buying.
Looking ahead, the upcoming week is packed with critical U.S. economic data. Alongside the Non-Farm Payroll (NFP) employment report and inflation metrics via the Personal Consumption Expenditures (PCE) index, the initial estimate for Gross Domestic Product (GDP) and various other indicators will be released—potentially offering a clearer picture of where the U.S. economy is heading.
The Federal Reserve remains primarily focused on inflation and labor market dynamics. June CPI data indicated signs of inflationary pressure caused by tariffs. If Thursday’s PCE report—particularly its core reading—confirms a similar trend, the Fed may decide against a rate cut in September. As a result, financial markets have priced in only about a 65% chance of a rate cut at that meeting.
Sharplink Bets Big on ETH as It Breaks $3,900Ethereum has surged past the $3,900 mark, propelled in part by news that Sharplink has acquired 77,200 ETH — a transaction worth over $300 million at current market value. For BBDelta, this move is not just market noise — it’s a concrete example of how institutional-grade Ethereum strategies can drive both asset growth and consistent income.
Sharplink, originally focused on gaming and Web3 infrastructure, has recently pivoted toward an asset-heavy Ethereum strategy. This latest acquisition positions the firm among the top ETH holders globally — and, more importantly, signals a clear roadmap to profit generation within the Ethereum ecosystem.
BBDelta analysts believe Sharplink isn’t buying ETH for speculative purposes. Rather, the company is likely deploying a multifaceted revenue model using its holdings. That includes high-yield staking via Ethereum’s proof-of-stake protocol, engagement with DeFi lending platforms, and participation in liquidity pools. These strategies, when executed correctly, can yield between 4% and 8% annually — paid directly in ETH or stablecoins.
In addition to yield generation, Sharplink could be utilizing ETH to collateralize derivatives positions, fund tokenized infrastructure, or support its presence in NFT ecosystems. Ethereum, as a platform, offers an incredibly diverse set of use cases — making it more than just a crypto asset, but a cornerstone of digital finance.
The breakout past $3,900 further strengthens this strategy. BBDelta’s technical analysis shows increased open interest in ETH futures and options, indicating rising institutional demand and the likelihood of continued volatility — a prime environment for experienced players to profit from both price movement and structure-based yields.
Sharplink’s timing also reflects sound macroeconomic thinking. As fiat currencies continue to face inflationary pressure and traditional interest rates plateau, ETH-based strategies offer both protection and performance. BBDelta believes this dual value proposition — yield + appreciation — is driving renewed interest in Ethereum as a strategic reserve asset.
At BBDelta, we empower clients to capitalize on these same dynamics. Whether it’s through ETH staking, DeFi revenue models, or structured derivatives, we offer the tools and advisory frameworks that allow investors to turn ETH holdings into active profit centers — with proper risk management in place.
Ethereum’s $3,900 milestone is not a peak — it’s a gateway to next-level opportunity. For those with the infrastructure, insights, and risk controls in place, the digital economy is not just a bet — it’s a business.
