Fundamental Market Analysis for July 28, 2025 GBPUSDThe pound is sliding to 1.34250, reacting to a fresh slowdown in UK inflation and reduced expectations of further tightening from the Bank of England. The annual CPI for June fell to 2.2%, the lowest since March 2022, allowing the regulator to keep rates unchanged at the August meeting.
Meanwhile, rising Treasury yields intensify capital inflows into dollar assets after a strong US Q2 GDP report (+2.4% q/q). The British economy remains close to stagnation: the services PMI fell to 49.8, indicating shrinking orders and wage pressure.
Political risks also weigh on the pound: the ruling party's parliamentary majority shrank after unscheduled by-elections, complicating the government's implementation of fiscal stimulus. Collectively, this increases the attractiveness of selling the pair ahead of the Fed meeting, where markets price in a possible rate hike by year-end.
Trade recommendation: SELL 1.34250, SL 1.34450, TP 1.33250
Fundamental Analysis

Europe and the US Sign Trade Agreement, EUR/USD DeclinesEurope and the US Sign Trade Agreement, EUR/USD Declines
The past weekend was marked by the official signing of a trade agreement between the United States and Europe, as announced by US President Donald Trump and President of the European Commission Ursula von der Leyen following their meeting in Scotland.
According to reports, the agreement is based on a 15% baseline tariff on goods exported from Europe to the United States, with certain exemptions. As previously reported, a trade agreement with a 15% baseline tariff had earlier been concluded between the US and Japan.
According to President Trump:
→ under no circumstances did he allow the baseline tariff for Europe to fall below 15%;
→ the European Union committed to investing in the US economy, purchasing weapons, and importing energy resources.
The financial markets’ reaction to this news is noteworthy:
→ European stock indices opened the week with a bullish gap, reflecting relief that previously feared tariffs of up to 30% did not materialise;
→ the EUR/USD pair is exhibiting bearish momentum this morning.
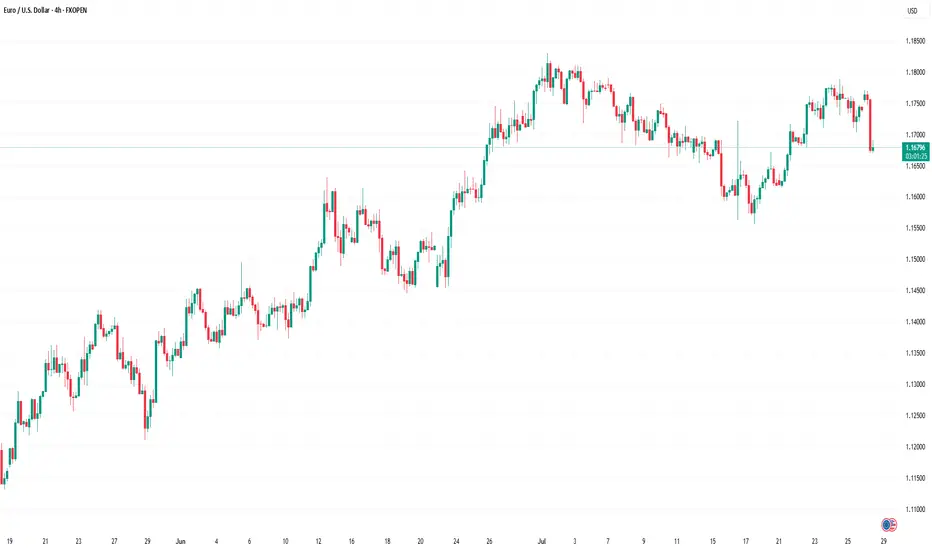
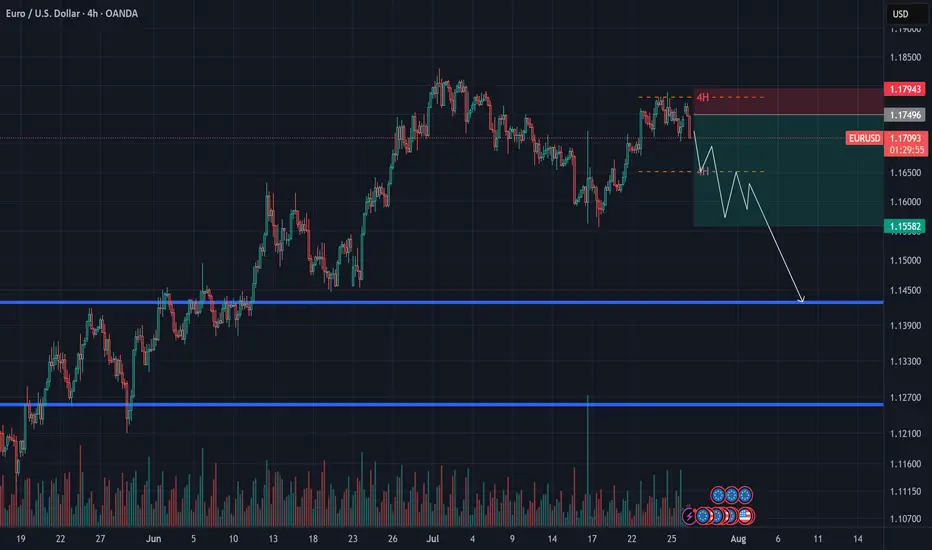
Technical Analysis of the EUR/USD Chart
As indicated by the black arrow, bearish sentiment intensified on Monday morning, pushing the pair towards the 1.1700 level, which had previously acted as resistance in mid-July.
From the perspective of the ascending channel (shown in blue), its median line is currently acting as a resistance level – following contact with it, a short-term rally was broken (highlighted in purple). This reinforces the notion that bears are currently in control.
Given the above, we could suggest that, should bearish sentiment persist on the EUR/USD chart, we may soon witness an attempt to break through the 1.1700 support level. A successful breach could open the path for further downside movement of the euro against the dollar, towards the lower boundary of the channel.
This article represents the opinion of the Companies operating under the FXOpen brand only. It is not to be construed as an offer, solicitation, or recommendation with respect to products and services provided by the Companies operating under the FXOpen brand, nor is it to be considered financial advice.
EURUSD Did Not Like the EU–US DealThe heavily one-sided EU–US deal has put negative pressure on EURUSD. Ahead of a crucial week filled with major events, including GDP data from both the Eurozone and the US, the PCE report, payrolls, and meetings from the FOMC and BOJ, EURUSD has broken a short-term head and shoulders formation. The pattern's target is near 1.1610.
A retest of the broken support is possible and could even extend to 1.1725. However, unless sentiment changes due to some news, this move may offer only a selling opportunity. The downward trend could also continue without pause.
Options market activity suggests that the 1.16 to 1.18 range is viewed as a "safe zone," with large players likely aiming to keep EURUSD within this band for the week. If the head and shoulders target is reached, EURUSD might stabilize and bounce around the 1.16 level.

“Biggest Trade Deal Ever” — 5 Things to Know in Bitcoin This WeeAs Bitcoin enters the final trading week of July 2025, global markets are responding to what many are calling the “biggest trade deal ever”—a multilateral digital finance agreement between the United States, the European Union, and five Asia-Pacific countries. While the implications are far-reaching for global payments, the spotlight remains squarely on Bitcoin, which has now firmly reclaimed the $120,000 level.
Here are five key developments shaping Bitcoin’s trajectory this week:
1. Digital Trade Pact Signals Institutional Legitimacy
The newly signed agreement includes provisions for cross-border tokenized settlement, streamlined regulations for digital asset custodians, and recognition of Bitcoin as a “monetizable asset class” in interbank systems. While CBDCs and stablecoins will be used in formal settlements, the framework opens the door for Bitcoin to function as reserve collateral.
“This is the first time sovereign regulators have embedded Bitcoin into a multilateral economic framework,” said Janice Harlow, senior strategist at Beacon Global.
2. ETF Inflows Return After Brief Slowdown
After a two-week lull, Bitcoin spot ETFs have seen renewed demand, with $850 million in net inflows over the past five trading sessions. The iShares Bitcoin Trust (IBIT) and Fidelity’s FBTC led inflows, signaling re-accumulation by institutional buyers.
Derivatives data from CME suggests traders are positioning for upside, with call options volume outpacing puts at a 2.3:1 ratio.
3. Hash Rate Hits All-Time High
Bitcoin’s hash rate has climbed to a new record high, exceeding 640 EH/s, indicating miner confidence and long-term investment in infrastructure. This surge comes despite the recent halving, which slashed block rewards and pressured weaker miners.
The increasing energy commitment suggests miners are betting on future price appreciation and institutional demand stability.
4. Whale Activity Accelerates
On-chain analytics from Glassnode show a sharp uptick in accumulation by wallets holding over 10,000 BTC. Approximately $2.1 billion in BTC has been withdrawn from exchanges in the past week, pointing to strong conviction among whales and high-net-worth investors.
“This looks less like speculation and more like positioning ahead of structural shifts,” noted Rishi Kulkarni, managing partner at TitanBay Capital.
5. Technical Indicators Flash Bullish
Bitcoin has reclaimed its 50-day and 200-day moving averages, and RSI (Relative Strength Index) remains in neutral territory at 56—suggesting room for further upside without overheating.
With the $128,000 resistance level in sight, many analysts believe a breakout to $140,000 is plausible in August, barring macroeconomic shocks.
Final Thoughts
With regulatory breakthroughs, strong on-chain data, institutional accumulation, and miner alignment, this week’s developments may mark a turning point in Bitcoin’s evolution from speculative asset to globally integrated infrastructure.
Whether the “biggest trade deal ever” delivers on its promise remains to be seen—but for Bitcoin, the direction appears clear: up and institutional.

Market Analysis: Oil Prices Ease – Market Awaits Fresh CatalystMarket Analysis: Oil Prices Ease – Market Awaits Fresh Catalyst
WTI crude oil is also down and remains at risk of more losses below $64.60.
Important Takeaways for WTI Crude Oil Price Analysis Today
- WTI crude oil price continued to decline below the $66.00 support zone.
- It traded below a connecting bullish trend line with support at $65.60 on the hourly chart of XTI/USD at FXOpen.
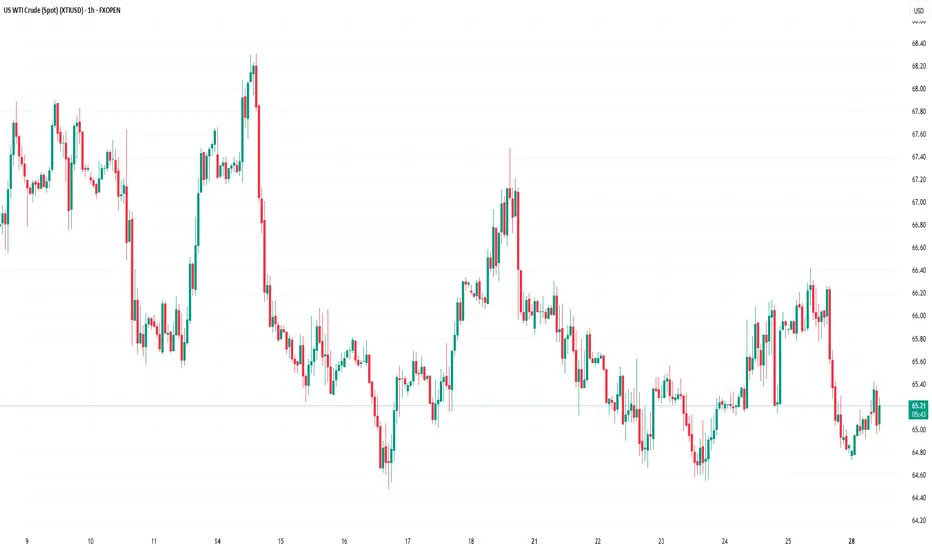
WTI Crude Oil Price Technical Analysis
On the hourly chart of WTI crude oil at FXOpen, the price struggled to continue higher above $67.50. The price formed a short-term top and started a fresh decline below $66.00.
There was a steady decline below the $65.80 pivot level. The bears even pushed the price below $65.00 and the 50-hour simple moving average. The price traded below a connecting bullish trend line with support at $65.60.
Finally, the price tested the $64.75 zone. The recent swing low was formed near $64.73, and the price is now consolidating losses. On the upside, immediate resistance is near the $65.60 zone. It is close to the 50% Fib retracement level of the downward move from the $66.42 swing high to the $64.73 low.
The main resistance is $65.80. A clear move above it could send the price towards $66.40. The next key resistance is near $67.50. If the price climbs further higher, it could face resistance near $70.00. Any more gains might send the price towards the $72.00 level.
Immediate support is near the $64.60 level. The next major support on the WTI crude oil chart is near $63.20. If there is a downside break, the price might decline towards $60.00. Any more losses may perhaps open the doors for a move toward the $55.00 support zone.
This article represents the opinion of the Companies operating under the FXOpen brand only. It is not to be construed as an offer, solicitation, or recommendation with respect to products and services provided by the Companies operating under the FXOpen brand, nor is it to be considered financial advice.
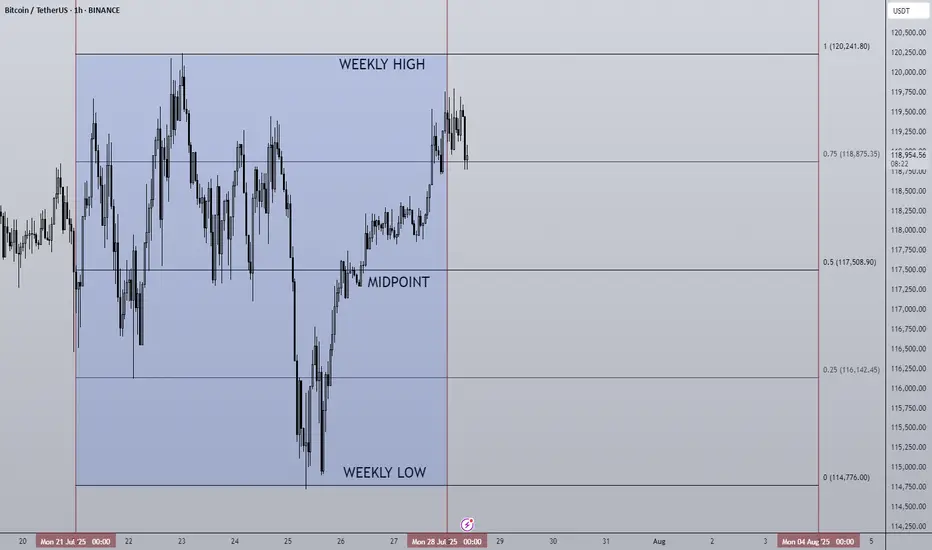
28/07/25 Weekly OutlookLast weeks high: $120,241.80
Last weeks low: $114,776.00
Midpoint: $117,508.90
As we approach the end of the month BTC continues to trade sideways during a cooling off period as altcoins finally take the stage. Last week Bitcoin saw a relatively flat net inflow via ETFs of $72m, ETH on the other hand posted the second largest net inflow week ever at $1.85B! The concentration has certainly shifted...
This IMO is still a very bullish structure for BTC, very shallow pullbacks being bought up/absorbed by still happy to purchase at these levels. As long as this continues altcoins have a strong base to continue growing on, if BTC breaks structure and price accepts below ~$110,000 then the altcoin rally will be over for now I believe.
This week some major altcoins are set to reach HTF resistance areas, ETH has already tagged $4,000 which looks to be a battleground level of major importance.
TOTAL2 which is the combined market cap of all altcoins is currently ~8% from the highs, keeping this in mind for where altcoins may run out of steam...
Good luck this week everybody!
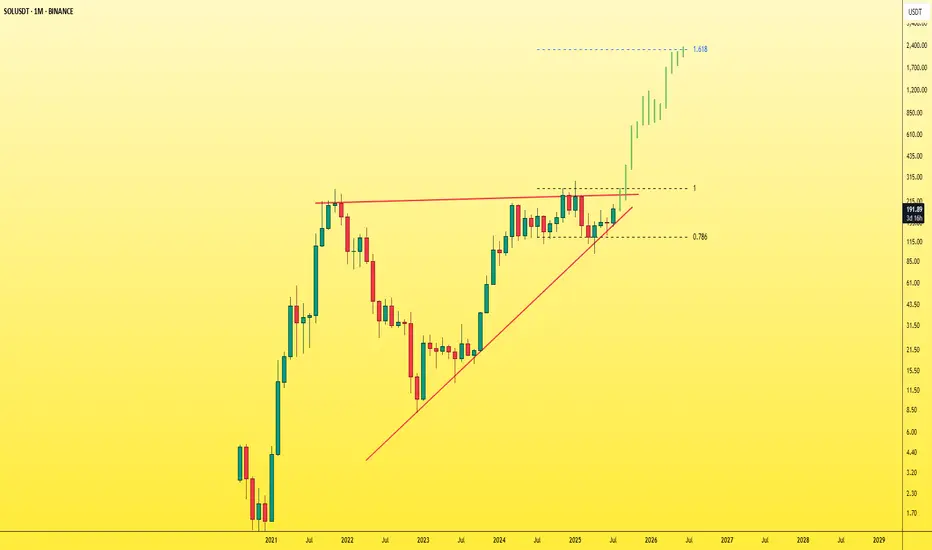
SOL - Don't miss the breakout before it's too late!The symmetrical triangle pattern on the monthly timeframe is showing signs of weakening after multiple failed breakout attempts — and now, a breakout seems highly likely.
Once SOL breaks out of this triangle, it will enter price discovery mode , opening the door to a massive bullish move. At that point, most traders will start saying “it’s too late”, while SOL keeps rallying aggressively — fueled by FOMO and liquidity traps.
You'll see:
- People outside the market waiting for a pullback that never comes.
- Traders inside the move getting shaken out by small dips and volatility.
Right now, SOL is still in a fair trading zone and available at a reasonable price .
Don’t wait for it to explode and then chase. Get in before the breakout .
Best Regards:
Ceciliones🎯
AUD/CAD’s Big Move: Don’t Sleep on This Breakout Setup!Hey traders, Skeptic from Skeptic Lab here! 🔥 While everyone’s freaking out over interest rate news and Non-Farm Employments , AUD/CAD ’s stealing the show on the daily time frame.
📉Post-tariff crash, it’s rebounding strong. A daily resistance break could kick off a major uptrend. Use RSI overbought/oversold ( linked in my TradingView article ) to confirm momentum.
👀Beware of fakeouts this week—volatility’s high! Trade smart, keep risk tight, and don’t FOMO. Share your thoughts in the comments, boost if it helps <3 🩵

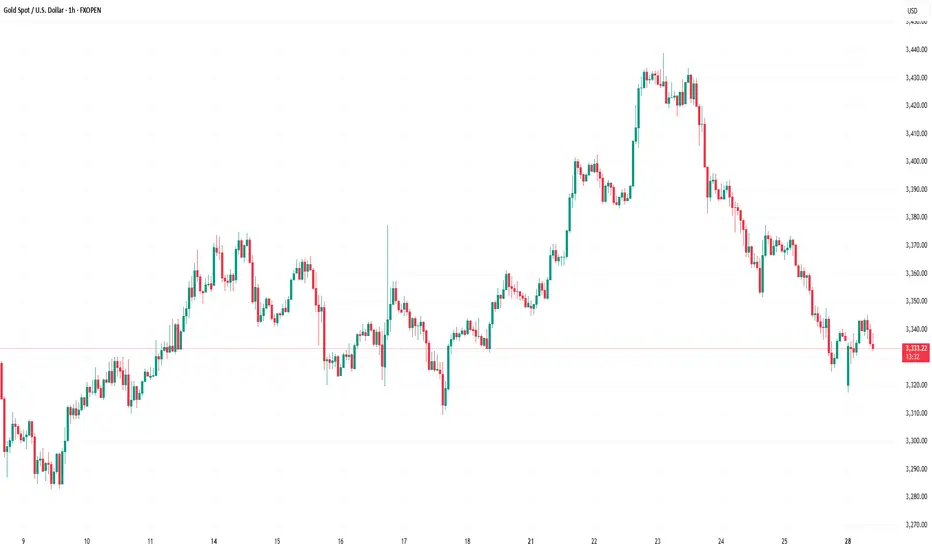
Market Analysis: Gold Prices Ease – Market Awaits Fresh CatalystMarket Analysis: Gold Prices Ease – Market Awaits Fresh Catalyst
Gold price started a fresh decline below $3,380.
Important Takeaways for Gold Price Analysis Today
- Gold price climbed higher toward the $3,430 zone before there was a sharp decline against the US Dollar.
- A key bearish trend line is forming with resistance near $3,350 on the hourly chart of gold at FXOpen.
Gold Price Technical Analysis
On the hourly chart of gold at FXOpen, the price climbed above the $3,380 resistance. The price even spiked above $3,400 before the bears appeared.
A high was formed near $3,432 before there was a fresh decline. There was a move below the $3,380 support level. The bears even pushed the price below the $3,350 support and the 50-hour simple moving average.
It tested the $3,325 zone. A low was formed near $3,325 and the price is now showing bearish signs. There was a minor recovery wave towards the 23.6% Fib retracement level of the downward move from the $3,433 swing high to the $3,325 low.
However, the bears are active below $3,342. Immediate resistance is near $3,350. There is also a key bearish trend line forming with resistance near $3,350.
The next major resistance is near the $3,380 zone. It is close to the 50% Fib retracement level of the downward move from the $3,433 swing high to the $3,325 low. The main resistance could be $3,410, above which the price could test $3,432. The next major resistance is $3,450.
An upside break above $3,450 could send the gold price towards $3,465. Any more gains may perhaps set the pace for an increase toward the $3,480 level.
Initial support on the downside is near the $3,325 level. The first major support is near the $3,310 level. If there is a downside break below it, the price might decline further. In the stated case, the price might drop towards the $3,265 support.
This article represents the opinion of the Companies operating under the FXOpen brand only. It is not to be construed as an offer, solicitation, or recommendation with respect to products and services provided by the Companies operating under the FXOpen brand, nor is it to be considered financial advice.
USD/CHF Climbs as Focus Shifts to U.S. Data, Swiss Franc Awaits Technical Analysis
On the 4-hour chart, USD/CHF is building a recovery from the 0.79441 low. Notably, the pair is not retesting the previous falling trendline but is approaching a critical resistance at the last swing high of 0.79793.
If bullish momentum persists, a break above 0.79793 (last swing top and 100% Fibonacci retracement) will open the way to 0.79889 (127.2% Fib extension), 0.80011 (161.8% extension), and potentially the psychological 0.80145 level. The widening Bollinger Bands support the case for an extended move if resistance is cleared.
Alternative Scenario:
Should the pair fail to clear 0.79793, a reversal toward 0.79659 or even a retest of the 0.79441 low becomes plausible. This would likely occur if U.S. macro data disappoints or if safe-haven flows return to CHF.
Fundamental Outlook
US Treasury Bill and Note Auctions:
The 3-month, 6-month, 2-year, and 5-year note auctions will attract institutional attention for yield and demand, but are not expected to cause direct volatility in USD/CHF barring a significant spike in yields or a poor auction result.
No high-impact Swiss data is scheduled today. The franc remains guided by risk sentiment, expectations around SNB liquidity operations, and potential intervention signals.

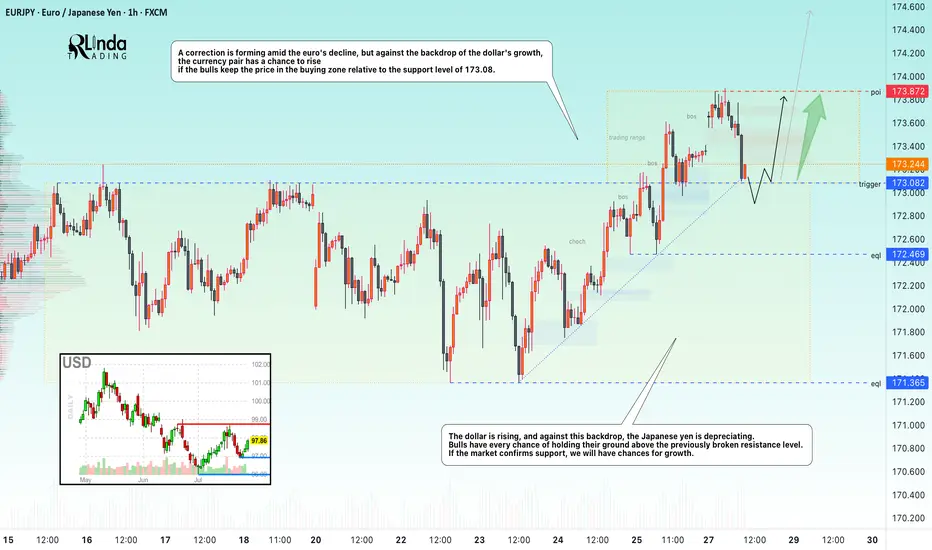
EURJPY → Retest support before growthFX:EURJPY has been correcting since the opening of the European session. The movement was triggered by yesterday's news related to the trade deal between the US and Europe...
EURJPY is reacting to news related to the deal between the US and Europe. A correction is forming amid the fall of the euro, but against the backdrop of the dollar's growth, the currency pair has a chance to rise if the bulls keep the price in the buying zone relative to the support level of 173.08.
The dollar is rising, and against this backdrop, the Japanese yen is falling. Bulls have every chance of holding their ground above the previously broken resistance. If the market confirms support, we will have chances for growth.
Resistance levels: 173.87
Support levels: 173.082, 172.47
The currency pair may form a liquidity trap relative to the previously broken consolidation resistance. A false breakdown of support and price consolidation in the buying zone (above 173.1) could trigger further growth.
Best regards, R. Linda!
Short Term Market Reversal IncomingRetail’s still buying breakouts, but the music just stopped.
This was the rally they weren’t supposed to catch.
Now it’s time to flip the script and bleed it back to origin.
Trading is a very difficult profession. Most people fail, but it's also not impossible. If you don't trade you're a loser.
It's a zero-sum game. 0 1
Zero-sum game is a mathematical representation in game theory and economic theory of a situation that involves two competing entities, where the result is an advantage for one side and an equivalent loss for the other.
It's all just digits on a screen and if they want your money they'll take your money, so you gotta respect your risk management if you don't want to lose everything or you'll have to break the matrix by seeing into the future,
Once you get to see the future. THERE IS NO TURNING BACK.
If you're reading this I hope you're having a great year. This year is all about endings and new beginnings. So stay locked in.
WAGMI
Oh yeah don't forget I gave you guys FX_IDC:EURUSD at 1.03 and FX_IDC:XAGUSD at $22
Nerds

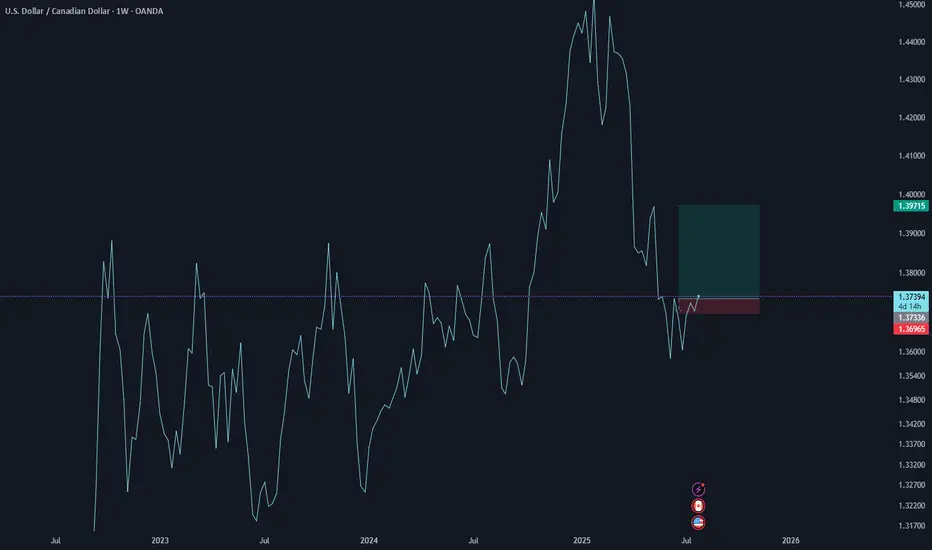
usdcad long Fundamental and candle stick , market structure
up to 1.39750
possible moving
swing long idea for 2 months
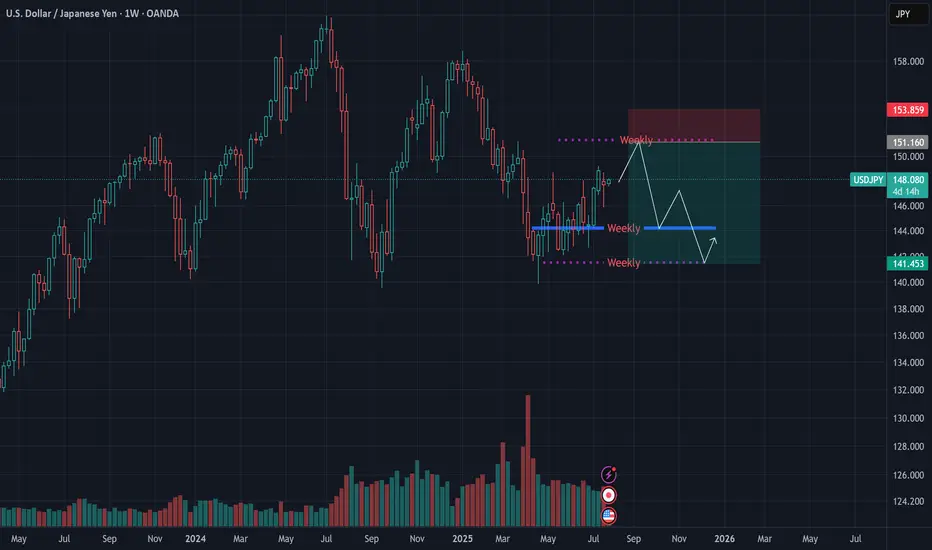
USDJPY Macro Analysis – July 27, 2025We’ve been tracking the yen for months and, since the beginning of the year, have signaled a potential appreciation in its value, largely based on the Bank of Japan’s policy stance.
📉 However, recent price action — particularly the return to prior levels — revealed a shift in Japan’s macroeconomic direction.
🇯🇵 Last week, we saw the first formal confirmations, with Japan making its largest-ever investment in the U.S.
This suggests a new approach to currency valuation, and we may now witness another phase of yen weakness.
🌀 That said, the market remains uncertain and indecisive, so it’s wise to hold off on major long-term entries until further confirmation.
🎯 A tactical entry around the 150 level could be reasonable in the meantime, as we wait for clearer signals.
EURUSD Outlook – July 27, 2025This week, the EU is set to release key economic data, including GDP figures.
Given the recent U.S. tariff pressure, there’s a strong chance that these numbers will come in weak — weighing further on the euro.
📉 After bouncing from the 1.15 level, EURUSD entered a corrective move, but even with extended consolidation, it failed to reach the previous high — a sign of growing exhaustion.
📌 Price action suggests a lack of bullish momentum, and candles are reflecting market fatigue.
🔁 I expect the euro to enter a mid-term corrective phase, potentially heading back toward the 1.13 zone.
🎯 A short entry below 1.18 could offer a favorable risk-reward setup.
CHFJPY short Fundamental and candles structure
Check ATH today , now mid term short position possible
tp 300 pip
sl 30
swing short possible next 1 month short

XAGUSD Technical Outlook – July 27, 2025
Silver appears to be losing momentum at the top, and for the first time in a while, we’ve seen a strong bearish daily candle, suggesting that sellers may be stepping in more seriously.
🌀 Previous pullbacks mostly looked like profit-taking, but this drop seems to be accompanied by actual selling pressure.
Despite breaking the previous high over the past two weeks, silver has failed to extend gains meaningfully — a potential sign of exhaustion.
🎯 A low-risk short opportunity may be forming around the $38–$39 range.
⚠️ For more patient and risk-tolerant traders, a daily close below $37 could open the door for a broader correction toward the $33–$35 zone — levels that have remained untested.
Stay sharp — momentum shifts often start quietly.

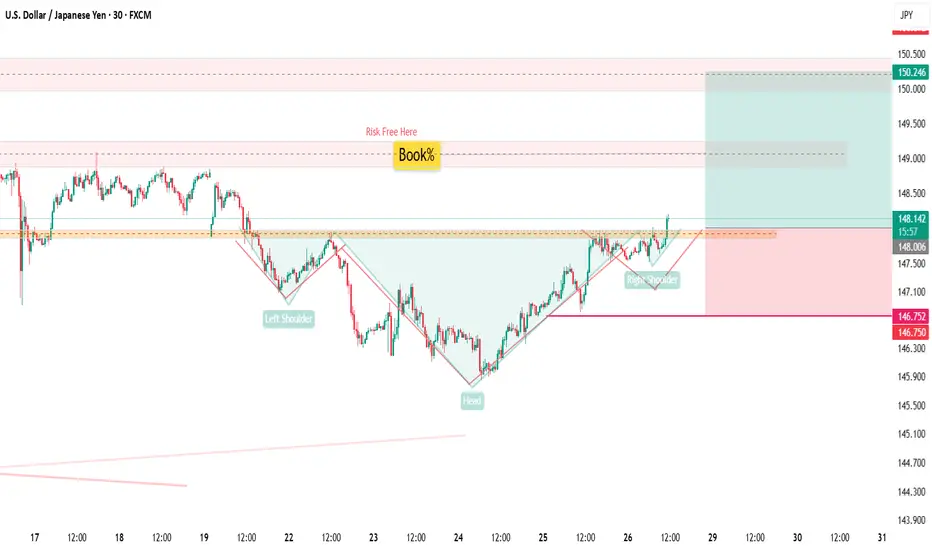
USDJPY30h Candle confirmed break out!
📢 USDJPY – 30H Breakout Confirmed
Technical Outlook:
Confirmed breakout on the 30H candle, signaling bullish.
Resistance break!
A Inverse Head & Shoulders pattern observed, though the right shoulder is slightly weaker than the left.
For safety, Stop Loss placed below the last Higher Low (HL) to respect market structure.
📍 Key Line:
“Imperfect structures can still produce perfect trades — when aligned with price action and fundamentals.”
🌐 USD Fundamentals Supporting the Bias:
Stronger-than-expected economic data (e.g., recent PMI and labor reports) continues to support USD strength.
Fed's hawkish stance and higher-for-longer rate policy remain favorable for the dollar against low-yielding currencies like JPY.
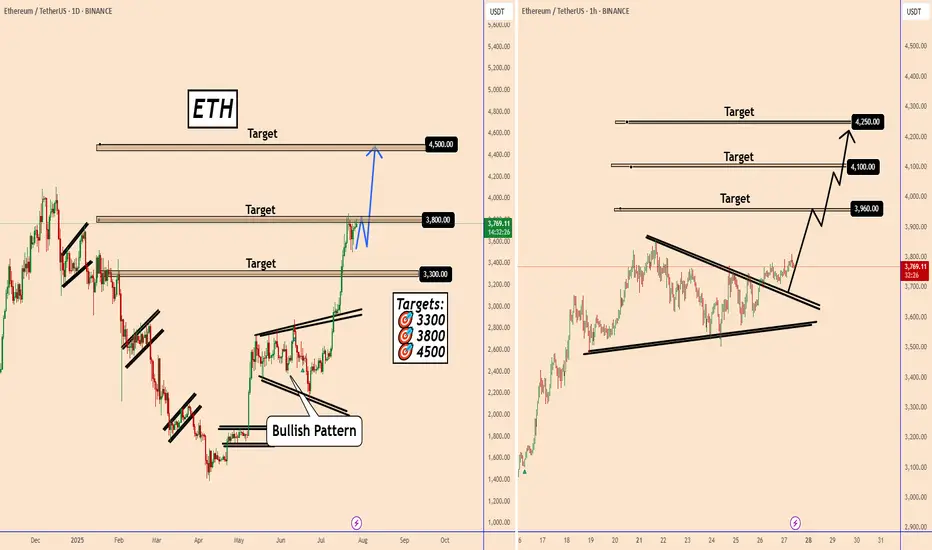
Ethereum: Multiple Time Frame AnalysisEthereum: Multiple Time Frame Analysis
From the chart, we can see that Ethereum is in a clear uptrend on all timeframes.
The daily chart is bullish and is not yet showing signs of a reversal on the May timeframe.
Yesterday, ETH also confirmed an ascending triangle pattern on a lower timeframe, indicating potential upside as shown in the chart.
Key target areas: 3960; 4100 and 4250
You may find more details in the chart!
Thank you and Good Luck!
PS: Please support with a like or comment if you find this analysis useful for your trading day
Is Samsung's Chip Bet Paying Off?Samsung Electronics is navigating a complex global landscape, marked by intense technological competition and shifting geopolitical alliances. A recent $16.5 billion deal to supply advanced chips to Tesla, confirmed by Elon Musk, signals a potential turning point. This contract, set to run until late 2033, underscores Samsung's strategic commitment to its foundry business. The agreement will dedicate Samsung's new Texas fabrication plant to producing Tesla's next-generation AI6 chips, a move Musk himself highlighted for its significant strategic importance. This partnership aims to bolster Samsung's position in the high-stakes semiconductor sector, particularly in advanced manufacturing and AI.
The deal's economic and technological implications are substantial. Samsung's foundry division has faced profitability challenges, experiencing estimated losses exceeding $3.6 billion in the first half of the year. This large-scale contract is expected to help mitigate those losses, providing a much-needed revenue stream. From a technological standpoint, Samsung aims to accelerate its 2-nanometer (2nm) mass production efforts. While its 3nm process faced yield hurdles, the Tesla collaboration, with Musk's direct involvement in optimizing efficiency, could be crucial for improving 2nm yields and attracting future clients like Qualcomm. This pushes Samsung to remain at the forefront of semiconductor innovation.
Beyond the immediate financial and technological gains, the Tesla deal holds significant geopolitical and geostrategic weight. The dedicated Texas fab enhances U.S. domestic chip production capabilities, aligning with American goals for supply chain resilience. This deepens the U.S.-South Korea semiconductor alliance. For South Korea, the deal strengthens its critical tech exports and may provide leverage in ongoing trade negotiations, particularly concerning potential U.S. tariffs. While Samsung still trails TSMC in foundry market share and faces fierce competition in High-Bandwidth Memory (HBM) from SK Hynix, this strategic alliance with Tesla positions Samsung to solidify its recovery and expand its influence in the global high-tech arena.

USOIL Analysis : MMC Bullish Setup Building on USOIL – Target🧠 Introduction & Trade Philosophy
In today’s 4H USOIL chart analysis, we are at a critical decision-making zone, where price action is preparing to make a major move in either direction, based on the response to a central demand zone. We are applying the MMC Rule, which emphasizes mirroring supply-demand behavior and validating market moves through structural confirmation.
The current price structure presents a classic MMC scenario, where price must either confirm a bullish double demand reaction or invalidate the setup by breaking the key zone and moving bearish.
📍 Chart Structure Explained
🔷 1. Central Reversal Zones (CRZs)
There are two CRZs highlighted:
The upper CRZ around 65.90–66.20, where price was previously rejected.
The lower CRZ, where price is currently consolidating, is around 64.80–65.50.
These zones are liquidity-rich areas where big players react—either by absorbing positions or driving directional moves.
🟢 2. Bullish Scenario – MMC Rule In Play (Path 1)
"If we want it bullish, we want 50% supply and demand will be double according to MMC Rule"
According to MMC, a bullish move must be confirmed by a strong reaction from demand, showing double the pressure of the last bearish move. Here's how that plays out:
Price respects the lower CRZ, bouncing near the 65.00 mark.
If this bounce gains momentum and breaks above the trendline resistance, the first target is the minor resistance at $69.00, followed by the major resistance zone near $70.50–$71.00.
A retest of broken structure, followed by bullish continuation, is expected. This is marked with the white zigzag projection labeled as “1” on the chart.
Watch for a clear higher high formation, which would indicate a shift in structure and validate bullish momentum.
🔻 3. Bearish Scenario – Breakdown Confirmation (Path 2)
"If it breaks, USOIL will go bearish"
If price fails to hold the current demand and closes below $64.80–64.50, it signals that demand has been absorbed, and MMC reversal has failed. In that case:
A clean breakdown below the demand zone will confirm bearish control.
The next downside target becomes $62.00, as labeled “2” on the chart.
The downward move is likely to follow a steep path as marked with the sharp downward trendline extension, especially if supported by volume and news catalysts.
🔄 Mirror Concept Highlight – Ellipse Area
The ellipse shape on the chart marks a previous compression zone followed by a breakout. This area represents an imbalance in supply that led to a sell-off. The MMC principle suggests the market tends to mirror these zones—if that was previous supply, and the current demand zone mirrors its positioning and structure, we can anticipate a similar reaction, but to the upside.
This is where the "50% double reaction" rule comes in—demand needs to show twice the strength to overcome the previous sell-side pressure.
🔧 Technical Levels Summary
Zone Type Price Range Notes
Major Resistance 70.50 – 71.00 Final target if bullish scenario plays out
Minor Resistance 68.80 – 69.20 First bullish checkpoint
Upper CRZ 65.90 – 66.20 Key structure to break for bulls
Lower CRZ (Support) 64.80 – 65.50 Demand base for bullish setup
Bearish Target Zone 62.00 – 61.80 Projected zone if support breaks
🧭 Trader’s Mindset & Risk Notes (MMC Style)
Wait for clear confirmation and price behavior near the CRZs before entering.
Use trendline breaks, candlestick confirmation, and volume to validate direction.
Avoid guessing the direction—let price tell the story.
Stick to MMC rules: No confirmation, no position.
✅ Bullish Criteria Checklist:
✔️ Price respects lower CRZ
✔️ Breakout above trendline
✔️ Closes above $66.20
✔️ Higher highs + strong bullish candles
✔️ MMC Double Demand Reaction Confirmed
❌ Bearish Breakdown Triggers:
❌ Breaks below $64.50
❌ Weak bounce + lower highs
❌ Volume increases on downside
❌ Clean breakdown structure
🚀 Trade Plan & Outlook
We’re now at a critical zone where market sentiment will soon be clear. Based on your MMC analysis, the bias remains bullish as long as price holds above $64.80. Be patient and let the setup complete with structure confirmation.
This is not just a technical play—it's a psychological zone, where institutional traders also make decisions. Follow the MMC logic and react with confirmation.

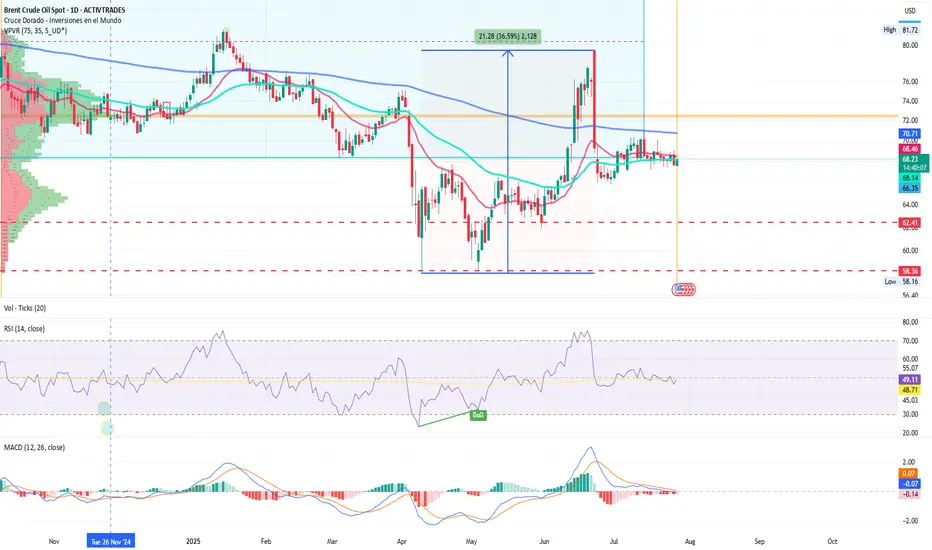
Brent: Crude Loses Its Shine Amid Mass Selloffs and Global FearsBy Ion Jauregui – Analyst at ActivTrades
Bearish pressure is intensifying in the oil market, with Brent crude leading the liquidation among major investment funds. The expiration of U.S. tariff exemptions on August 1st, combined with a global economic slowdown, has triggered a wave of risk aversion across energy commodities.
Funds Exit Oil: Alarming Figures
According to the latest data from the CFTC and ICE, hedge funds cut their net long positions in Brent by 11,352 contracts, bringing the total down to 227,393, the lowest level since April. For West Texas Intermediate (WTI), the decline was even sharper—over 10,000 contracts, reducing the net exposure to 86,088.
The bearish trend extends to refined products. U.S. diesel net positions fell to 38,945 contracts, although pure long positions reached 54,053, the highest level since February. In contrast, European gasoil showed relative strength as a safe haven, with long contracts increasing by 7,632 to 132,133—the highest level in more than three years.
Brent Technical Analysis: Critical Zone Under Pressure
From a technical perspective, Brent failed to break through the key $80 resistance level on June 23rd, which intensified selling pressure. Throughout July, prices have consolidated within an accumulation zone around $68, close to current levels. The year’s lows, recorded in May at $58.16, suggest a structural support around $62.41.
The loss of the 50- and 100-day moving averages reinforces the bearish bias. Should the current support break, Brent could swiftly move toward $64, a key technical support zone. Conversely, if prices hold above this level, a rebound toward the control zone around $72 could follow.
Technical indicators support the pessimistic outlook: the RSI stands at 48.32, in neutral territory but lacking upward momentum, while the MACD shows a bearish expansion, potentially signaling further downside unless strong buying emerges in the short term.
Valuations in Question
Despite the recent correction, the energy sector within the S&P 500 maintains an estimated P/E ratio of 15, above its historical average of 11–12, though still below the broader index average (~26×). This raises the classic dilemma: is this a value opportunity or a value trap in a structurally weakening demand cycle?
Conclusion
The oil market is facing a double challenge: weakened fundamentals and bearish technical signals. With institutional flows pulling back, macro uncertainty rising, and momentum indicators flashing red, caution is warranted.
The current levels may mark a strategic inflection point—or simply the prelude to deeper declines.
*******************************************************************************************
La información facilitada no constituye un análisis de inversiones. El material no se ha elaborado de conformidad con los requisitos legales destinados a promover la independencia de los informes de inversiones y, como tal, debe considerarse una comunicación comercial.
Toda la información ha sido preparada por ActivTrades ("AT"). La información no contiene un registro de los precios de AT, o una oferta o solicitud de una transacción en cualquier instrumento financiero. Ninguna representación o garantía se da en cuanto a la exactitud o integridad de esta información.
Cualquier material proporcionado no tiene en cuenta el objetivo específico de inversión y la situación financiera de cualquier persona que pueda recibirlo. La rentabilidad pasada y las estimaciones no sinónimo ni un indicador fiable de la rentabilidad futura. AT presta un servicio exclusivamente de ejecución. En consecuencia, toda persona que actúe sobre la base de la información facilitada lo hace por su cuenta y riesgo. Los tipos de interés pueden cambiar. El riesgo político es impredecible. Las acciones de los bancos centrales pueden variar. Las herramientas de las plataformas no garantizan el éxito.
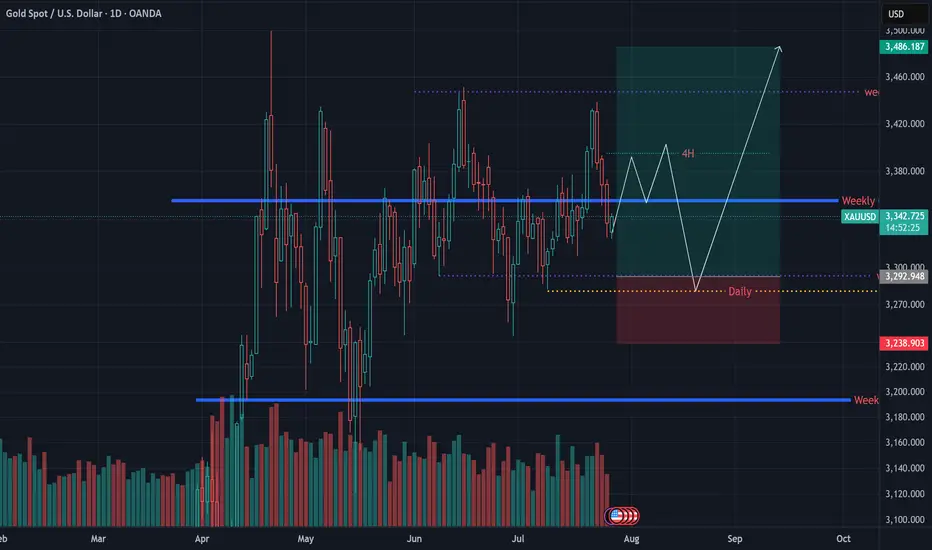
XAUUSD Analysis – July 27, 2025Last week, we marked the 3320–3330 zone as a potential buy-entry area. However, mid-term order flow pushed price above 3400 before reaching that level.
Toward the end of the week, a sell-off slightly weakened buyer confidence, and we now anticipate more cautious re-entries around the 3300–3290 region.
📈 The broader trend remains bullish for mid and long-term traders.
For scalpers trading against the trend, we recommend sticking to minor bearish pullbacks only, and managing risk tightly.
🔻 The 3390–3400 range offers a potential 300+ pip short opportunity for risk-averse sellers.
🟠 Risk-tolerant traders might consider holding shorts until the 3300 zone is tested.
⚠️ Key Insight: Given the liquidity build-up at 3400, if the price returns to this level, there’s a strong chance we’ll see a breakout above the previous high.