Gold Market Opens the Week with Bullish Hedge Toward 3370'sGold market opens the week by hedging into fresh demand at 3320's, building a bullish sentiment.
The price action now aims to mitigate 3370's, aligning with the continuation of the upward trajectory if structure holds. follow for more insights , comment and boost idea
Fundamental Analysis

Ye Chart Kuch Kehta Hai - Paradeep PhosphateWhat an amazing and clean chart this stock has got. Few perspective -
Stock Price Momentum:
The stock is trading above its 5, 20, 50, 100, and 200-day moving averages, showing strong upward momentum.
Volume & Performance:
Past 1 month: +26.58%. Past 1 year: +125%–137%.
Outperforming the Sensex, especially in 2025.
Breakouts:
Currently consolidating between ₹190–₹205. Technical breakout above ₹205 could move it towards ₹296 in 3 months, if broader market conditions support and volumes confirm the move.
Volatility:
3.7x as volatile as Nifty, indicating high risk and high reward.
Position in Sector:
Outperformance within a strong fertilizer theme.
Business Model:
Second-largest private phosphatic fertilizer company in India, with a broad manufacturing and distribution presence.
Return Metrics:
ROCE: 13.9% | ROE: 14.4% (but 3-year average only 9.6%).
Growth:
3-year compounded sales growth: 21%.
3-year compounded profit growth: 11%.
TTM profit growth: 376% (driven by recent performance rebound).
Profitability:
Net Profit Margin (TTM): 3.99% | Gross Margin: ~26%.
Balance Sheet:
Debt/Equity: 106.5%—relatively high, though not uncommon in asset-heavy fertilizer industry.
Valuation:
PE is above market average, indicating some overvaluation vs. long-term average.
PB ratio significantly above book, dividend yield still modest.
Risks:
High volatility, cyclical earnings potential.
Returns on equity are improving but still modest for long-term holding expectations (Buffett style).
Institutional ownership and low insider ownership suggest broad investor interest, but not heavy inside conviction.
Momentum/Technical:
Positive: Strong technical momentum, recent breakouts, all moving averages showing uptrend.
Actionable: Watch for breakout above ₹205 with volume, as it may target ₹296 in 3 months.
Note: As a trend/momentum investor, position sizing and risk management are crucial due to elevated volatility and the stock’s sharp run-up.
Value/Long-Term:
Positive: Largest domestic fertilizer player, steady profit growth, improving operating margins, scale in an essential industry.
Cautious: Valuation is somewhat elevated (high PE & PB). Margins (ROE/ROCE) are decent but not exceptional. High debt and sector cyclicality are notable risks. Dividend yield is low.
Actionable: "Buy only at a fair price"—the current valuation seems a bit rich relative to its book and historical earnings multiples. Consider accumulating on dips, or if you have a very long-term horizon and conviction on sectoral tailwinds.
No investment is risk-free—conduct your own due diligence and consider your own risk appetite before making a move.

BTC on 4H
"Hello, focusing on BTC on the 4-hour chart, the price is currently in a bullish momentum on higher time frames. However, it is showing signals indicating a potential completion of its pullback to the $110,000 zone. In my opinion, the $122,000 zone could be a good area to consider a sell position, with confirmation on the 15-minute chart. I plan to wait for this zone and then decide on initiating a sell position. If you have any updates or alternative perspectives on this analysis, please feel free to share."
If you need further clarification or have more details to discuss, please let me know!

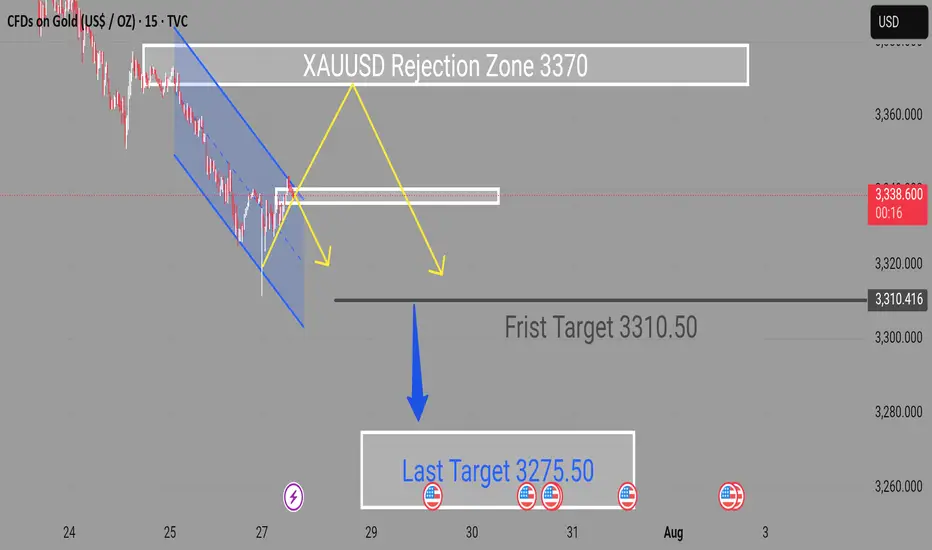
XAUUSD Selling Expecting Movement Buy Zone Activated after rejection from resistance
First Target 3310.50
Final Target 3275.50
The bullish breakout scenario remains valid as long as price holds above the lower channel boundary. A clean break and retest of the current structure could provide further confirmation for long entries.
Key Notes
Watch for volatility near marked U.S. data events
Maintain tight risk management and monitor for rejection candles near target zones
Unpack the Range, How to buy TeslaHello, I’m The Cafe Trader.
As part of our MAG 7 series, I’m going to show you how to find good pricing on TSLA for your long-term portfolio.
There’s a lot of hype surrounding Tesla right now — and for good reason. From a long-term investment standpoint, the future looks promising. But we still want to enter at the right price.
In my previous article, I gave TSLA a strong buy at $210–$220, and there were multiple opportunities in that range. But that was a few months ago. Let’s take a look at what the charts are telling us today.
⸻
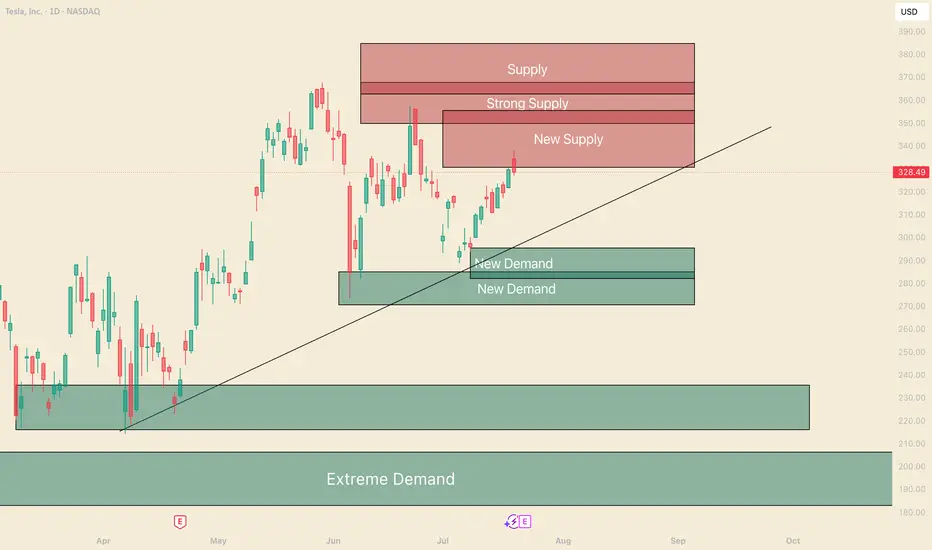
🔲 In the Middle of a Big Range
With a range from $212 to $488, Tesla offers plenty of opportunity for traders — but for investors, it can stir up anxiety.
If you’re holding shares around $330+ and considering selling just to break even, here are three reasons you may want to reconsider:
⸻
1. 🚀 Future Prospects
Tesla is packed with upcoming catalysts:
• Grok AI release
• The highly anticipated Model Q
• Megapack energy storage scaling on an industrial level
These innovations, along with strong brand momentum, could drive the stock 2x, 3x, even 5x over the next few years.
⸻
2. 📈 Trending Up
While some may argue we’re forming a double top, a deeper look at the weekly or monthly chart shows no real signs of weakness. If you’re investing — not just trading — you need that longer-term perspective.
Tesla remains in an uptrend with healthy structure and plenty of strength in the larger timeframes.
⸻
3. 🛡️ Learn to Hedge Your Position
Even if we see 20–30% downside from supply zones, there are ways to protect yourself.
Hedging with options — such as buying puts — can reduce downside risk without selling your shares. If done correctly, you can turn a large drawdown into a smaller loss or even a profit on the hedge.
⚠️ Only do this if you understand how options pricing and time decay work.
⸻
🧠 Passive vs. Aggressive Sellers
Today (July 21st), TSLA tapped into a supply zone and rejected quickly — a sign that sellers are still active around $330, while buyers lack confidence to push through.
🔹 Passive Selling
These are quiet, standing orders — often from large sellers who don’t want to move the market. They sell gradually to avoid spooking buyers.
🔹 Aggressive Selling
This is intentional unloading — where sellers push to exit their position quickly, even at the cost of driving the stock down.
What we saw today looked like passive selling — I’ll cover this in more detail in my short-term TSLA article.
⸻
📊 My Buy Zones for TSLA
Fair Price: $296–$310
• $296 is the top of recent buying liquidity
• $310 is the bottom of the current uptrend
• This is where aggressive buyers may show up if sellers ease off
Good Price: $270–$284
• $284 is a strong support level where reinforced buyers have stepped in
• This has been a hot zone and a likely area for long entries to return
Steal Price: $220–$235
• Not marked on the chart, but this zone is high-demand territory
• Even with bad press or short-term issues, this would be a great long-term value buy
⸻
That's All for TSLA Long Term. Follow and stay tuned for a short term analysis.
@thecafetrader
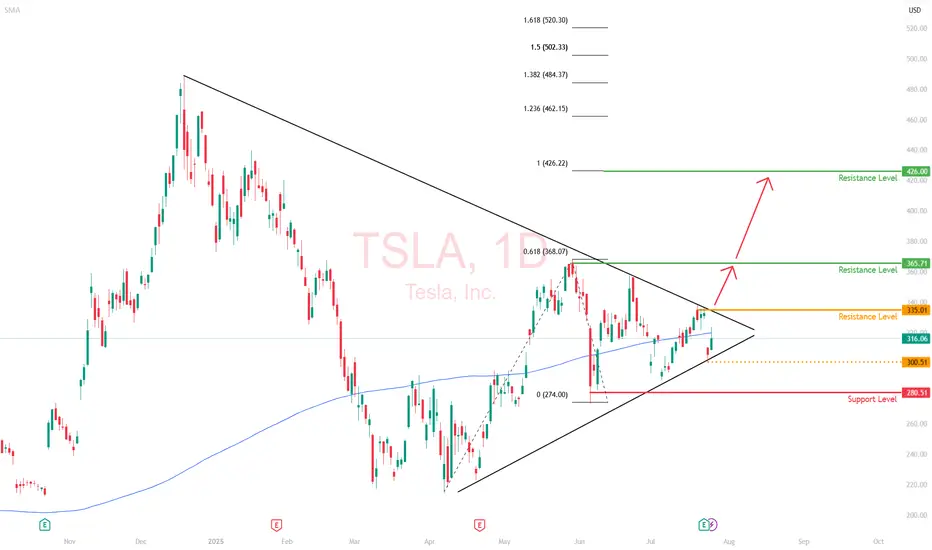
Tesla (TSLA) | Short-Term Compression, Long-Term ExTesla’s daily chart is coiled, with price currently trading at $316, sitting along the 200-day moving average. This looks like a consolidation phase with significant moves building up.
Price Action Snapshot
TSLA sold off last week, rejecting the $335 resistance level before finding footing around $300. The previous range of $280 and $365 is now tightening.
Immediate resistance sits at $335 with a clean breakout above that zone likely triggering momentum back toward the upper range of $365.
The recent drop does not seem like a capitulation move; it's likely institutional redistribution. Smart money is repositioning, not exiting.
Market Is Focused on the Wrong Data
Tesla’s Q2 earnings were objectively weak. Revenue fell 12%, deliveries dropped, and operating margins got clipped.
But this correction isn't all about fundamentals. It is about the market adjusting to a company evolving beyond traditional valuation models.
While most investors are trying to value Tesla like a car company, it’s spending this entire phase retooling itself into an AI and autonomy-first enterprise. That transition doesn't show up in EPS yet (but it will).
The Bigger Picture is Being Missed
The robotaxi rollout in Austin is live. Expansion into California, Phoenix, and Florida is on the roadmap.
Tesla is building a vertically integrated, owner-driven ride-hailing model that could eventually bypass both Uber and legacy OEMs entirely.
Optimus is no longer a lab prototype—it’s moving toward scalable production by 2026.
If Tesla even partially succeeds in general-purpose robotics, it will unlock a Technology Acceptance Model (TAM) that dwarfs the current EV narrative .
Daily Technical Outlook
We’re currently in a bullish compression, with higher lows forming against the resistance area of $365. If $280 holds and the price continues to grind within this wedge, it sets up a volatility breakout scenario.
The breakout level to watch is $335. A daily close above that reopens $365. And beyond that, the resistance level is at $426.
My View
Tesla is compressing, both in price and narrative.
The long game is quietly coming into focus, where the risk/reward skews asymmetrically in favor of the upside.
This daily compression won’t last forever, and when it resolves, the move will likely be outsized.
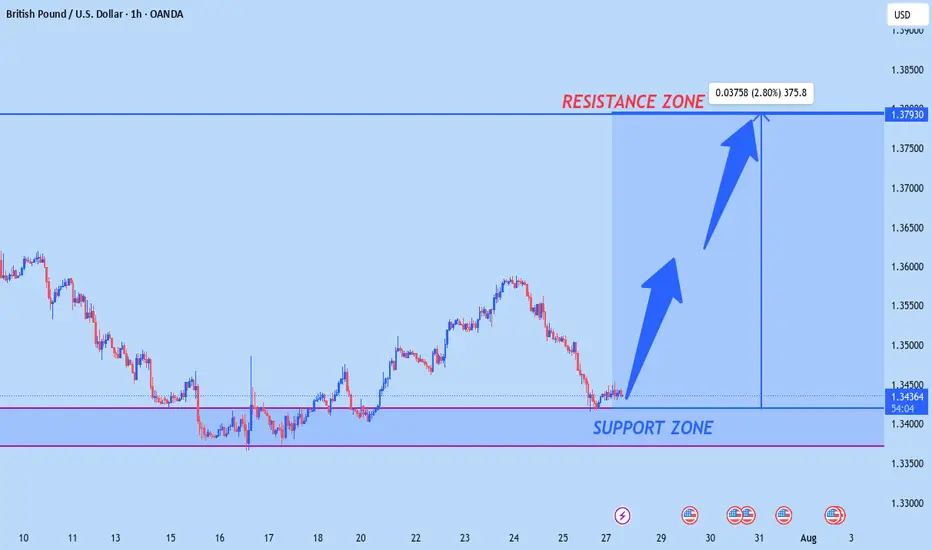
GBPUSD NEW LOOKaccording to H1 analysis GBP market is at support level we have good opportynity
go long from support level
Dont be greedy use money management
TRADE AT YOUR OWN RISK
REGARD ALBERT
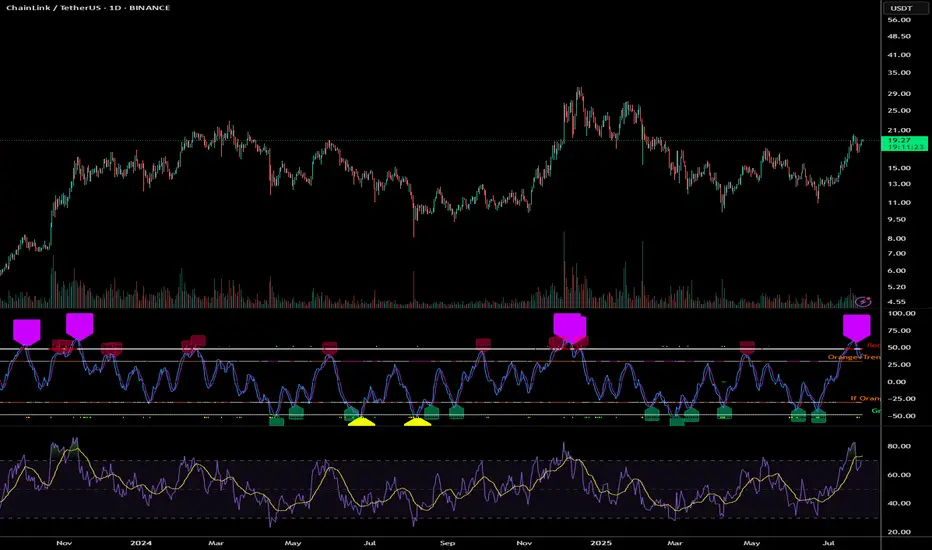
LINK's Technical Signals Point to a 50% Rally by Years-EndLINK is trading at approximately $19.26. The price has shown significant volatility and upward momentum over the past few months, moving from around $10-11 in early 2025 to the current levels near $19, representing an impressive 80-90% increase.
Technical Indicator Analysis
RSI (Relative Strength Index)
The daily RSI is currently at 61.60, which is in bullish territory but not yet overbought
The 4-hour RSI is showing similar strength at 61.60
This indicates robust momentum without reaching extreme levels that would trigger immediate profit-taking
Historical data shows LINK can sustain RSI readings in the 60-70 range during strong uptrends
Price Action Patterns
LINK has formed a series of higher highs and higher lows since May 2025
The price recently consolidated in the $17-19 range before showing signs of continuation
There was a significant price surge from $13-14 levels to above $19 in mid-July, indicating strong buying pressure
The consolidation after rapid gains suggests healthy market behaviour rather than exhaustion
Volume Analysis
Volume has been increasing during upward price movements
Notable volume spikes occurred during the breakout from $15 to $17 and again during the move above $19
This suggests genuine buying interest rather than a low-volume pump
The Volume-Weighted Average Price (VWAP) continues to slope upward, confirming the strength of the trend
Support and Resistance Levels
Strong support has formed around $17.50-18.00
Previous resistance around $19.00 is now being tested as support
The next major resistance appears to be in the $20-21 range based on previous price action
After that, there's relatively little historical resistance until the $25 level
Fibonacci Projections
Using the recent swing low of approximately $11.45 (May 2025) to the recent high of $19.66:
The 161.8% extension projects a target of approximately $24.70
The 200% extension suggests a move toward $28.00
These Fibonacci levels often serve as magnets for price during strong trend movements
LINK Price Projection
Based on the technical indicators analysed:
Short-term (August-September 2025):
LINK appears poised to break through the $20 psychological barrier
Initial target around $22-23 as the next resistance level
Support should hold around $17.50-18.00 on any pullbacks
The clean break above previous resistance at $18.50-19.00 suggests momentum remains strong
Medium-term (October-November 2025):
If the current trend structure remains intact
LINK could target the $24-25 range, aligning with the 161.8% Fibonacci extension
Previous all-time highs near $30 could come into play by year-end
The steady stair-stepping pattern of rallies followed by consolidation suggests this move would be sustainable
Key Factors to Watch:
Volume on breakouts above $20 and $25
RSI readings for signs of exhaustion or continued strength
Development updates and adoption news specific to Chain-link
Maintenance of the higher lows pattern on any pullbacks
Conclusion
The technical picture for LINK appears bullish, with multiple indicators suggesting continued upward momentum. The price has established a strong uptrend with healthy consolidation periods. The recent price action shows accumulation rather than distribution, with higher lows forming during consolidation phases.
The most likely scenario based on current data suggests LINK could reach the $24-25 range in the next 2-3 months, with potential for movement toward $28-30 by the end of 2025, representing a 30-55% increase from current levels. However, investors should monitor key support levels around $17.50-18.00 for any signs of trend reversal.
The clean chart structure, steady volume profile, and measured RSI readings all point to a continuation of the current uptrend, making LINK's technical outlook decidedly positive for the remainder of 2025.
The US and Europe reached an agreement. Gold rebounded.At the current node, the EU and the US reached a tariff cooperation, 15% tariff + 600 billion US dollars for investment in the United States. The additional tariffs are considered a big deal, and the US has become the winner again this time.
Of course, this is a small negative for the current gold market.
From a multi-period analysis, the monthly chart price is still in a reverse K state. For the current situation, we need to pay attention to the gains and losses of the monthly highs and lows. The weekly chart shows that the price has continued to fluctuate at a high level recently. As time goes by, the weekly watershed is temporarily at 3320. After last week's high and fall, there is currently a further downward performance.
The four-hour chart shows that the price has continued to be suppressed after breaking through the four-hour support last Wednesday. The four-hour level resistance is currently around 3355, and the resistance level has moved up compared with the early Asian market. Therefore, we will pay attention to the pressure at this position in the future. If it fails to break through for a long time, it is likely to fall directly under pressure; pay attention to the support range of 3320-3310 below.

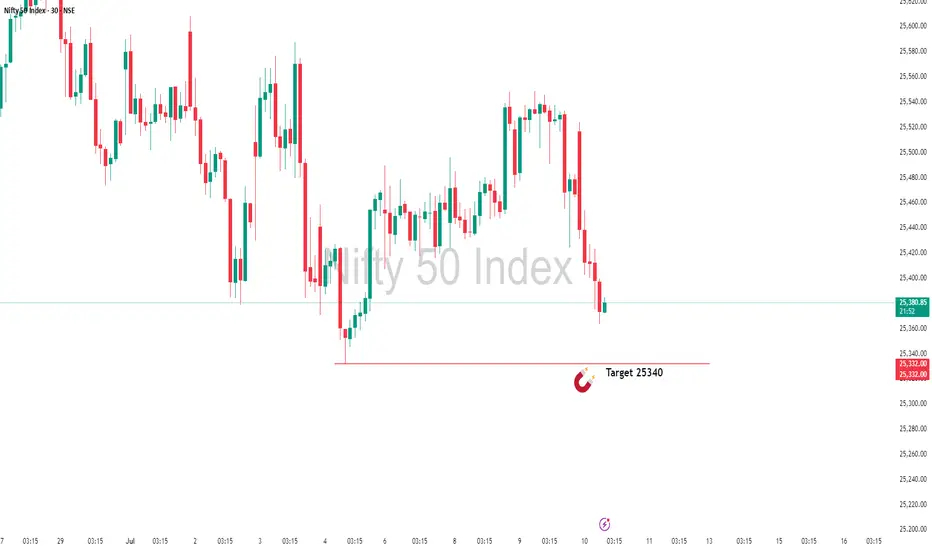
Almost There: Nifty Closing in on My Target Zone 25340In this update, I’m revisiting the setup I shared earlier that points towards NIFTY’s next potential target at 25,340. The analysis covers the key levels, price action structure, and the factors supporting this move. This setup is based on clear technical confirmations and disciplined risk management — not just speculation.
Please remember to follow your own plan and manage your trades responsibly. This is for educational purposes and not financial advice. Let’s see how the price action unfolds!
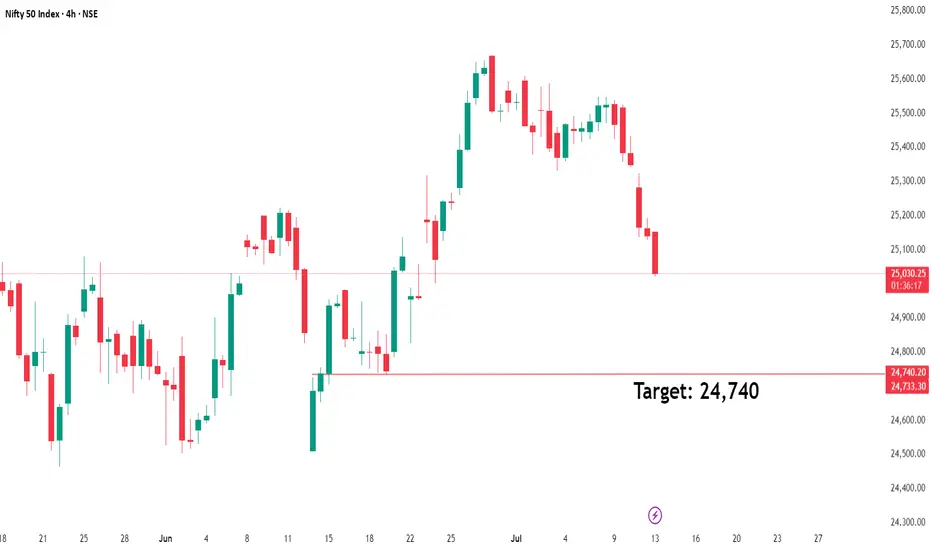
NIFTY 24740: Smart Money Signals Bearish Move IncomingThe directional bias is clear – bearish – and I'm currently waiting for a precise setup to present itself. Based on the Smart Money Concept, we could be looking at a potential short opportunity around the 24740 zone.
📍 Once the setup is confirmed, I’ll be sharing the exact entry and stop-loss levels with you.
Stay tuned – patience here is key. Let the market come to us.
My UNH Thesis: Betting on a Healthcare Giant's Come BackThe healthcare sector has been in decline, which creates interesting opportunities. I recently talked about a few pharma plays - Eli Lilly, Novo Nordisk, and Pfizer.
Here's why I'm investing in NYSE:UNH :
UnitedHealth Group (UNH) has tanked ~50% in the past year, but the July 29 (VERY SOON) earnings could flip the script. As a historically dominant player, UNH is now undervalued amid sector weakness, offering massive upside if regulatory fears ease.
Here's my full bull case. 👇 FUNDAMENTAL ANALYSIS
Why the Sell-Off? A Perfect Storm of Bad News
UNH crushed the market for 15 straight years (2009-2023) with positive returns, predictable EPS growth, and 134% gains over the last decade.
But 2024 brought chaos:
Feb: Massive cyber attack caused a one-time EPS hit (non-recurring).
Ongoing: DOJ antitrust probe, criminal fraud investigation, rising Medicare costs, and Optum losses.
April: Disastrous Q1 earnings miss + lowered guidance.
Leadership drama: CEO death.
This erased gains (down 7% over 5 years), amplified by healthcare sector outflows—the biggest since 2020. But is this overblown? Signs point to yes. The markets almost always overreact to bad news.
Bullish Signals: Insiders Betting Big
The tide is turning:
Insider Buying Boom: $32M+ in 2024 (vs. $6.6M in 2019), including new CEO/CFO—highest in 15 years.
Congress Buying: Q2 2024 saw net purchases for the first time in 5 years (vs. historical selling).
DOJ Shift: Probe refocusing on pharmacy benefits (PBM) unit, dropping acquisition/monopoly scrutiny—implies no major findings. Great news!
Sector Tailwinds: Healthcare is one of 3 S&P sectors below historical valuations. Super investors (usually tech-obsessed) are piling in, despite the sector's -10% YTD vs. S&P's +13%.
Plus, UNH's dividend yield is at a record ~3% (vs. 1.5% avg), with 16%+ historical growth and 100%+ free cash flow conversion. Rare combo of yield + growth!
Valuation: Screaming Buy?
UNH trades at PE ~11.9 (vs. 10-year avg 23)—a steal.
Analysts project 16.7% EPS CAGR through 2029.
Conservative Scenario: 16.5% EPS growth + PE to 16.5 = $780/share by 2030 (173% total return, 18% CAGR ex-dividends).
Optimistic: PE back to 23 = $1,084/share (280% return).
Models confirm:
DCF (8% FCF growth): ~$484/share (70% upside).
DDM (7% div growth): ~$607/share (112% upside).
Blended Fair Value: ~$545/share (75-90% upside from ~$300). Buy below $436 for 20% safety margin.
Still, there is fear of DOJ uncertainty—investors hate unpredictability and that's why the stock is so low.
Key Catalyst: July 29 Earnings
This could be UNH's "most important report ever." Watch for:
Regulatory/legal updates (DOJ progress).
Full-year guidance revisions.
Metrics like medical loss ratio and PBM performance.
Positive news = potential rocket 🚀. Expectations are low (20 bearish EPS revisions vs. 0 bullish), so a beat could spark volatility... upward.
Risks: Not Without Bumps
Regulatory escalation (e.g., PBM issues) could tank it further.
Short-term headwinds: Medicare costs, sector selling.
Mitigants: DOJ de-risking, strong FCF buffer, insider confidence. Enter cautiously—size positions small.
TECHNICAL ANALYSIS
I also did a little technical analysis:
UNH price is at a resistance level
My EVaR indicator tells me we are in a low-risk area
RSI says the stock is oversold
I added the different price targets for better visualization
THE PLAN
My plan:
Later today, I will allocate 1% to 1.5% of my portfolio to the stock. If it drops, I will continue to DCA. The stock is already really beaten down, and I think a company this large cannot drop much more.
Quick note: I'm just sharing my journey - not financial advice! 😊

Important week for EURUSDOn Friday, EURUSD reached a support level and bounced off it.
This week, all eyes are on the Fed's interest rate decision on Wednesday and the U.S. jobs data on Friday.
The trend remains bullish for now, and the upcoming news will likely determine the next move.
Today and tomorrow, the market may stay in a range as traders wait for the key events.
Don't rush into new trades and avoid using large position sizes!

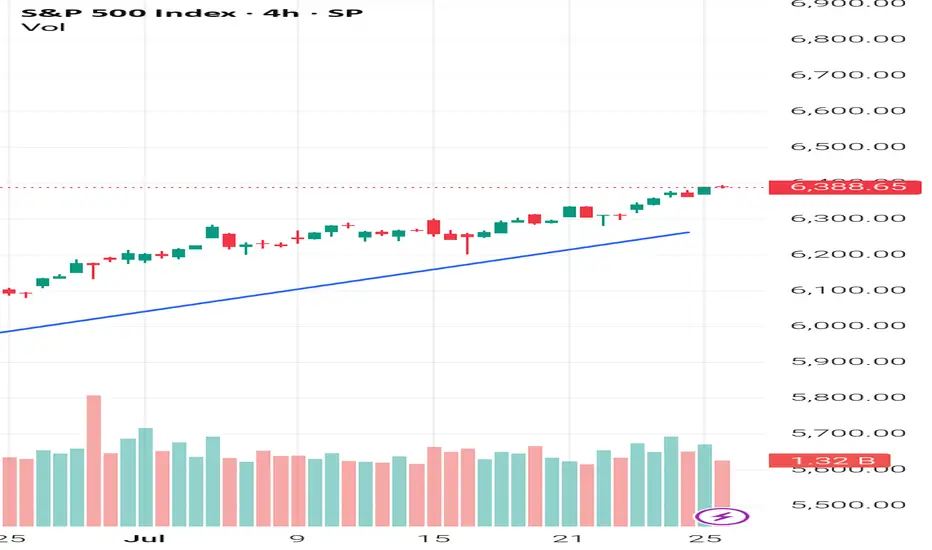
Weekly Review: Forex fundamental analysis The week starting Monday 21 July was another week of positive sentiment, the S&P continues to hit all time highs and the VIX remains anchored below 17.
The upbeat mood was propelled by an announcement of a tariff deal between the US and Japan. The market now thinks it's likely deals with EUROPE and CHINA will soon follow. All the while, earnings season continues to quietly slip under the radar (it's worth noting the upcoming week does have a plethora of huge companies reporting).
An election in JAPAN caused uncertainty, giving the JPY a bout of strength at the beginning of the week. I then found it difficult to decide if the US / JAPAN trade deal would be positive or negative for the JPY, ultimately the overall positive risk tone prevailed and the JPY ended the week softly.
It was also a week of two halves for the USD, the interest rate battle between the president and chair Powell continues to cause uncertainty. The FOMC meeting and the upcoming slue of reg flag US data will be very interesting. And could determine the underlying bias for the USD for the rest of the summer.
The EUR and GBP were prominent throughout the week, a 'hawkish hold' from the ECB, combined with positive PMI data and hopes of a trade deal, all contributed to positive sentiment for the EUR.
On the opposite end of the scale, the GBP ended the week bruised, weakened by another bout of 'soft data'. Which opened the door to potential 'relative fundamental' GBP short trades.
Finally, 'fairly hawkish' comments from the RBA'S BULLOCK keeps the AUD high on my to long list.
On a personal note, it was a week of two trades. I perhaps was a little bold in thinking the JPY post election strength was overdone, entering an AUD JPY long which stopped out. You might often think it's frustrating when a trade stops out, but then eventually hits the original profit target. Personally, I take the positive view that at least my original bias was proved correct.
The week was saved on Friday with a EUR GBP long, post GBP retail sales data and trying to take advantage of the positive EUR sentiment.
*As I write, it appears a US /EUR tariff deal is very close, which backs up thoughts of 'risk on' trades to begin the new week.
Trade 1: AUD JPY -1
Trade 2: EUR GBP +1.5
Total = +0.5%
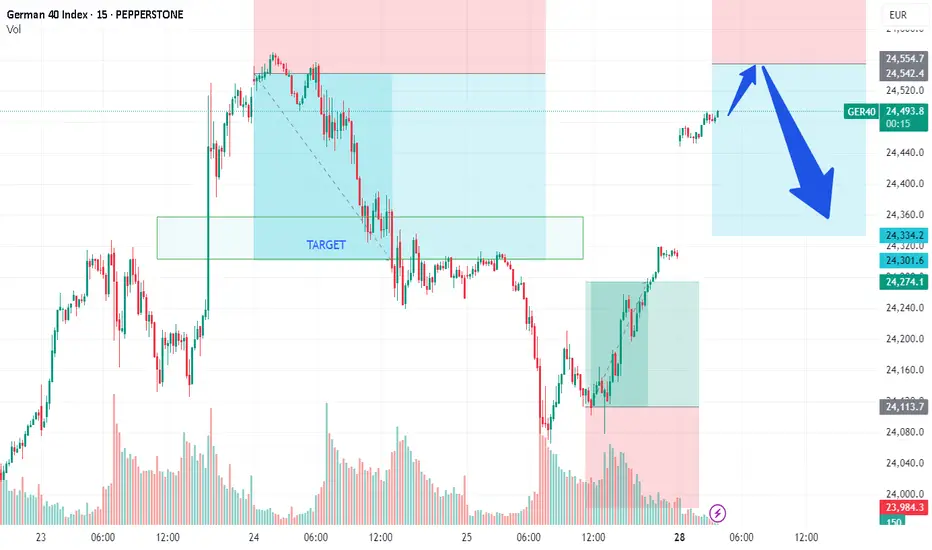
DAX/GER - PREPARE TO SHORT on DAX market opening Team,
We all know that the European Union and the United States agreed on Sunday to a broad trade deal that sets a 15 per cent tariff on most E.U. goods, including cars and pharmaceuticals.
The 27-nation bloc also agreed to increase its investment in the United States by more than $600 billion above current levels.
If the DEAL does not go through, it would be nasty to the market—especially to the Europeans, who are likely to get hurt by the export cost to the United States, especially the Car. The EUROPEAN is currently facing many challenges from Chinese car manufacturing.
We have been trading very well with the DAX in the past. We expect that when the market opens, we should short-range at 24530-60 - GET READY.
Stop loss at 24620-50
Please NOTE: once the price pulls back toward 24475-50, bring our STOP LOSS TO BE (Break even)
Our 1st target at 24425-24400
2nd Target at 24350-24300
Last Friday, in OUR LIVE TRADING, we mentioned that LONG DAX at 24100
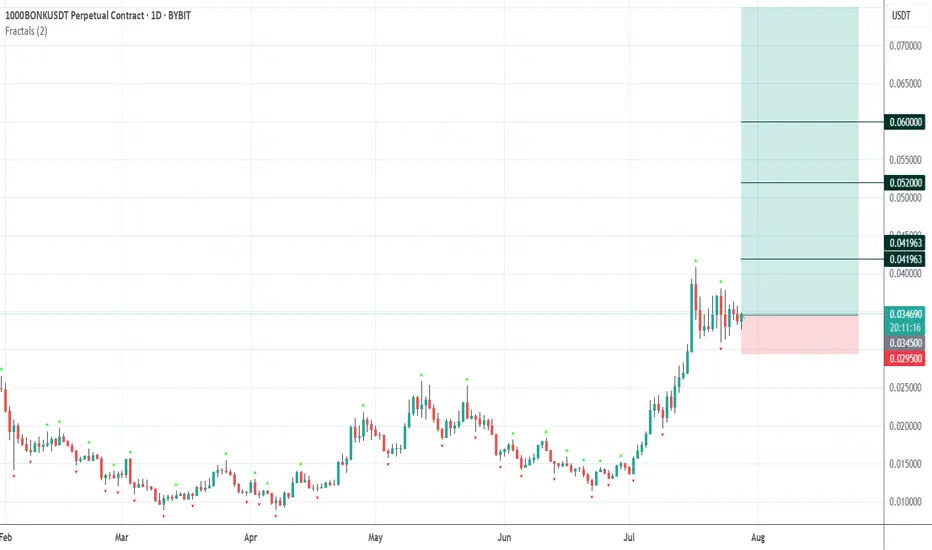
BONK - Sentiment and Chart shows bullish signal!Technical Analysis
First, let's lock in our view of the chart. The daily chart for 1000BONKUSDT shows a very strong, sustained uptrend, particularly throughout July. After hitting a recent peak just above $0.040, the price has undergone a healthy retracement.
It has now pulled back to the $0.034 level. This is a critical support zone. As we identified, this level was the peak of the rally in late May, and the price is now retesting it. The small green fractal arrows on the chart confirm these previous swing highs. The price is currently consolidating right on this old resistance level, which we anticipate will now act as new support. This is a textbook setup for our strategy, making it a prime candidate for an immediate long entry.
Sentiment and Fundamental Analysis
Now, let's analyze the news to see if the market sentiment supports our bullish technical view.
"LetsBONK Allocates Revenue Share for Token Buybacks in BONK Ecosystem" (11 hours ago): This is fundamentally very bullish. Token buybacks are a powerful mechanism. They use project revenue to purchase tokens from the open market, which reduces the circulating supply and can create sustained buying pressure. It also signals the team's confidence in the token's value.
"Meme News: Supercycle Loading? Pengu and Bonk Lead in Sea of Green" (5 days ago): This headline frames BONK as a leader in the meme coin sector, which is currently experiencing strong positive momentum (a "Supercycle"). This is bullish as it attracts trend-following traders and highlights BONK's relative strength.
"Bonk News: Why is BONK's price up today?" (6 days ago): This article, published during the recent rally, reinforces the positive price action and likely explains the bullish momentum we've seen. It contributes to the overall bullish sentiment.
The sentiment is clearly bullish. The most recent and significant piece of news is about token buybacks, which is a strong fundamental driver for price appreciation. This aligns perfectly with the technical setup of the price holding at a key support level.
The Trade Plan: 1000BONKUSDT (Long)
The plan is set. We're entering a long position with a market entry now, around $0.0345.
Entering a long position as the price retraces to a major support level ($0.034) where old resistance is flipping into new support. The entry is supported by strong bullish news, particularly the announcement of token buybacks.
Stop Loss (SL): $0.0295
This level is safely below the entire support structure and below the recent swing low of this pullback. A break below $0.030 would invalidate our trade thesis. Placing the SL at $0.0295 protects us from a failed support scenario.
Take Profit 1 (TP1): $0.0415 (Moonbag Target)
This target is just above the recent all-time high. It's the most logical first target where the price will prove the uptrend is continuing.
At TP1, we take initial profits and move the trailing stop to our entry price (~$0.0345) to make the rest of the trade risk-free.
Take Profit 2 (TP2): $0.0520
This represents a measured move projection and aligns with the 1.272 Fibonacci extension from the previous range. It's a common target after a new all-time high is made.
When TP2 is hit, move the trailing stop up to the TP1 level ($0.0415) to lock in profits.
Take Profit 3 (TP3): $0.0600
This is a major psychological round number and aligns with the 1.618 Fibonacci extension, a key target in price discovery mode.
When TP3 is hit, move the trailing stop up to the TP2 level ($0.0520).
Take Profit 4 (TP4): $0.0750 (Final Target)
This is our optimistic "blue sky" target. In a strong meme coin rally fueled by buybacks, prices can often run much further than expected. $0.075 represents a significant milestone.
Close all remaining positions.
Conclusion:
The 1000BONKUSDT long trade is a high-quality setup where the technicals and fundamentals are in strong alignment. The risk is clearly defined, and the profit targets offer excellent potential. The plan is ready to be executed.
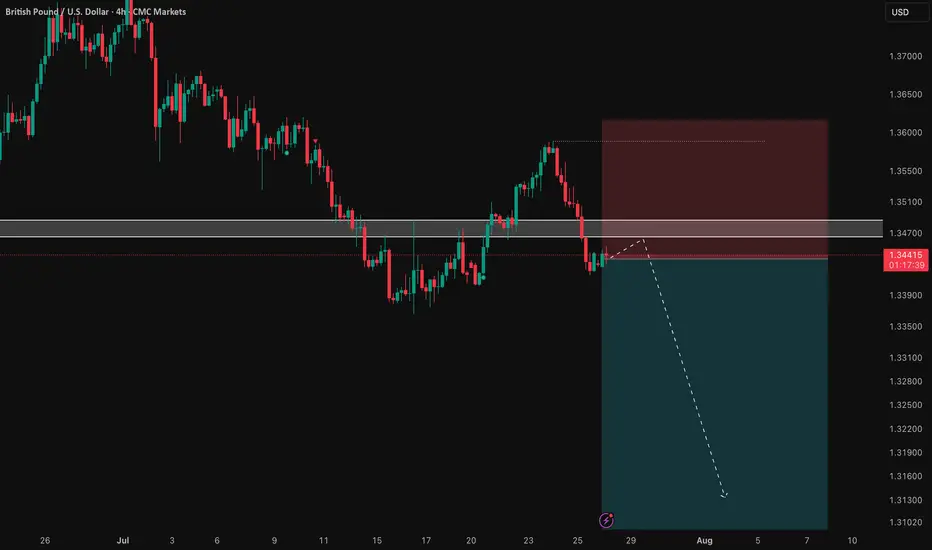
GBP/USD: Following the Bearish Trend to a Key LevelSharing my perspective on a potential short setup in GBP/USD.
This view is based on a combination of weakening UK fundamentals and a clear bearish technical structure.
📰 The Fundamental View
The main driver here is the growing difference in monetary policy. The Bank of England is signaling a more dovish stance due to recent soft economic data out of the UK. In contrast, the US economy is showing more resilience, which may keep the Federal Reserve on a less aggressive easing path. This fundamental divergence puts downward pressure on the Pound versus the Dollar.
📊 The Technical Picture
The chart supports this bearish bias. We can see a clear downtrend in place, defined by a series of lower highs and lower lows. Price is currently trading below its key moving averages, which often act as dynamic resistance. The critical level to watch is the 1.34377 price zone, which was a previous area of support and could now be tested as resistance.
🎯 The Strategy
The plan is to watch for bearish price action as we approach the 1.34377 key level. A rejection from this zone would provide a good opportunity to enter a short position, aiming to ride the next leg of the established downtrend.
As always, this is my own perspective. Manage your risk carefully and trade safe.
Short on NEAR, but with caution!The technical setup is very clear and strong. The resistance level is well-defined. The fundamental news, while positive, is not reporting the kind of extreme, immediate buying pressure we saw with ENA. The news about developer activity is a long-term positive, but it doesn't invalidate a potential short-term pullback from a major resistance level.
Therefore, the technical setup is compelling enough to take the trade, but we must be strict with our risk management because the underlying fundamentals are healthy.
let's break it down!
Technical Analysis
Let's start with the chart. The daily chart for NEARUSDT shows a clear recovery rally from the lows of early July. The price has now pushed up to the $3.00 - $3.10 resistance zone. This level is significant because it served as a reliable support floor during April and May 2025 before the price broke down in June. The chart shows the price is currently stalling right at this level, with today's candle showing a slight rejection. This is a classic "old support turning into new resistance" setup, making it a technically sound area for a potential short entry.
Sentiment and Fundamental Analysis
Now, let's analyze the provided news to see if the market sentiment aligns with our bearish technical view. (news taken from CoinMarketCap)
"GitHub Kings: LINK, ATOM, STORJ, and NEAR Dominate Crypto Development in 5-Month Activity..." (2 days ago): This is fundamentally bullish. High developer activity is a key indicator of a healthy and growing ecosystem. It suggests long-term value and innovation, which is a positive sign.
"NEAR Protocol Rebounds 9% as Investors Capitalize on Market Dislocation" (2 days ago): This headline is fairly neutral. It simply describes recent price action (a rebound) and attributes it to investors buying a dip. It doesn't provide a strong directional bias for the future.
"Luno launches first-ever crypto staking in Nigeria: What it means and how you can benefit" (3 days ago): While this article mentions crypto staking in general, it does not appear to be directly related to NEAR Protocol itself. Therefore, its impact on NEAR's sentiment is negligible. We can consider this neutral.
"NEAR Protocol Integrates EdDSA Signatures to Enhance Cross-Chain Compatibility" (2 months ago): While positive fundamental news, this is old information. Its impact has likely already been priced into the market and it has little bearing on the immediate price action. We can consider this neutral for our immediate trade decision.
The sentiment for NEAR is mixed, but leaning slightly bullish on fundamentals. The strongest and most recent piece of relevant news is about high developer activity, which is a positive sign. However, unlike the ENA news which showed massive, active buying pressure and whale involvement right now, the news for NEAR is more about long-term health rather than immediate, explosive buying pressure. There is no overwhelming bullish momentum that screams "don't short this."
The Trade Plan: NEARUSDT (Short)
The plan is set. We're entering a short position with a market entry now, around $2.96.
Entering a short position as the price tests a key horizontal resistance zone ($3.00-$3.10) that was previously strong support. The daily candle shows initial signs of rejection.
Stop Loss (SL): $3.35
A decisive close above the resistance zone would invalidate our trade idea. Placing the SL at $3.35 puts it clearly above the entire resistance area and above the minor swing high from late May, giving the trade room to breathe without taking on excessive risk.
Take Profit 1 (TP1): $2.55 (Moonbag Target)
This is the first significant support level on the way down, corresponding to the consolidation area in mid-July. It's a logical first target for sellers.
At TP1, take initial profits and move the trailing stop to our entry price (~$2.96) to make the rest of the trade risk-free.
Take Profit 2 (TP2): $2.20
This level corresponds to the next support area from the price action in early July. It represents a significant portion of the recent rally being retraced.
When TP2 is hit, move the trailing stop down to the TP1 level ($2.55) to lock in more profit.
Take Profit 3 (TP3): $1.85
This targets the major swing low from early July. A move to this level would mean a full retracement of the recent rally.
When TP3 is hit, move the trailing stop down to the TP2 level ($2.20).
Take Profit 4 (TP4): $1.55 (Final Target)
This is our final target, aiming for the lows of the year from March. In a bearish scenario where the resistance holds firmly, a retest of major lows is possible.
Close all remaining positions.
Conclusion:
The NEARUSDT short trade presents a good technical opportunity. While the fundamentals are not bearish, they lack the overwhelming bullish force seen in other coins, making this trade a calculated risk worth taking. The plan is now in place.

GBPUSD short Fundamental and price action
Possible 1000 pip short
first red candle rule and price action , 4h moving average signal
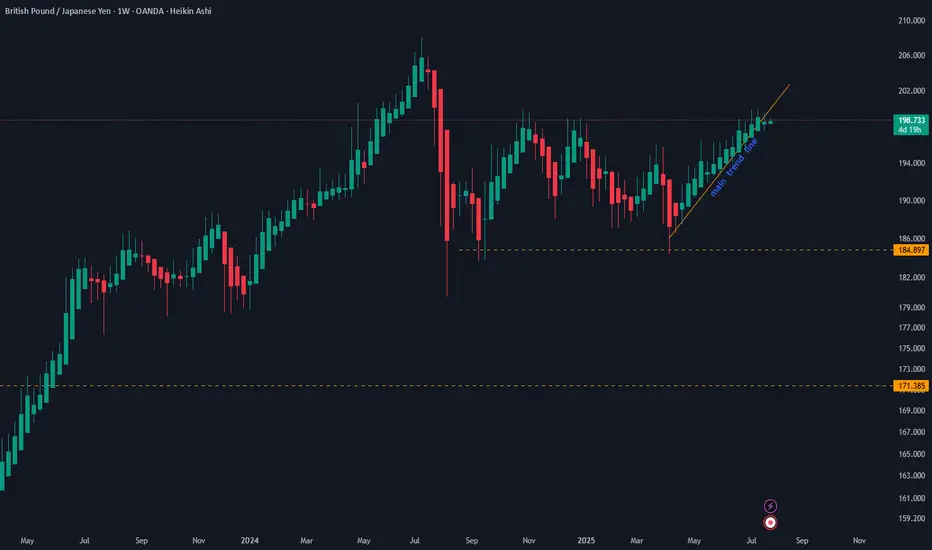
GBPJPY short Fundamental and Trend line structure analysis
possible 600 pip short position
mid term trend line structure break out

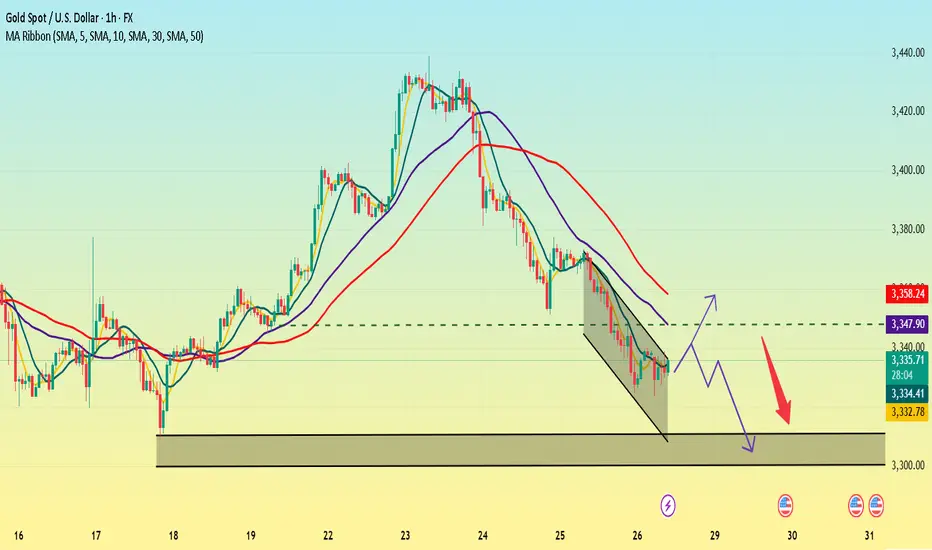
Gold remains unchanged. Still weak.Last Friday, gold rebounded around 3373, but the bullish momentum was insufficient, and then it bottomed out and fell sharply. The price fell below the short-term rising trend line support. At present, the MA5-10 daily moving average is in a high dead cross short arrangement. On this basis, Quaid believes that gold can still be bearish now. At present, the Asian market continues to fluctuate downward in the early trading. Today, we will focus on the support of 3310-3300.
The short-term price is currently maintained at around 3335, which can be regarded as the watershed between long and short today. If the European session stabilizes above the MA50 moving average, the trend will change to a certain extent. Now we still look at the bottom near 3300.
Operation strategy:
Short near 3340, stop loss 3350, profit range 3310-3300.
Smart Money Concepts (SMC)Positive aspects of the analysis:
1. Clear structural change (BOS and CHoCH):
A breakout of the previous bearish structure (Break of Structure) and a change in character (CHoCH) are evident, indicating an intention to change the trend.
2. Fake Out Identified:
The "fake out" toward the resistance zone is typical of liquidity traps designed to catch buyers before the actual decline. This provides institutional confluence for the short.
3. 15M block order + resistance zone:
Entry from a 15-minute OB, within a broader resistance zone. This strengthens the entry points, as there is a high probability of a bearish reaction there.
4. Mitigation of the previous 1H FVG:
The market has already mitigated the 1H Fair Value Gap, which generally indicates that the price no longer needs to rise further to balance this inefficiency.
5. Target in a logical zone (3,317):
Take profit placed just before a lower support zone. This is prudent, as many traders seek to close partial positions or exits before major support.
