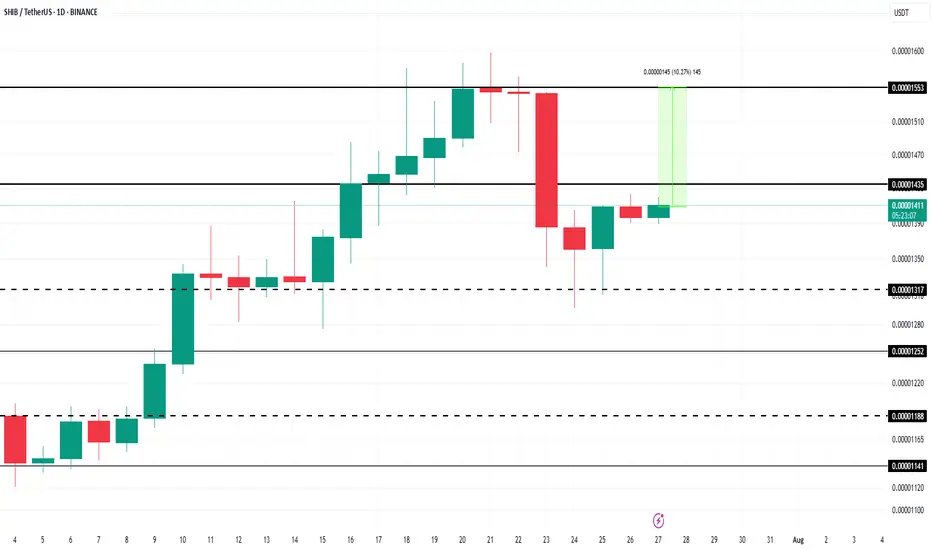
Here’s Why Shiba Inu Price’s 10% Rise Entails $50 Million LossesAt the time of writing, BINANCE:SHIBUSDT price is $0.00001407, sitting just below the resistance level of $0.00001435. The altcoin has been facing mixed signals, with both bearish and bullish factors playing a role in its price action. The key resistance level of $0.00001435 needs to be broken for a potential recovery.
The liquidation map shows a fascinating development: if BINANCE:SHIBUSDT recovers the 10% losses it has sustained by reaching $0.00001553, it could trigger over $52 million worth of short liquidations . Short sellers have been betting on a decline, but if SHIB rebounds, these traders will face considerable losses.
If BINANCE:SHIBUSDT continues to hover within the consolidation range of $0.00001435 and $0.00001317 , traders will remain safe from liquidation risks. This sideways movement will keep the altcoin within a neutral zone, avoiding drastic price changes in the immediate term.
However, if BINANCE:SHIBUSDT price manages to break the resistance at $0.00001435 and flips it into support, SHIB could potentially climb back to $0.00001553. This would mark a 10% recovery , invalidating the current bearish sentiment and shifting the outlook to a more optimistic tone.
Fundamental Analysis
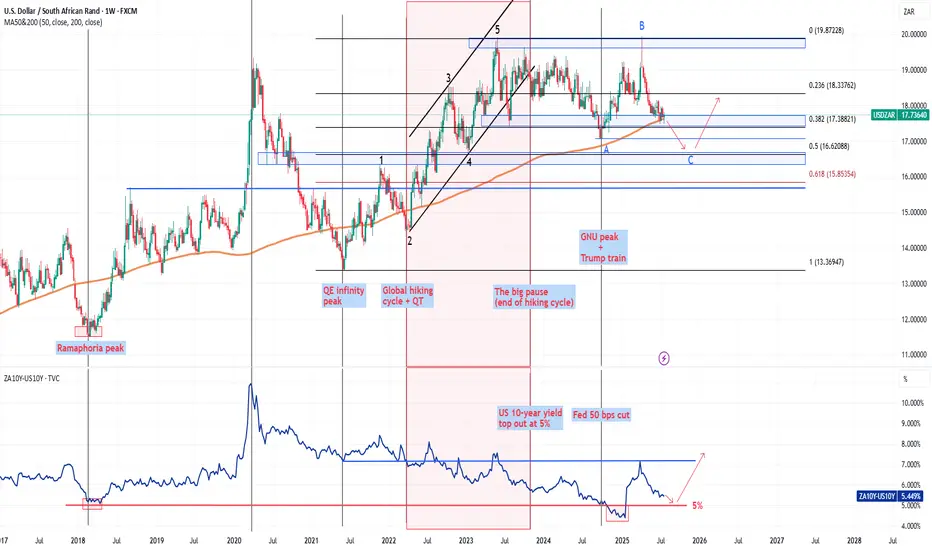
The dance between the USDZAR and (ZA10Y - US10Y)The chart shows the relationship between the USDZAR and the yield differential between the SA 10-year and the US 10-year (ZA10Y – US10Y).
2025 has been a wild ride for the rand and it has managed to put up a remarkable recovery in the 2Q2025 but where to now for the pair? The pair has not traded below the 200-week MA currently at 17.62, since the March 2022 just before the global rate hiking cycle. The only previous times the pair traded below this moving average was briefly in 2021 before the June/July riots in SA and during the “Ramaphoria” period in 2018.
The 200-week MA also coincides with the 38.2% Fibo retracement from the low in 2021. A brief break below these two support levels will allow the pair to fall onto the 50% Fibo retracement level at 16.62. The yield differential is however suggesting that the rand may not have much room to pull the pair too far below the 200-week MA. The brief break below the 5.00% during December 2024 and January 2025 was a bit of an anomaly given the volatility in the US bond market and I still believe 5.00% is a hard support for the yield differential. A bottom out of the yield differential could see it rise higher towards 7.50% which will be rand negative should the positive correlation hold.
To summarise, the yield differential is suggesting that the rand’s 2Q2025 recovery may be on its last legs but a break below the 200-week MA will allow the rand to pull the pair towards 16.50. I don't see the rand maintaining levels below 16.50 and this level seems like a long-term floor for the pair before another 5-wave impulse to the topside.
Historical trend analysis:
The SA rand is one of the most attractive emerging market currencies due to the carry trade appeal of the currency coupled with SA’s deep and liquid bond market. During periods when there is significant buying pressure on SA bonds, the SA yields will decrease meaning that the yield differential (ZA10Y-US10Y) decreases while in periods when SA bonds are selling off, yields on SA bonds will increase which increases the yield differential, citrus paribus. The USDZAR pair is thus positively correlated with this yield differential.
The chart goes back to 2018 when the USDZAR hit a low of 11.50 following the period dubbed the “Ramaphoria” period. Investor sentiment swinged aggressively positive in this period and the flow of international funds into the SA bond market saw the yield differential drop to a low around 5.00%. The yeld differential has never dropped below this level until early 2025 as indicated on the chart.
The yield differential and the USDZAR pair moved in tandem all the way through to the 1Q2022, maintaining its strong positive correlation. The next period marked the start of the global hiking cycle which saw the US 10-year yield rise from a low of 1.65% in March 2022 to a high of 5.00% in October 2023. This aggressive rise in US 10-year yields marked a period of extensive risk off sentiment and even caused a US banking crises in March 2023. The Fed stepped in and briefly paused their QT to add liquidity to system and provided the US banking system with the bank term funding program to patch up the cracks. The rand sold off due to risk off investor sentiment while the US 10-year yield rose due to the start of the rate hiking cycle which reduced the yield differential. The USDZAR climbed to a high of 19.90 in May 2023 while the yield differential dropped to a low of 7.50%. The yield differential continued to fall until the US 10-year yield topped out at 5.00% in October 2023, after which the positive correlation between the USDZAR and the yield differential was restored.
The next period marked positive sentiment towards SA following the election results and the formation on the government on national unity (GNU). Coupled with the end to the rate hiking cycle, the rand had the wind and risk on investor sentiment in its sails which allowed the rand to pull the pair to a low of 17.03. The optimism of the GNU and the realisation on another Trump presidency however saw the pair bottom out in September 2024. During the last quarter of 2024 the rand experienced sustained selling pressure while the yield differential continued to fall. The break in correlation was largely due to the US10-year yield climbing from 3.60% in September 2024 to a high of 4.80% in January 2025.
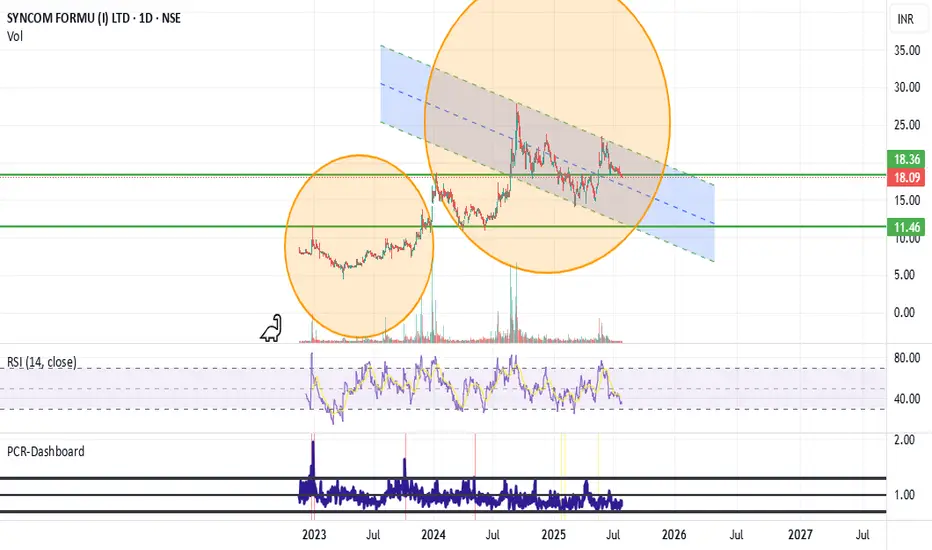
Long on Syncom FormulationThe chart normally gives a cup with handle and then a breakout and then a retest and then moves up high.
This is the second time it is giving a similar pattern of breakout and then retest on weekly candles. Had a look at the fundamentals and it looks good too. Will track this stock. I think this will go up rapidly when pharma comes back into favor.
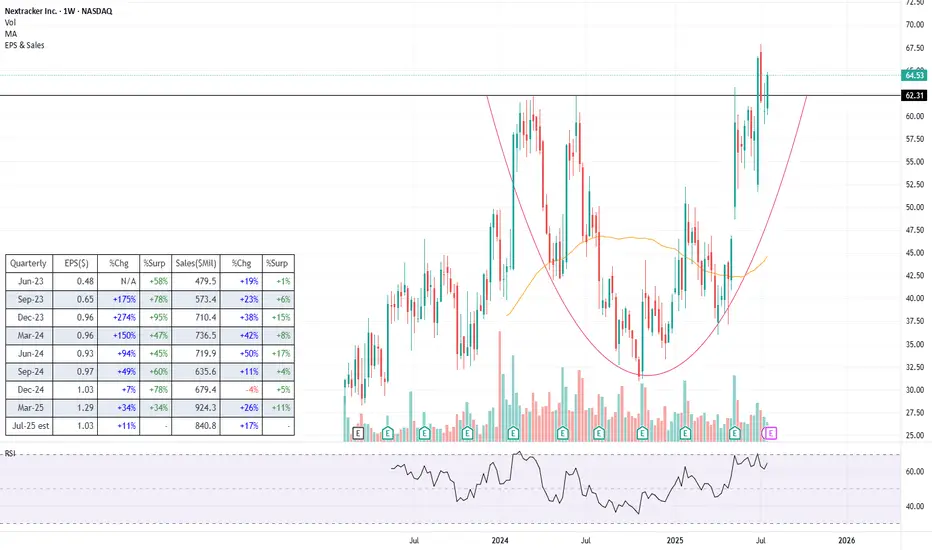
NXT (Long) - Clean energy player with even cleaner financialsLet's preamble with what the company actually does (as I imagine a lot of traders trade without even bothering... understandably). In short, Nextracker operates in the solar energy space where it is a leader in providing energy output optimization solutions, i.e. mechanical systems that rotate solar panels to follow the sun, along with software (TrueCapture) that uses sensors and machine learning to fine-tune positioning in real time.
Fundamentals
NASDAQ:NXT has been growing very strongly in recent years (see the table) despite the numerous hiccups this space has seen since 2022. There is also a backlog of $4.5bn , giving us clear visibility into the next year. Profitability is strong with earnings growth even outpacing revenue growth, showing strong operating leverage .
This all comes on the back of a relatively cheap valuation , with P/E of just below 18, which is significantly lower than some of its competitors like NYSE:NVT at 52, and NYSE:RRX at 43. No clear reason for why the markets are discounting the stock.
The balance sheet is rock solid , with no debt and $766m in cash. Moreover, free cash flow is plentiful with the firm most recently generating $622m in FCF.
Overall, the company is growing, has strong financials and is cheaply valued compared to its competitors - the kind of smoothie I usually look for. One obvious risk is policy , given that the current administration doesn't really see eye to eye with renewables and two thirds of NXT's revenue still comes from the US.
Technicals
Just breaking into an all-time high is a nice-to-have advantage when entering a new trade. The stock is breaking out from a decent, almost year-and-half long base , though I would prefer the base to be a tad more prolongated.
The stock broke the ATH on higher volume, pulled back to around the breakout point and is currently establishing the next leg higher
The price is some distance away from its moving averages, so there is a chance that there still might be some more consolidation around this level before we proceed higher
Trade
Main caveat is that the stock is about to release its earnings on Tuesday , so naturally it is a slight gamble to buy ahead of it. I decided to jump in beforehand just because I have strong conviction (and I love to punch the wall when I always get it wrong), but I would advise others to first wait on the results as a potential catalyst.
For gamblers like myself, the ATH breakout point likely serves as the best possible stoploss (black line).
One more reason why these earnings in particular could be even more of a gamble is that the BBB bill was passed since the last earnings, so if the executives decide to sprinkle the release with some not-so-positive comments regarding that, it could spook investors.
Follow me for more analysis & Feel free to ask any questions you have, I am happy to help
If you like my content, please leave a like, comment or a donation , it motivates me to keep producing ideas, thank you :)
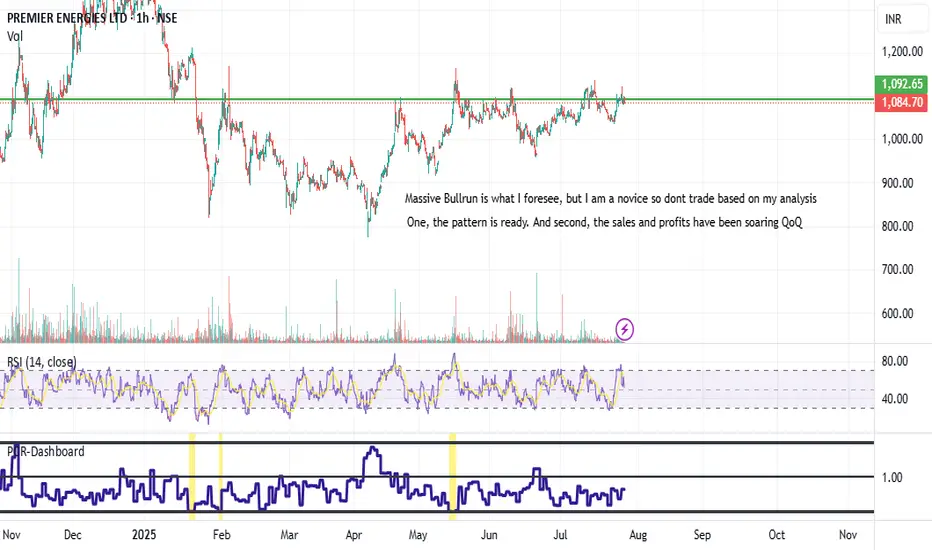
Premier Energies - Long on itMassive bull run is coming is what I anticipate but I am a novice so dont trade based on my analysis.
Chart has been stabilising over a period of time in this hourly chart. Target can be big as per me. I am NOT holding the stock. DYOR.
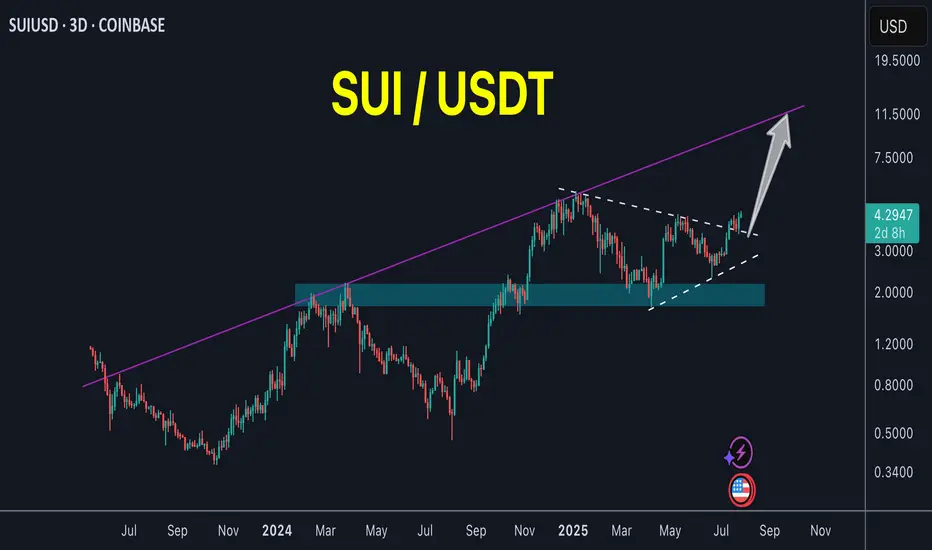
SUI new trend started!SUI / USDT
Price broke out after long accumulation range with good volume
Looks like a new bullish trend has started
TATA MOTORS - Bullish and Long on TATA MOTORSThe stock gave a solid breakout and has already retested the neckline and is bouncing up from there.
Tata motors launched Harrier EV which is the lowest priced SUV EV and backed by harriers style and road presence, it has taken up huge bookings. I was checking that the number of cars available for a dealer in Hyderabad is 4 for next month, when the number of orders pending are 84. I think this will be a massive move once the full blown production of harrier ev is on and sales numbers start coming in from next quarter onwards.
This will be a 2-3 year story at least, so I will patiently hold till 3X from 600 level which is 1800. Disclaimer: I have not taken a position yet. May do so in next few days.

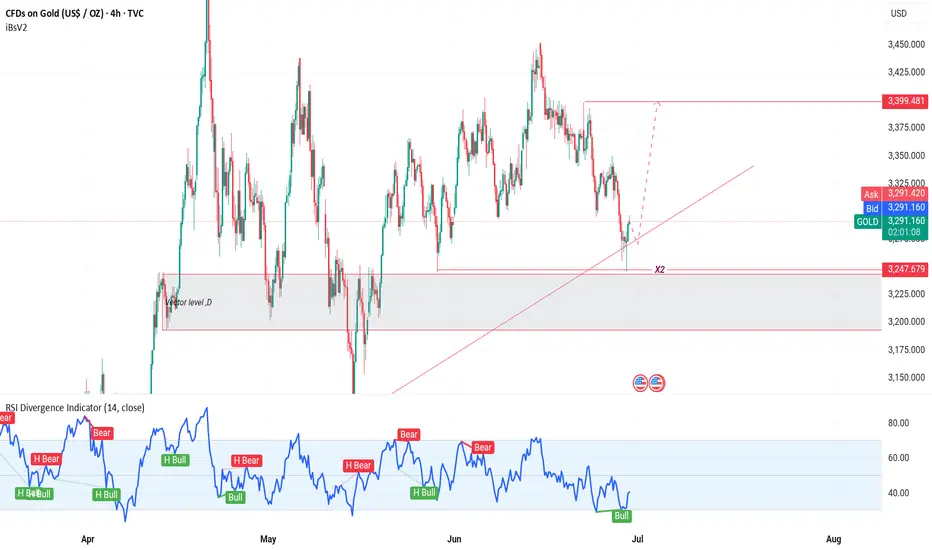
Gold is weak. It may break through next week.This week, gold rose and fell, rising for two consecutive days on Monday and Tuesday, and falling for three consecutive days from Wednesday to Friday. The weekly line finally closed with a small real body negative line with a long upper shadow.
Gold's trend this week was due to the strengthening of the US dollar and the progress in US-EU trade negotiations, which hit the safe-haven demand, leading to a decline in gold prices.
Next week, focus on multiple time points that may trigger market trends, including the Federal Reserve's decision, non-agricultural data, the August 1 tariff deadline, and the economic and trade talks between Chinese representatives in Sweden and the United States. These events may set the tone for the market in the second half of the year and need to be paid attention to.
At the beginning of this week, we focused on the triangular convergence pattern formed by the high and low points since 3500 points. On Tuesday, gold broke through the pattern upward, but failed to stand firm on Wednesday. Instead, it fell to form a false breakthrough, and on Friday it fell to the lower edge of the triangular convergence range. However, from the perspective of the international futures market, the overall situation is still in the triangular convergence pattern and has not achieved an effective upward breakthrough. Based on this, we need to continue to keep a close eye on the changes in the triangle convergence pattern next week. The direction of its next breakthrough will have an important impact on the short-term trend.
Operation strategy:
Short near 3350, stop loss 3360, profit range 3320-3315. If the price continues to fall, you can hold a small position, and the area near 3300 is likely to be touched.

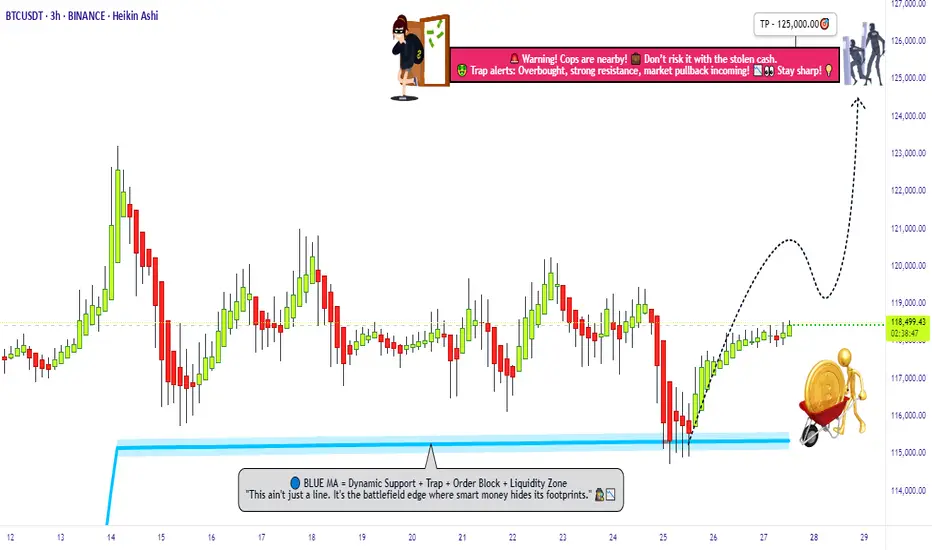
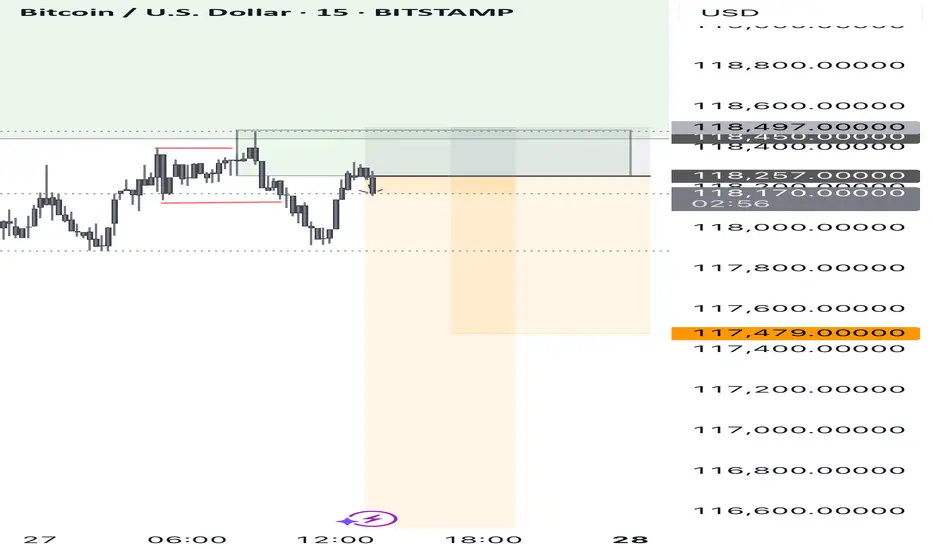
"Bitcoin’s Big Heist – Are You In or Out?"🚨 BTC/USDT HEIST MISSION – SWIPE THE BULL RUN BEFORE THE BEARS WAKE UP 💰💣
🌟Hi! Hola! Ola! Bonjour! Hallo! Marhaba!🌟
Money Makers & Robbers, assemble! 🤑💰✈️💸
Here’s your decoded BTC/USDT “Bitcoin vs Tether” Crypto Market Heist Plan, fully loaded with Thief Trading Style 🔥 TA + FA combo. We’re prepping for a bullish breakout loot – eyes on the vault, ignore the noise.
🎯 PLAN OF ATTACK:
🎯 ENTRY (BUY ZONE):
💥 “The vault’s open—time to sweep!”
DCA/Layer your buy limit orders near the 15–30 min swing lows/highs for sniper pullback entries.
Use multi-entry method to stack positions (layering / DCA) as per your ammo (capital 💵).
🛑 STOP LOSS:
Set SL at the nearest swing low wick (4H TF) — around 115000.00, adjust based on your risk/load.
SL = insurance. Not optional.
🏁 TARGET:
Lock sights on 125000.00
🎉 Or… vanish with profits before the bear cops arrive.
🔎 MARKET BACKDROP & ANALYSIS:
📈 BTC/USDT currently signals bullish vibes on the swing/day horizon — fueled by:
Macro Fuel & Fundamentals
Sentiment Radar
COT Reports
On-Chain Pulse
Intermarket Clues
🚀 Connect the dots. The smart money's already prepping a breakout move.
🧲 Scalpers Note:
Stick to the long side only. No shorting the beast — unless you’re made of diamonds.
Secure your bag with trailing SLs.
⚠️ NEWS TRIGGER ZONE – TRADE WITH TACT:
📢 Upcoming high-volatility news events can spike charts.
Avoid new entries during releases and guard open trades with trailing SLs.
Protect the loot. Always.
💖 SUPPORT THE HEIST GANG: BOOST IT!
Smash that ❤️ to boost our thief squad’s momentum!
Every click powers this underground mission – making money with style, one pip at a time. 🎯💣💵
🚀 See you in the next heist drop.
Until then – Stay stealthy. Stay profitable. Stay legendary. 🐱👤💸🏆
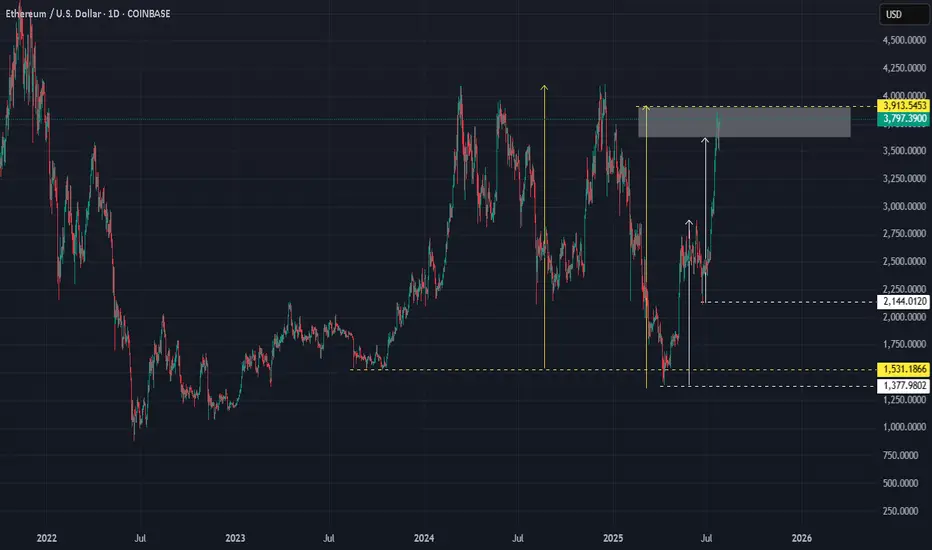
ETHUSD : Good luck :-)A lot of people get carried away easily.
It is ALWAYS a MISTAKE to buy at the TOP. You have already missed the boat.
Trade with common sense, not with emotion.
Good luck.
DOW: Dow Inc. cut its dividends in half !High dividends no longer !
I was waiting the stock to reach the support level to benefit from the 10% high dividends yield... but the company cuts its dividends yield from 10% to 5%, so it is no longer valid to me.
Disclaimer: This content is NOT a financial advise, it is for educational purpose only.

GOLD MARKET ANALYSIS AND COMMENTARY - [Jul 28 - Aug 01]This week, OANDA:XAUUSD prices had a positive start, rising sharply from 3,345 USD/oz to 3,439 USD/oz because investors were concerned about the risk of financial market instability when US President Donald Trump continuously pressured the FED Chairman to reduce interest rates, and there were even rumors of the Fed chairman resigning.
However, the upward momentum in gold prices was not maintained when the US continuously reached trade agreements with partners such as Japan, Indonesia, Philippines..., cooling down the trade war. This caused gold prices to drop sharply for three consecutive trading sessions, at one point the gold price dropped to 3,325 USD/oz and closed at 3,336 USD/oz.
Trade war worries are starting to subside. Therefore, we continue to witness a shift of investment capital flows from gold to risky assets such as stocks..
Notably, this week is the fourth time gold prices broke the $3,400 threshold but did not stay above this level.
Next week, in addition to the FED meeting, the market will also receive information about US non-agricultural employment (NFP) data. If this index falls stronger than expected, it will further strengthen expectations that the FED will continue to keep interest rates at the current level in upcoming meetings, causing gold prices to drop even more sharply next week.
📌In terms of technical analysis, the three crows pattern (3 long red candles) appeared on the D1 chart, showing that sellers were still in control throughout the past 3 trading sessions without much buying power. This technical pattern often suggests that gold prices may be shifting from their recent upward trajectory into a more prolonged period of decline. This technical signal also quite coincides with the context of many fundamental factors, such as geopolitical conflicts, trade wars, low physical gold demand in the summer... no longer strongly supporting gold prices as before. However, according to many experts, if the gold price drops sharply, it will be a good opportunity to buy, because the gold price is forecast to still increase strongly in the long term.
On the H4 chart, gold price may continue to adjust down below the 3,285 USD/oz mark, before recovering again. Meanwhile, the 3,450 USD/oz area is still a strong resistance level for gold prices next week.
Notable technical levels are listed below.
Support: 3,310 – 3,300 – 3,292USD
Resistance: 3,350 – 3,371 – 3,400 – 3,430USD
SELL XAUUSD PRICE 3383 - 3381⚡️
↠↠ Stop Loss 3387
BUY XAUUSD PRICE 3316 - 3318⚡️
↠↠ Stop Loss 3312

TRON Eyes 17 Percent Surge Toward Explosive 0.37 Breakout TargetHello✌
Let’s analyze TRON’s upcoming price potential 📈.
BINANCE:TRXUSDT is currently approaching a key daily support zone that aligns with a notable Fibonacci retracement level 🧭. This technical confluence suggests a potential short-term rebound, and I’m watching for a possible move of around 17% toward the 0.37 target 🎯.
✨We put love into every post!
Your support inspires us 💛 Drop a comment we’d love to hear from you! Thanks , Mad Whal

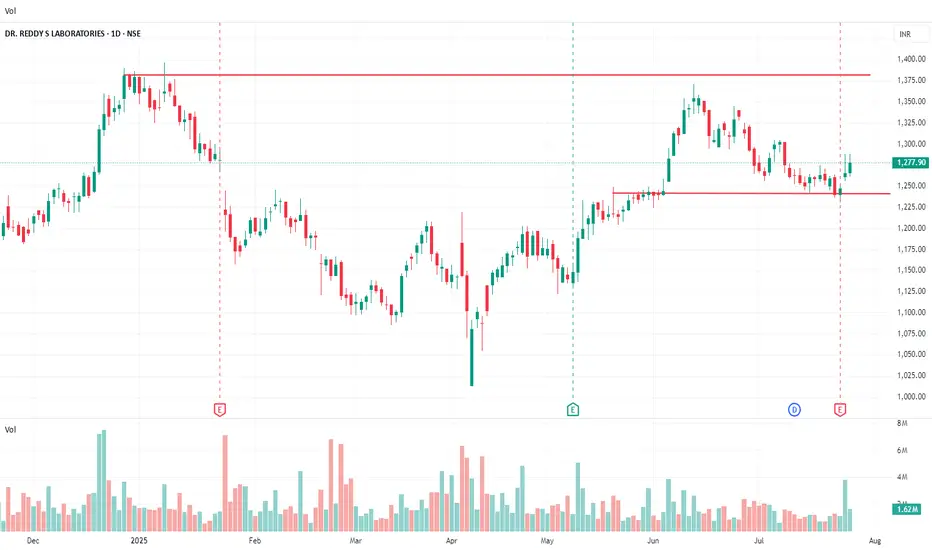
Technical bounce back on cardsRevenue: ₹8,545 crore (~11% YoY increase)
Net Profit (PAT): ₹1,418 crore (~2% YoY growth)
North America generics revenue declined ~11% to ₹3,412 crore due to pricing pressures, while Europe surged 142% YoY
Consensus estimates (SimplyWall.st): Average target at ₹1,289, with bullish/bearish range ₹1,660–₹990. Growth forecast modest (~2.9% revenue CAGR through 2026) — down from 13% historical average
Despite milestones in revenue, margins remain under pressure from global competition
For long-term investors: A conservative growth stock with moderate dividend income—best suited for those seeking stability with exposure to generics in key markets.
For traders or momentum players: Watch India- and Europe-driven growth and pipeline developments. U.S. competition remains a major swing factor.
XAUUSD SNIPER OUTLOOK – JULY 28, 2025🔥 Macro & Sentiment
The dollar remains dominant — DXY holding above 105 keeps gold under pressure. No fundamental support for bullish continuation unless major macro shifts. Risk flows are defensive, not aggressive. FOMC and US GDP data remain key drivers for direction this week.
BIAS:
• Short-term bearish under 3350
• Market still in distribution mode — every bounce gets sold
• Real buy interest only deep below 3315
🔻 INTRADAY SUPPLY ZONES (Short Only With Rejection)
1. 3382–3370 (H1/M30 Premium Supply)
🔹 H1 order block, FVG alignment, EMA21/50/100 convergence
🔹 Liquidity inducement above → then rejection
📍 Short only if rejection shows via engulf / upper wick.
2. 3355–3340 (Decision Zone / Micro Supply)
🔹 EMA100/200 alignment, former support flipped resistance
🔹 M30 FVG fully filled, structure flip from mid-July
📍 Short bias below. Long only if reclaimed with H1 close above 3355.
🔵 NEUTRAL / PIVOT ZONE
3. 3338–3326 (Decision Band – M30/M15)
🔹 Consolidation area post-BOS, internal liquidity sweeps
🔹 EMA21 base on M15, no clear dominance
📍 Wait for clean reaction. Bullish engulf = scalp long to 3355. Failure = slide to demand.
🟢 DEMAND ZONES (Buy Only On Strong Reversal Confirmation)
4. 3314–3302 (M30/M15 Deep Demand)
🔹 H1 OB + hidden FVG + fib 38.2%
🔹 First real demand zone where buyers may engage
📍 Long only if strong M15 confirmation: engulf + RSI cross + EMA5/21 angle change.
5. 3289–3272 (True Reversal Demand – H1/M30)
🔹 Full NY reversal origin (July 18), major FVG left unfilled
🔹 Institutional volume + liquidity grab zone
📍 Buy only on full flush + fast snapback with BOS on M15/H1.
🧭 BIAS & EXECUTION BY TIMEFRAME
H4 Bias:
Bearish while below 3350. No valid supply above until 3370+. Avoid longs unless price sweeps 3314 or 3272 and confirms.
H1 Bias:
Sell clean rejection at 3355 or 3370–3382. Only flip long above 3355 with full-bodied close.
M30 Bias:
Watch decision zone 3338–3326 for direction. No-man’s land in between — don’t force trades.
M15 Bias:
Scalp long from 3314 or 3272 only on full confluence (OB + RSI + EMA realignment). Short only confirmed rejections above.
📊 FULL INTRADAY KEY LEVELS (Top → Bottom)
Level Context
3405 Fib ext. 127% (HTF sweep target only)
3385 OB
3375–3350 Valid Premium Supply (H1 shelf)
3350–3340 Micro Supply / Flip Zone
3338–3326 Decision Zone – watch reaction
3314–3302 Deep Demand (H1/M30 confluence)
3289–3272 Extreme Demand Base
3260 Fib 61.8% + HTF support
3250 Minor volume node
3240 Final structural floor
✅ EXECUTION NOTES
⛔ Avoid entering inside 3340–3326 → fakeout zone
✅ Play only clean sniper triggers with structure
⚠️ Wait for macro — FOMC / GDP releases may fake both sides
💡 Patience wins. Pick your zone, wait for setup, strike.
Which zone are you watching to strike? Drop your bias below.
📍 Like, comment & follow GoldFxMinds for the most precise sniper maps on TradingView.
Disclosure: This plan is based on the Trade Nation chart feed. I am part of their Influencer Program.

Pony.ai is a cutting-edge autonomous driving company.Revenue: Still in early-stage / pre-revenue phase
Heavy R&D spending
Backed by over $1B in funding
Valuation during last private round: ~$8.5 billion
✅Strong partnerships (Toyota, Hyundai)
✅ Dual-market presence: US + China
✅ Leader in AV permits in California
✅ Advanced AI and simulation tech stack
PONY is a speculative play in the autonomous vehicle space. Great for long-term investors who believe in AV tech and are okay with volatility.
Risk: 🔴🔴🔴🔴⚪
Growth Potential: 🟢🟢🟢🟢⚪
Dividend: ❌ None
Ideal For: Long-term tech investors, AI/autonomous sector enthusiasts

BTC SELL?A nice short opportunity for sell on Btc/Usd.
Intraday trade.
If it get continuation BTC could drop to lower levels.
Aiming for at least 3R
Let’s see how it plays out.
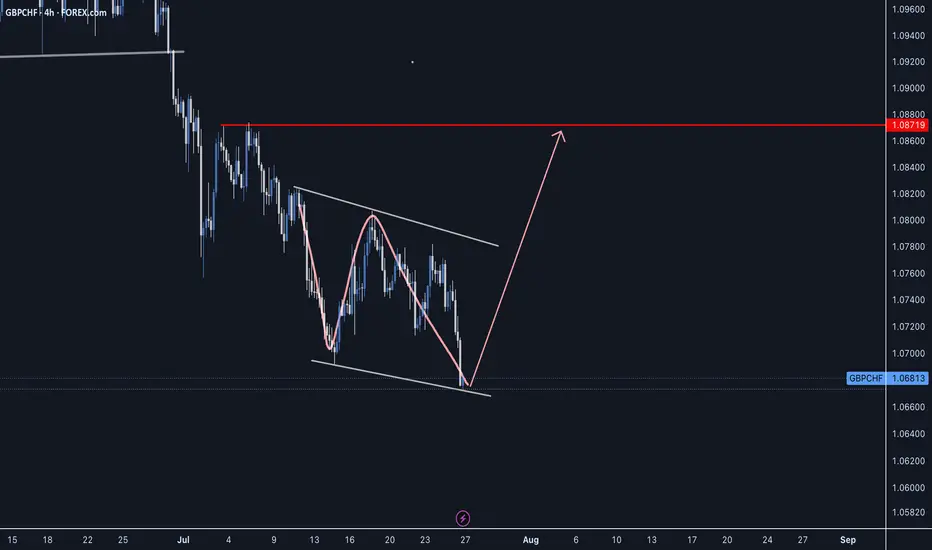
GBPCHF - Classic 'W' PatternGBPCHF has been setting up for the next impulse phase as we can see common 'W' price action pattern which has made the last swing low in this reversal structure to see buyers step in and push price upward.
Always wait for confirmation, Good Luck
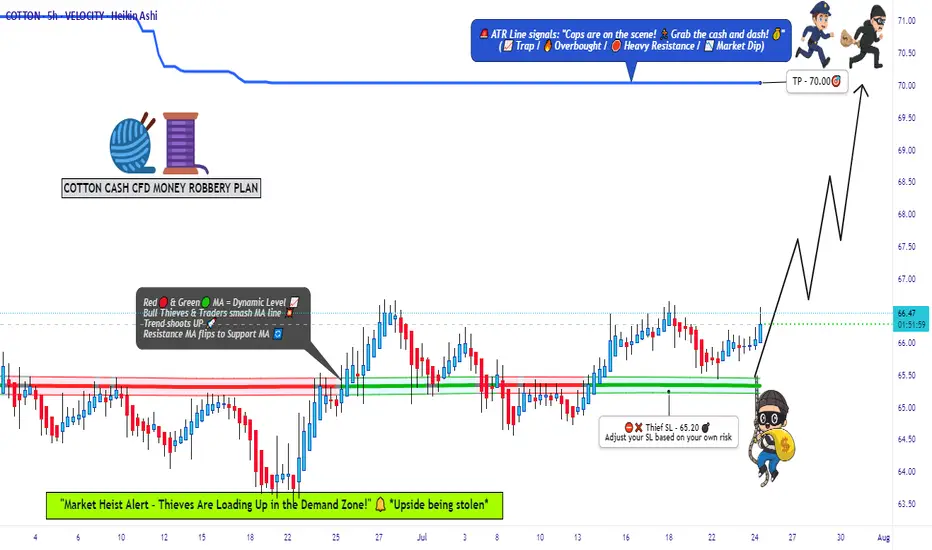
COTTON QUICK TRADE: Low Risk, High Reward Setup!🚨 COTTON HEIST ALERT: Bullish Bank Robbery in Progress! (CFD/Commodity Raid Plan) 🚨
Thief Trader’s Master Loot Strategy – Long Entry, Escape Before the Cops Arrive!
🌟 Greetings, Fellow Market Bandits! 🌟
Hola! Bonjour! Hallo! Marhaba! 🤑💸 Money Makers & Midnight Robbers, it’s time to execute the COTTON COMMODITY HEIST with precision. Based on 🔥Thief Trading Style Analysis🔥, this is your VIP invite to the biggest bullish swipe of the season.
🔓 THE VAULT IS OPEN – ENTRY PLAN (LONG RAID)
📈 "Break the Lock & Loot!"
Ideal Entry: Buy limit orders within 15-30min pullbacks (swing lows/highs).
Pro Thief Move: Layer your entries (DCA-style) for maximum stealth.
Aggressive Robbers: Charge in directly if liquidity is high.
🚨 STOP-LOSS (ESCAPE ROUTE)
🛑 "Hide Your Loot or Get Busted!"
Place SL below the nearest swing low (5H MA @ 65.20).
Adjust based on your risk tolerance & loot size (multiple orders = tighter escape).
🎯 TARGET: CASH OUT BEFORE THE COPS ARRIVE!
🏴☠️ Take Profit Zone: 70.00 (or escape earlier if the market turns shaky!)
Scalpers: Trailing SL = your best ally. Stick to LONG-ONLY quick hits!
Swing Bandits: Ride the wave but don’t get greedy—exit before the pullback trap!
🔥 WHY THIS HEIST WILL WORK (BULLISH CATALYSTS)
🧵 Cotton’s Price Surge Fueled By:
Supply Squeeze (Storage/Inventory Data 📉).
COT Report Shows Big Money Going Long 🏦.
Seasonal Trends + Macro Sentiment Shift ☀️📈.
Intermarket Signals Aligning (Commodity Supercycle?).
(Full analysis? Check the FUNDAMENTALS & KLICKK! 👉🔗)
⚠️ WARNING: NEWS TRAPS & VOLATILITY AHEAD
📰 "Cops (News Events) Can Crash the Party!"
Avoid new trades during high-impact news (liquidity dries up = slippage risk!).
Lock profits with trailing stops—don’t let the market reverse-steal your gains!
💥 BOOST THIS HEIST – STRONGER GANG = MORE LOOT!
💖 "Smash the 👍 LIKE button to support the crew!"
More boosts = more heist plans (next target: OIL? GOLD? STOCKS?).
Daily profit raids await—follow & stay tuned! 🤝
🚀 See you at the escape zone, bandits!💨
🎯 FINAL THIEF TRADER RULE:
"Steal Fast, Exit Faster—No Prison Trades!" 🏃♂️💨
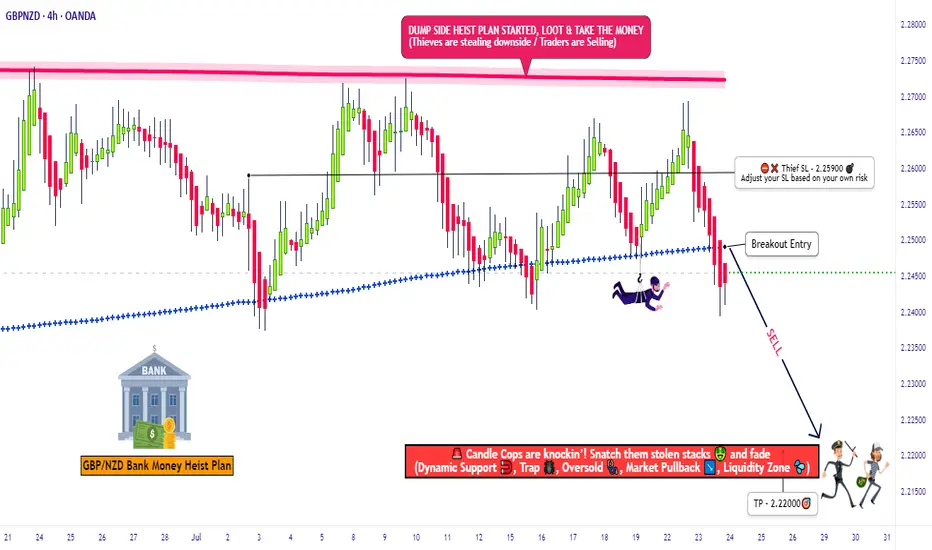
"GBP/NZD: Bearish Storm Brewing – Get Ready!🚨 GBP/NZD HEIST ALERT: "Pound vs Kiwi" Bearish Trap Setup! 🚨 (Scalping/Day Trade)
🌟 Attention, Market Robbers & Profit Pirates! 🌟
🔥 Thief Trading Strategy Activated – Time to short the GBP/NZD like a pro! This pair is setting up for a bearish heist, and we’re locking in entries before the drop. High-risk, high-reward? You bet.
🎯 TRADE PLAN (Bearish Ambush)
Entry Zone (Short) 📉:
Optimal: Sell limit orders on retests (15m/30m timeframe).
Thief’s Trick: Layer entries (DCA-style) near recent highs for max efficiency.
"Enter like a sniper, escape like a ghost." 👻
Stop Loss 🛑:
4H Swing High/Wick (Near 2.25900) – Adjust based on your risk & lot size.
"A smart thief always has an exit route." 🏃💨
Target 🎯: 2.22000 (or escape early if the trap snaps shut!)
💣 WHY THIS HEIST? (Bearish Triggers)
Technical Setup: Oversold bounce? Nah. Consolidation → Reversal trap.
Fundamentals: Weak GBP sentiment? Strong NZD data? Check the news!
Market Psychology: Bulls are getting trapped at resistance—time to fade them.
⚠️ THIEF’S WARNING
News = Volatility Bomb 💣 – Avoid new trades during high-impact events.
Trailing SLs = Your Best Friend – Lock profits & dodge reversals.
💎 BOOST THIS IDEA & JOIN THE HEIST!
🔥 Hit 👍 LIKE, 🚀 BOOST, and FOLLOW for more lucrative robberies!
💸 "Steal the market’s money—before it steals yours." 🏴☠️
🔔 Stay tuned—next heist coming soon! 🔔
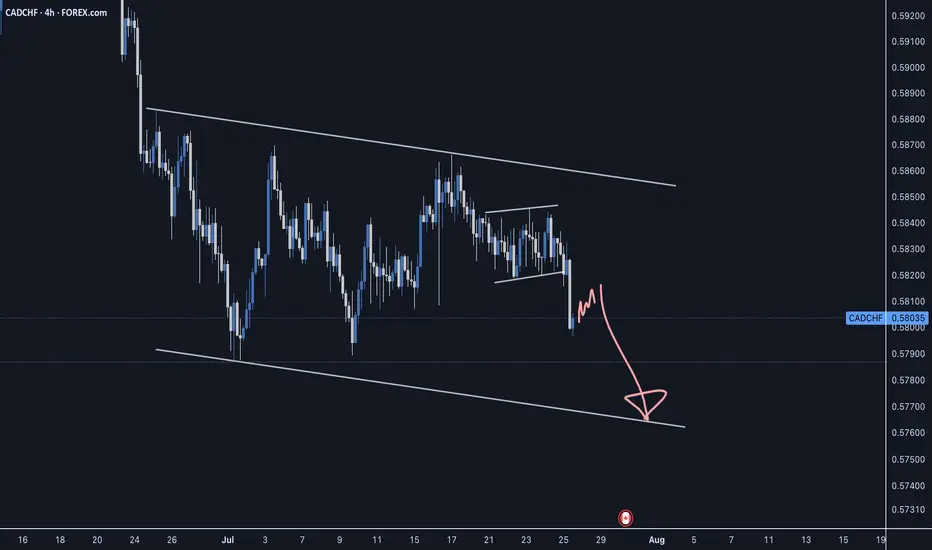
CADCHF - Sellers still in controlCADCHF has been moving within a reversal structure which could make another swing low to complete this pattern before the next move up.
Good Luck
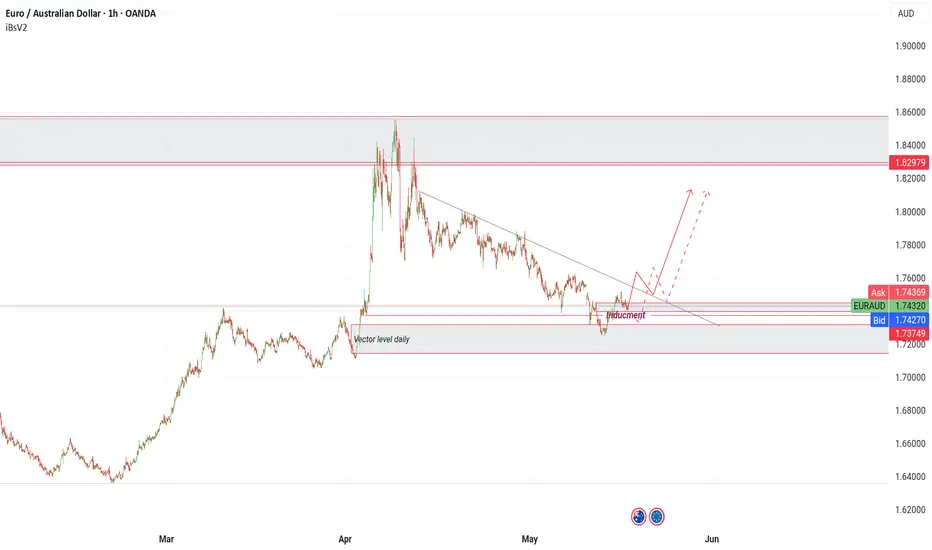
Euraud daily timeframe
"Hello friends, focusing on EUR/AUD on the daily time frame, the price is currently in a bullish trend and appears to have completed its pullback to a critical level on the daily chart. In the 4-hour timeframe, there are indications of upward momentum.
After observing the price behavior this week, I believe that higher prices are more likely. However, it is important to note that if the price closes below the 1.7100 level on the 4-hour chart, this analysis may prove incorrect."
If you have any more details to add or need further assistance, please let me know!
Gold on high time frame
"Hello traders, focusing on gold, the price recently swept liquidity around $3,250 and displayed strong signals indicating a potential upward movement. The next target could be around $3,400."
If you need further clarification or have more details to discuss, feel free to share!