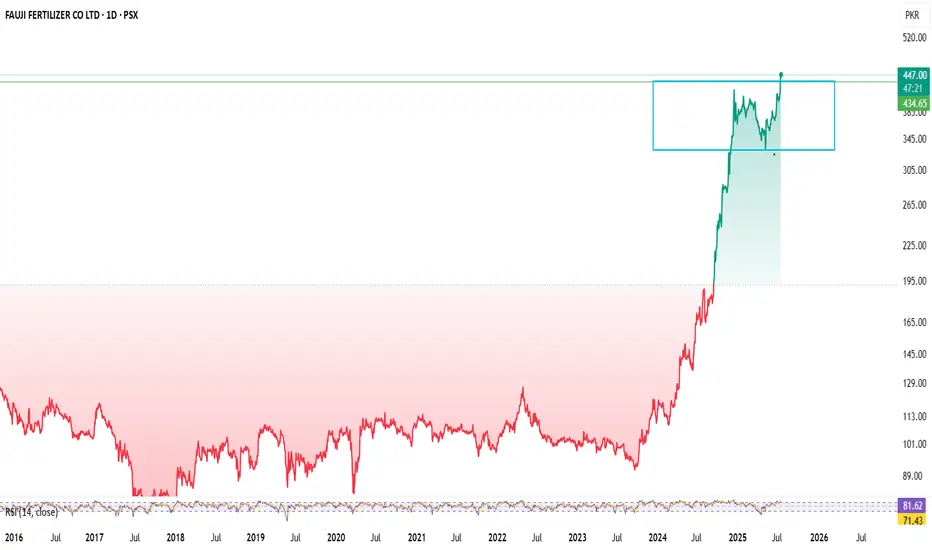
FFCFFC PSX STOCKs breakout Day Level Buy Call
Fundamental Strengths
Robust earnings growth:
FY 2024 net profit ~PKR 64.7 B vs ~PKR 29.7 B (2023) – EPS nearly doubled to PKR 45.49
Pakistan Stock Exchange
+15
StockAnalysis
+15
.
Q1 2025 EPS ~PKR 9.33 (Sep‑Nov on TTM ~PKR 66.6)
Pakistan Stock Exchange
.
Attractive valuation:
TTM P/E ~9.6× (TradingView shows ~6.6×—likely consolidated vs standalone) .
High dividend yield:
~8.7–9.9% yield in 2024, with a ~60% payout ratio
TradingView
.
Diversified portfolio:
Operations across fertiliser, power, food, banking (via Askari Bank), wind generation, phosphate JV – mitigating sector risk
TradingView
+1
+1
Strong ownership:
Backed by Fauji Foundation (~43% owner) – adds stability and governance credibility
Fundamental Analysis
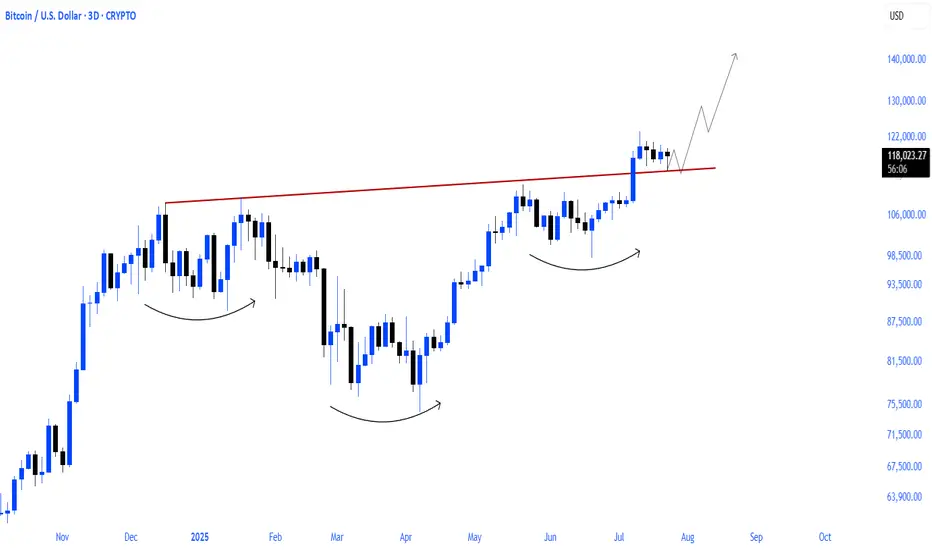
$BTC NEXT WAVE PROGRAMMED!bitcoin will load the next wave after the accumulation process it is in after the parabolic run
#QS - 4HR [Will the last boost last or will it bust? With a new Volkswagen investment and partnership. Quantum Scape’s earnings were far from stellar with a 26% decrease in income compared to same time last year. They have, nevertheless, made advancements with their very promising lithium-Metal battery technology.
With fundamentals aside, I am curious to gauge how long-term investors have priced-in the company's stock price.
Technically, I see price moving to present yet another opportunity by EOY if not sooner. My count shows important levels to watch.
Go #QuantumScape, Go!!!
Check out my other chart ideas @CaxhPrince everywhere.

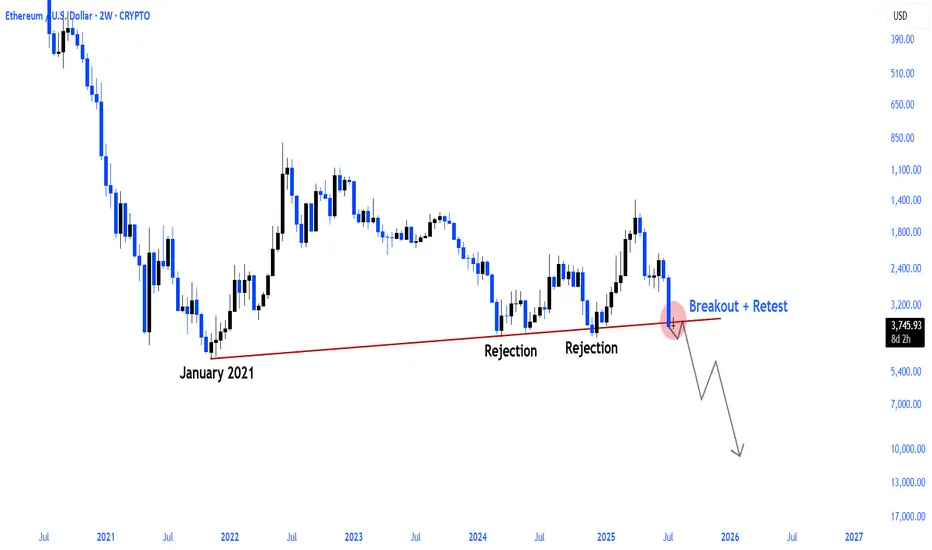
$ETH MAJOR FALLING TREND BREAKOUT!CRYPTOCAP:ETH MAJOR FALLING TREND BREAK AND RETEST COMPLETE.
Eth season seems to be just around the corner
MORE TO COME
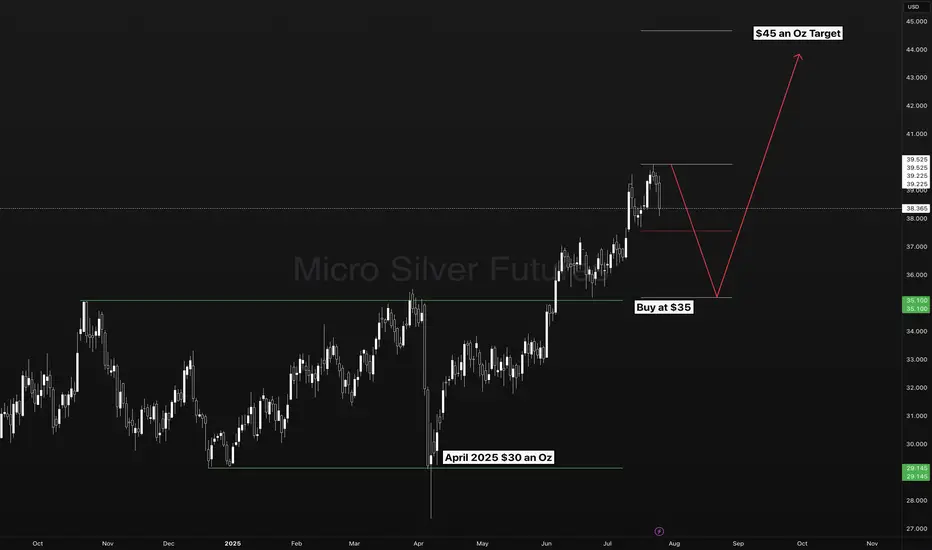
Silver - The Long Term SetupSilver on the longer term may be setting up for a trend continuation opportunity from $35 to $45 dollars an Oz.
Do you Trade FOREXCOM:XAGUSD ?
Do you Trade FOREXCOM:XAUUSD ?
US Dollar Strength To Return In Full ForceThe mighty Dollar will once again prevail in the long term across all major pairs. It's status as the world reserve currency is far from removed.

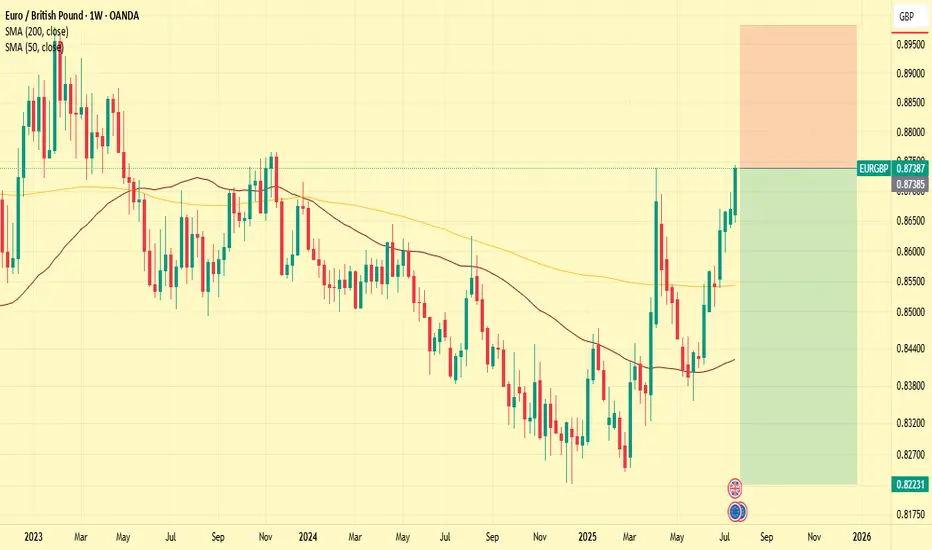
Swing Short for EURGBPPrice will likely turn bearish again soon. Expecting the Pound to regain ground.
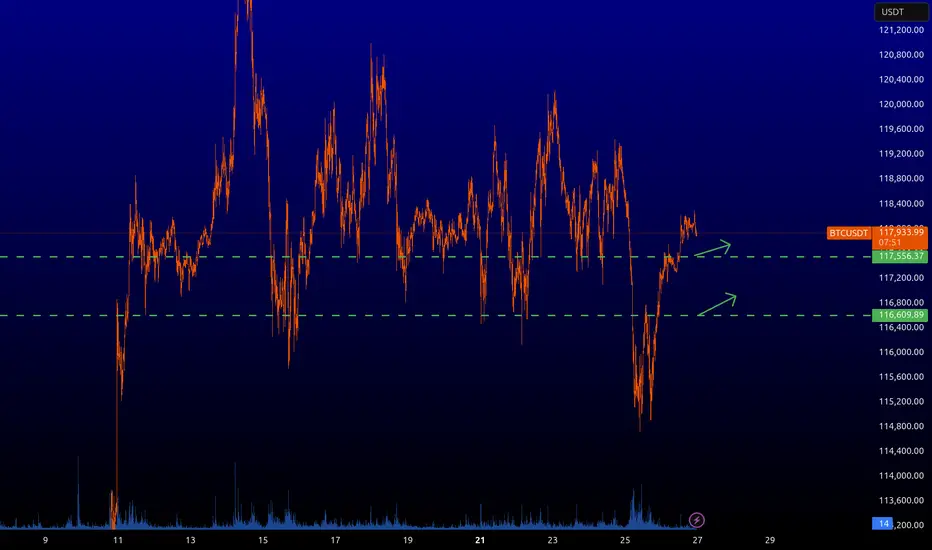
BTCUSD LONGIt's a long time to write and explain everything, just buy the level with the limit that is at ~117.550. You can count on a short-term rebound.
The one below the touchdown is not worth taking. I'll let you know if it works or not later.
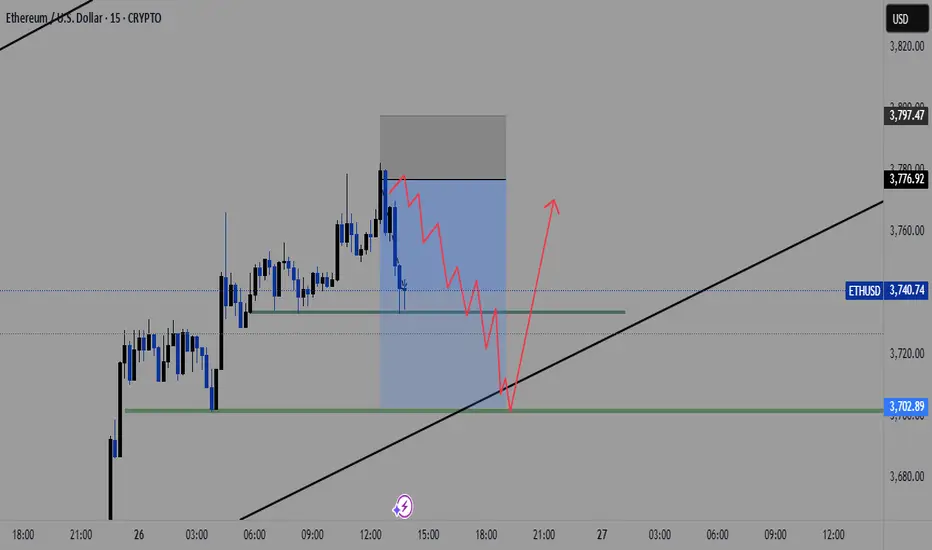
ETH to $3700 Before a Major Bounce?Ethereum has been showing signs of exhaustion after its recent rally. I'm watching the $3700 level closely — it's a key support zone that has acted as both resistance and support in the past.
🟦 If ETH pulls back to this area, I expect it to find strong buying interest, potentially leading to a significant bounce and continuation of the bullish trend.
📌 Scenario I'm Watching:
🔻 Pullback to the $3700 support zone
📉 Shakeout or stop hunt below previous lows
💚 Followed by a strong bullish reversal — possible move toward $4000+
Why $3700?
Confluence of previous highs/lows
Psychological round number
Potential liquidity pocket
Not Financial Advice!
This is a scenario I'm tracking, not a guarantee. As always, wait for confirmation (e.g. bullish engulfing, RSI divergence, volume spike) before jumping in.
📉 If $3700 fails decisively, I'll reassess — next support likely around $3550–3600.
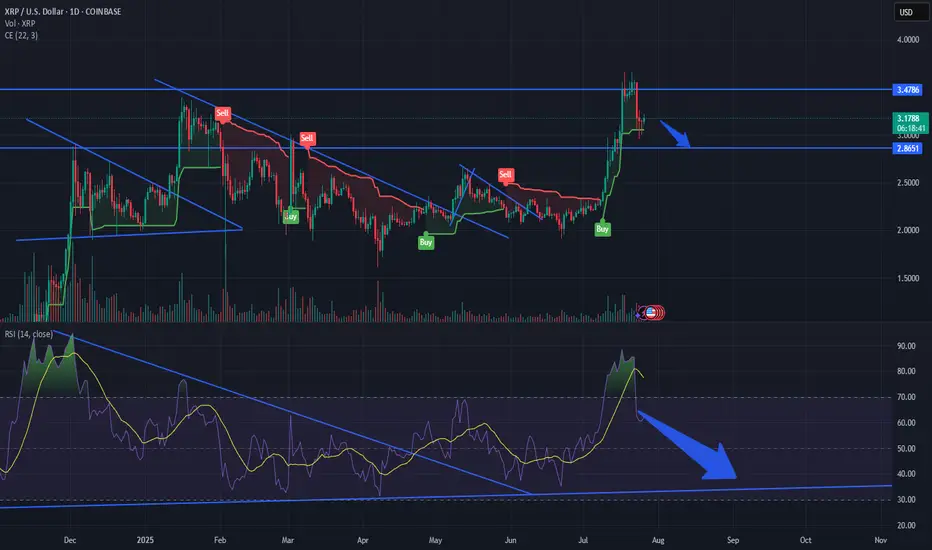
XRPUSD 4 Hour BottomXRP has broken out of the weekly wedge leaving a long weekly candle stick close. Price has pulled back indicating it it ready for the next leg higher. Daily candle closed bullish and 4 hour time from has double bottom.

Bitcoin vs Global M2: Can Liquidity Predict the future?This chart compares Bitcoin’s price (daily) with a Global M2 indicator that includes the monetary supply of major economies like the U.S., Eurozone, China, and Japan.
It’s not a perfect global measure — but it gives us a reliable macro signal of what global liquidity is doing.
And when it comes to Bitcoin, liquidity is everything.
Why this matters:
Bitcoin is often seen as volatile or unpredictable. But when we zoom out and overlay it with liquidity flows (like M2), a powerful pattern emerges:
Bitcoin tends to follow global M2 with a ~10-week lag.
When M2 rises, Bitcoin often rallies weeks later. When M2 contracts, Bitcoin loses momentum.
This makes M2 a powerful leading indicator — not for predicting exact price levels, but for catching the direction of trend and regime shifts.
What this chart tells us:
M2 leads, Bitcoin follows.
The curves won’t align perfectly — but the macro structure is there.
Big expansions in M2 create a friendlier environment for risk assets like BTC.
This is the same logic used by macro strategists like Raoul Pal: liquidity drives everything.
Important disclaimer:
This doesn’t mean M2 tells you where price will be on a specific date. But it can help identify turning points — and confirm whether we’re in a reflationary vs contractionary environment.
Think of it as a weather forecast, not a GPS pin.
In other words:
This chart doesn't show the price. It shows the future.

xrp correction time rsi indicates oversold RSI is oversold on the 1 day daily correction happening next stop $285 ish good luck
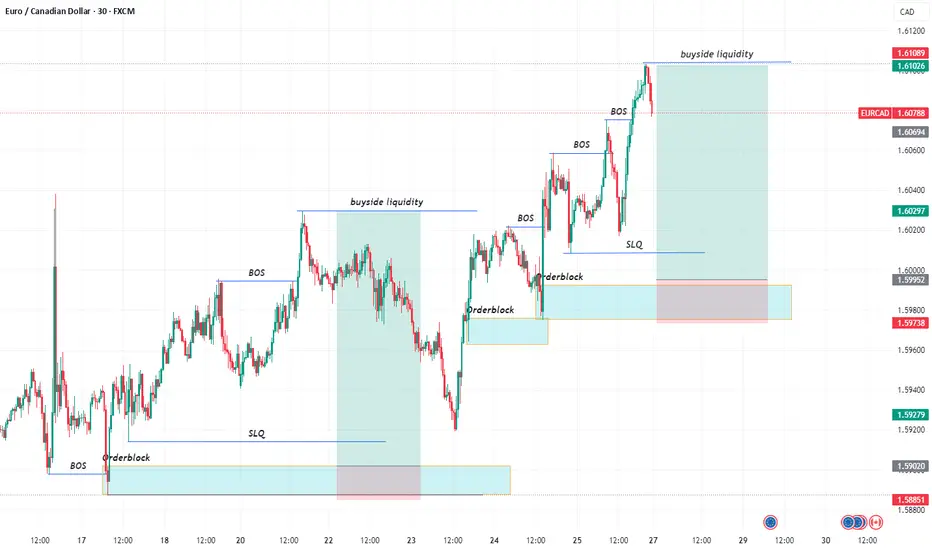
EURCAD BUYS!Both entries still very much valid, we are bullish on the daily , first entry pushes to the upside to take out liquidity , then we target the imbalance in the market at the bottom, which then pushes the market to break our last daily high.
Teach me to fish, don’t hand me the catch.
---
🎯 **“Teach me to fish, don’t hand me the catch.”**
That’s the mantra behind what we do.
We’re not here to hand you quick wins—we’re here to equip you with the tools, mindset, and precision to master the art of **technical analysis**.
📚 **Follow Us** as we unlock proven strategies, crafted through years of experience and sharpened by real market conditions.
💼 **What You'll Get:**
- High-performance analysis techniques
- Visual case studies from our **actual trades**
- Clear examples from the insurance sector and beyond
- A blueprint to recognize and seize winning setups with confidence
💥 Whether you're new or seasoned, this isn't textbook theory.
This is **applied strategy**, built for clarity and verified by results.
---
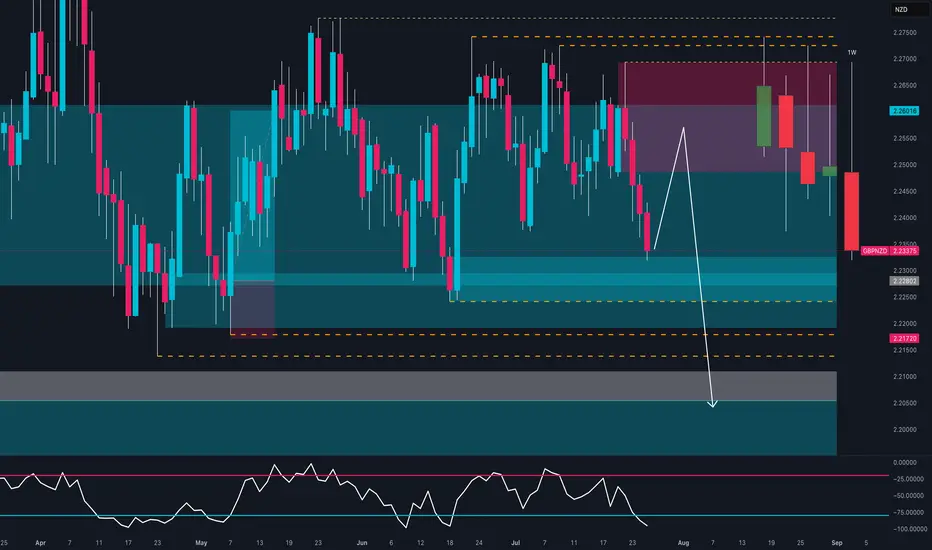
GBPNZD Breakdown – Smart Money Turns Fully Bearish🧠 Macro + COT + Sentiment Context
Commitment of Traders (COT) – Asset Managers
Institutional asset managers are significantly net short on GBPNZD, with positioning at its lowest level of the year and declining sharply since May. This reflects a clear bearish stance from smart money and reinforces the current downward pressure.
Sentiment & Momentum Indicators
DPO: -54.9 → Indicates a moderately bearish momentum phase.
Wyckoff: -20.3 → Price is in a distribution phase, suggesting weakness.
Speed: 3.2 → Low acceleration, but directional bias remains bearish.
Market Mood: Neutral, but leaning into oversold territory.
Seasonality (July 1st – Sept 30th)
Historically, GBPNZD performs positively in this period:
3Y: +1.7%, 5Y: +1.6%, 10Y: +2.3%, 15Y: +2.8%
However, in 2025, price is diverging sharply from seasonal norms. The pair is trading against historical patterns, suggesting a seasonal anomaly where institutional flow is dominating historical behavior.
🧱 Technical Outlook (Daily Chart)
GBPNZD had been consolidating in a clear range between 2.2170 support and 2.2750 resistance since May. The pair has now broken down with a strong, full-bodied weekly candle, closing below the 2.2320 demand zone.
Key Technical Zones:
Supply zone (2.2494–2.2659) → A clear rejection zone that initiated the current selloff.
Demand zone (2.2170–2.2300) → Has been tested twice already, increasing the probability of a clean breakdown.
RSI (Daily) → Currently neutral, with a sequence of lower highs and no bullish divergence in sight — indicating weak momentum.
✅ Conclusion & Trade Plan
Directional Bias: Bearish (Short)
Although seasonality typically supports bullish price action for GBPNZD in Q3, the current context is decisively bearish. Institutional positioning, price structure, and sentiment all confirm a potential shift in direction, reinforced by a confirmed weekly breakdown.
Bearish Targets:
📍 First: 2.2170 (recent support test)
📍 Second: 2.2000–2.1900 (April swing low)
📍 Extension: 2.1750 (base of previous accumulation zone)
Invalidation Criteria:
A weekly close above 2.2490 (supply zone breached)
Bullish RSI divergence + weekly recovery candle
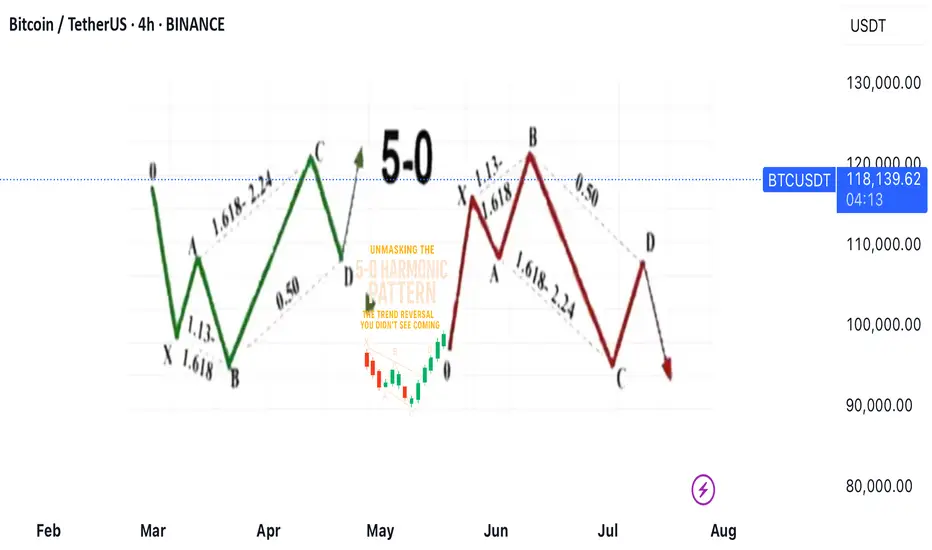
Unmasking the 5-0 Harmonic Pattern
---
🎯 **Unmasking the 5-0 Harmonic Pattern: The Trend Reversal You Didn't See Coming**
Discovered by the visionary Scott Carney and unveiled in _Harmonic Trading, Volume Two_, the **5-0 pattern** isn't just another blip on a trader’s radar—it’s a siren of market reversal.
📈 **Why It Stands Out**
- Unlike the familiar Bat or Gartley structures, the 5-0 pattern is fueled by **precise Fibonacci ratios**, making its reversal zone deadly accurate.
- Centered around the pivotal **Point B**, this model doesn’t just hint at change—it defines it.
🌀 **The Anatomy of a Flip**
- Often marking the **first true pullback in a major trend reversal**, the 5-0 isn’t a lagging indicator—it’s your early warning system.
- The **AB leg?** That’s no ordinary wave—it’s usually the final gasp of a fading trend, setting the stage for powerful new momentum.
💥 **Bottom Line**
This isn’t just technical analysis—it’s strategic foresight. The 5-0 pattern reveals where the market **hesitates... and where you strike**.
---
_"To truly learn, we must see it in action.
So let’s pull back the curtain and share a powerful example from our **past insurance market trades**—a deal that blended precision, timing, and strategy.
In comments
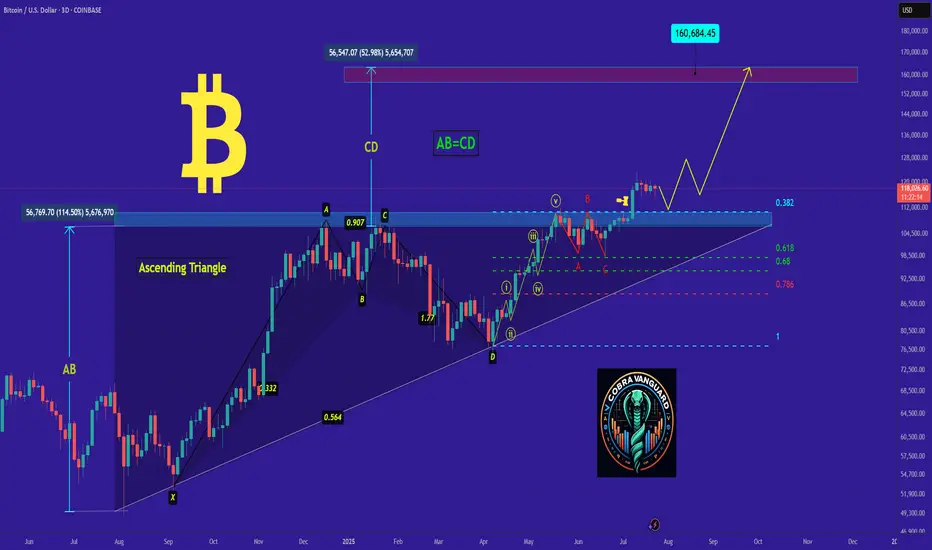
bitcoin- Time to buy again! (Update)As I said, Bitcoin broke the triangle, and now with a slight price correction, it could surge to $160,000, and you still think I'm joking!!
Previous analysis
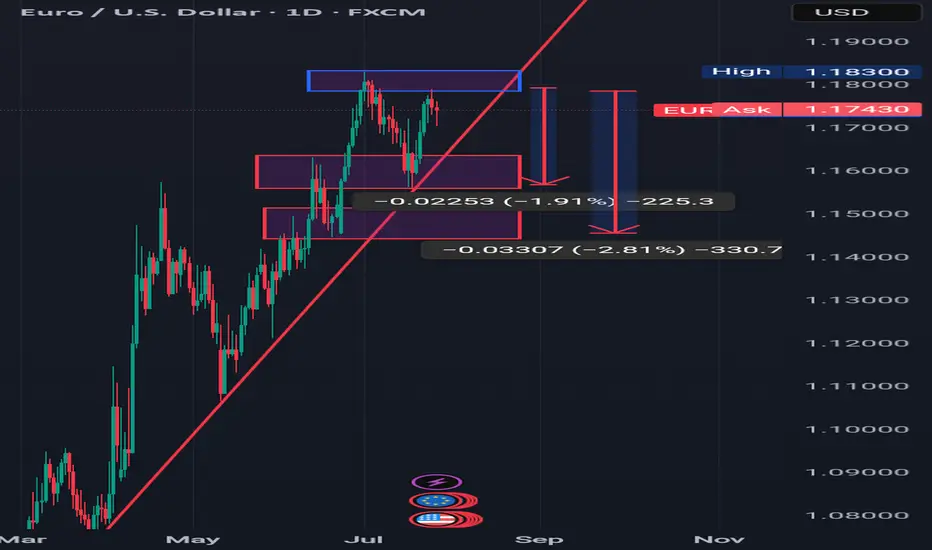
PROFIT TAKING ON EURUSD BUT UPTREND REMAINS INTACT Looking at the daily timeframe of EURUSD we can see that price action didn't take out liquidity at the Blue rectangle zone which was the all time high for EURUSD.
Going forward,I can anticipate signs of profit taking or hedging by market players or institutions but on general basis the uptrend of EURUSD is still intact.
So I will be anticipating a pullback to the desired zones which I indicated with a red rectangle and later we look for buying opportunities.
Targets are:1.15900,1.14900
Titanwhale: XRP as a Bridge Currency Ushers in a New EraAs global financial markets rapidly digitize, the need for instant, low-cost, and scalable cross-border payments is becoming more urgent. One of the key contenders redefining the cross-border payments landscape is XRP, the digital asset developed by Ripple Labs. It is increasingly recognized as a bridge currency capable of transforming international settlements.
According to analysts at Titanwhale, XRP offers a fundamentally different liquidity model—allowing institutions to bypass legacy correspondent banking networks and eliminate the inefficiencies of currency conversion and settlement delays.
XRP as Financial Infrastructure
Instead of converting fiat currencies directly—which requires liquidity and multiple intermediaries—banks and payment providers can leverage XRP as a neutral bridge asset. This model, known as On-Demand Liquidity (ODL), is already live in several key corridors, including the U.S.–Mexico, Japan–Philippines, and Europe–Southeast Asia.
Internal research from Titanwhale shows ODL volumes grew 57% year-over-year, with over $2.8 billion in XRP processed through RippleNet in Q2 alone.
“XRP is solving a real-world liquidity problem that traditional banking has struggled with for decades,” said Mia Chen, Head of Payments Analysis at Titanwhale. “And it’s doing so in real time—without intermediaries.”
Regulatory Clarity Boosts Adoption
The XRP ecosystem also benefited from a major legal milestone in 2023, when a U.S. federal court ruled that XRP is not a security when traded on public exchanges. This ruling lifted a significant cloud of regulatory uncertainty and paved the way for wider institutional participation.
Since the ruling, Ripple has announced CBDC partnerships with central banks, positioning the XRP Ledger as a politically neutral and interoperable infrastructure for next-generation digital currencies.
Titanwhale’s Strategic View
At Titanwhale, XRP is not viewed as a speculative asset, but as a cornerstone of the emerging global payment architecture. Its decentralized structure, instant settlement capability, and scalability make it uniquely suited to serve as a universal bridge asset in a fragmented currency landscape.
With growing institutional engagement and technical maturity, Titanwhale considers XRP a strategic allocation within diversified crypto portfolios over a 3–5 year horizon.

Huge breakout in Union Bank
After it's Q1 results Union bank is trading near it's previous breakout level, and is ready for a huge upside from here.
If we look at the past trends of Union Bank ( See below Images )
We can clearly see after a correction of about 40 to 50%, share rises with a huge breakout and it always rises for more than 100%.
Whoever missed the opportunity at first, this is the best to get into the stock for a potential profit target of 250.

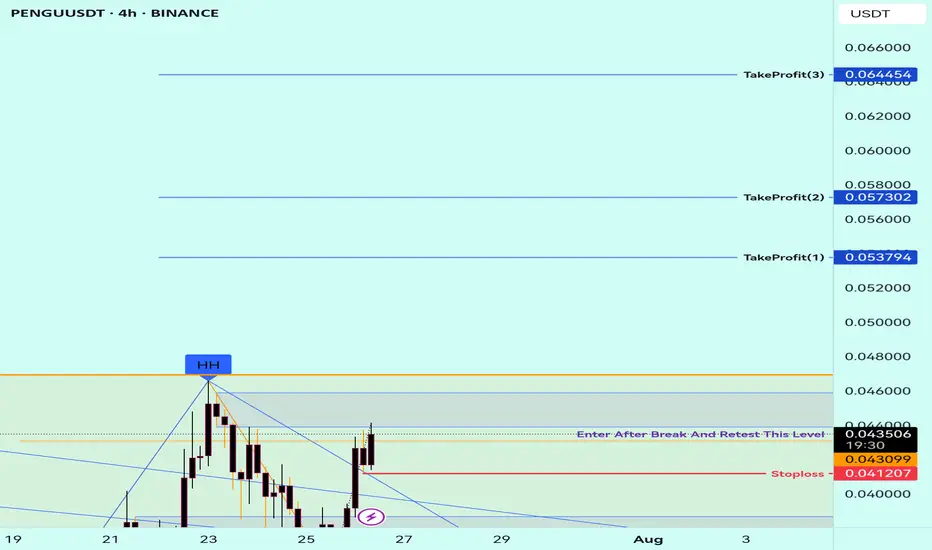
Buy Trade Strategy for PENGU: Betting on Meme Power and CommunitDescription:
This trading idea highlights PENGU, an emerging meme-based cryptocurrency that has gained popularity through its strong community support and viral potential. Inspired by internet culture, PENGU represents more than just humor — it taps into the growing trend of community-driven tokens that generate momentum through engagement, social media buzz, and grassroots marketing. With a limited supply and increasing visibility across platforms, PENGU positions itself within a niche market where speculation, culture, and community collide.
While meme coins like PENGU can offer explosive short-term potential, they also carry high levels of risk due to their dependence on community sentiment and lack of traditional utility or fundamentals. Market dynamics can shift rapidly, and what gains popularity quickly may also fade just as fast. Therefore, any investment in PENGU should be approached with caution.
Disclaimer:
This trading idea is for educational purposes only and does not constitute financial advice. Investing in cryptocurrencies, especially meme tokens like PENGU, involves significant risk, including the potential loss of all invested capital. Always conduct thorough research, understand the speculative nature of such assets, and consult a financial advisor before making any trading decisions. Past performance is not indicative of future results.
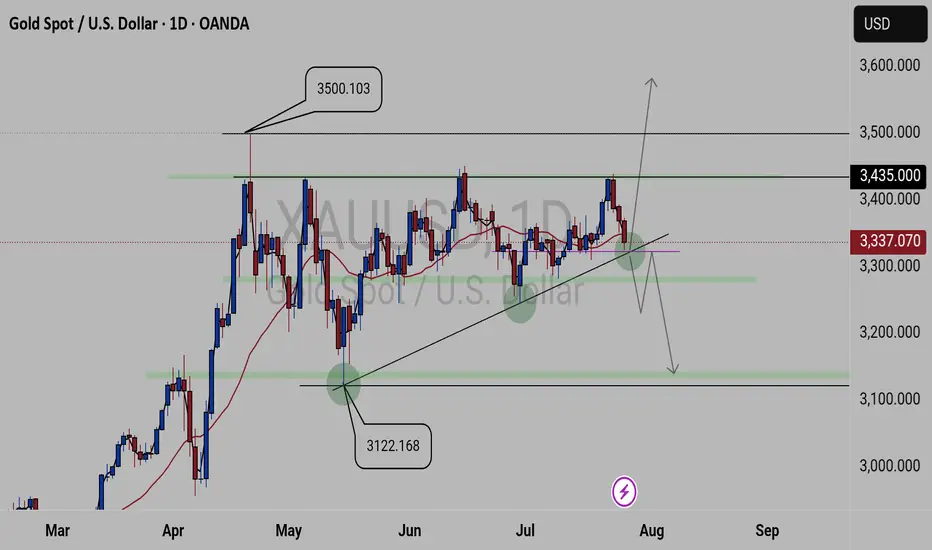
XAUUSD FORECASTThis is what we currently see on
GOLD.
We have 3500.103 key level as our current high zone and 3122.168 key level as our low zone. And Gold is been attempting to break 3435.00 key level resulting in selling, but been creating lower highs failing to break the created lows. Currently we a trading above the 3337.070 key level which is a critical key level, as it will determine the next coming movement.
Update will be given