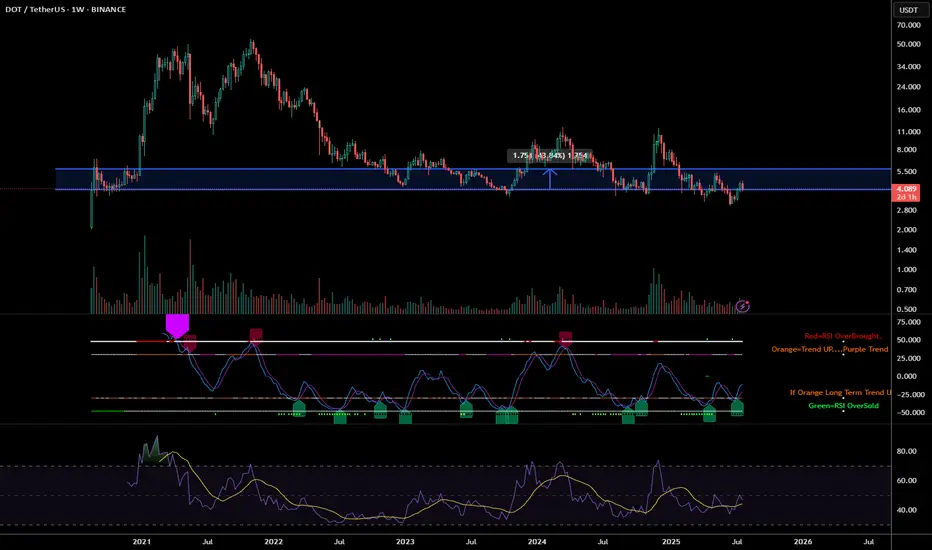
Polkadot (DOT) Technical Analysis: Navigating the Path Forward Polkadot (DOT) is currently trading at approximately $4.08 (as of July 25, 2025), having experienced significant volatility in recent months. After reaching a local high of $7.64 in mid-April 2025, DOT has undergone a substantial correction, losing approximately 46% of its value. This analysis examines DOT's technical position and potential trajectory for the remainder of 2025.
Price Structure Analysis
The daily chart reveals DOT has been in a defined downtrend since April 2025, characterized by a series of lower highs and lower lows. Most recently, price has established a trading range between $3.90-$4.30, suggesting potential stabilization after the steep decline. This consolidation zone represents a critical juncture for DOT's next directional move.
Key observations from the price structure:
Descending Channel Formation: DOT has been trading within a descending channel since April, with the upper boundary currently around $4.50 and lower boundary near $3.80.
Support Cluster: Multiple support tests in the $3.90-$4.00 region have held thus far, potentially forming a base for a recovery attempt.
Volume Profile: Trading volume has been notably higher during recent consolidation compared to previous months, suggesting increased interest at these price levels.
RSI Analysis: Signs of Potential Reversal
The Relative Strength Index (RSI) provides compelling evidence for a potential trend shift:
Bullish Divergence: While price made lower lows in late June and early July, the RSI formed higher lows, creating a bullish divergence pattern that often precedes reversals.
Oversold Recovery: The RSI reached oversold territory (below 30) in mid-June and has since recovered to the 40-45 range, indicating diminishing selling pressure.
RSI-based MA Crossover: The RSI has recently crossed above its moving average, a signal that has historically preceded price recoveries for DOT.
The 4-hour chart shows the RSI establishing a series of higher lows while price consolidates, suggesting building momentum beneath the surface despite sideways price action.
Support/Resistance Level Analysis
Critical price levels that will influence DOT's next directional move:
Support Zones:
Primary: $3.90-$4.00 (current consolidation floor)
Secondary: $3.60-$3.70 (previous support from May)
Tertiary: $3.30-$3.40 (major support from early 2025)
Resistance Zones:
Immediate: $4.30-$4.50 (upper boundary of current consolidation)
Major: $4.80-$5.00 (previous support turned resistance)
Structural: $5.70-$6.00 (descending trendline from April high)
Volume Analysis
Volume patterns provide additional context for DOT's current position:
Declining Sell Volume: Selling volume has progressively decreased during the recent consolidation phase, suggesting exhaustion of selling pressure.
Volume Spikes on Bounces: Recent upward price movements have been accompanied by above-average volume, indicating potential accumulation.
Volume Contraction: The overall contraction in trading volume during the recent range-bound price action typically precedes significant moves.
Market Structure Analysis
Examining DOT's market structure reveals several important patterns:
Potential Inverse Head & Shoulders: The recent price action is forming what could develop into an inverse head and shoulders pattern, with the neckline around $4.50. Completion of this pattern would project a move toward $5.20-$5.40.
Wyckoff Accumulation: The price action since mid-June displays characteristics consistent with Wyckoff accumulation, including:
Spring phase (drop to $3.59 in late June)
Test phase (retest of lows in early July)
Sign of strength (move toward $4.20 on increased volume)
Compression Pattern: Price volatility has been decreasing, forming a compression pattern that typically resolves in a strong directional move.
Moving Average Analysis
Moving averages confirm DOT's bearish positioning but show early signs of potential trend change:
Below Key MAs: DOT remains below all major moving averages (50, 100, and 200-day), confirming the bearish trend.
MA Compression: The gap between shorter and longer-term moving averages is narrowing, often a precursor to trend shifts.
RSI-based MA Crossover: While price MAs remain bearish, the RSI-based moving average has turned upward, often an early indicator of trend reversal.
Fibonacci Retracement Analysis
Using the move from the April high ($7.64) to the June low ($3.59):
23.6% Retracement: $4.54 (immediate target on breakout)
38.2% Retracement: $5.13 (medium-term target)
50% Retracement: $5.62 (significant resistance level)
61.8% Retracement: $6.10 (major resistance level)
The current price action suggests DOT is attempting to establish a base before potentially targeting these retracement levels.
Scenario Analysis
Bullish Scenario
If DOT can decisively break above the $4.50 resistance level with increased volume:
Initial Target: $4.80-$5.00 (previous support turned resistance)
Secondary Target: $5.50-$5.70 (50% retracement level)
Extended Target: $6.00-$6.30 (61.8% retracement and structural resistance)
Catalysts: Successful parachain upgrades, increased developer activity, or broader crypto market recovery could drive this scenario.
Bearish Scenario
If DOT breaks below the $3.90 support level:
Initial Target: $3.60-$3.70 (previous support)
Secondary Target: $3.30-$3.40 (major support level)
Extended Target: $3.00 (psychological support)
Catalysts: Continued weakness in the broader crypto market, technical issues with the Polkadot network, or regulatory concerns could trigger this scenario.
Most Probable Scenario
Based on the weight of technical evidence, the most probable scenario appears to be:
Continued consolidation between $3.90-$4.50 for the next 1-2 weeks
Eventual breakout above $4.50 targeting the $5.00 level
Establishment of a new trading range between $4.50-$5.50 through August-September
This scenario is supported by the bullish divergences, decreasing selling volume, and early signs of accumulation.
Trading Strategy Recommendations
For Long-Term Investors
Accumulation Strategy: Consider dollar-cost averaging in the current $3.90-$4.20 range
Position Sizing: Maintain appropriate position sizing given DOT's high volatility
Key Levels: Use the $3.60 level as a stop-loss for new positions
For Active Traders
Range-Bound Strategy: Trade the current range between $3.90-$4.30 until a breakout occurs
Breakout Strategy: Enter on confirmation of breakout above $4.50 with targets at $4.80, $5.20, and $5.70
Risk Management: Maintain tight stops below $4.30 on breakout trades to protect against false breakouts
For Risk-Averse Investors
Confirmation Approach: Wait for confirmation of trend reversal (price above $4.80 and 50-day MA)
Partial Position: Consider establishing partial positions at current levels with defined risk parameters
Technical Triggers: Look for RSI moves above 60 as confirmation of momentum shift
Conclusion: Cautious Optimism for DOT
The technical picture for Polkadot suggests we may be approaching an inflection point after the substantial correction from April highs. Multiple technical indicators point to diminishing selling pressure and early signs of accumulation, creating the conditions for a potential recovery.
While DOT remains in a technical downtrend, the convergence of bullish divergences, volume patterns, and market structure suggests the potential for a trend reversal in the coming weeks. The $4.50 level represents the key technical hurdle that must be overcome to confirm this shift.
For investors and traders, a balanced approach is warranted—acknowledging the current bearish trend while positioning for a potential reversal. The risk-reward profile appears increasingly favorable for cautious accumulation at current levels, with clearly defined risk parameters.
The most probable path forward appears to be continued consolidation followed by a gradual recovery toward the $5.00-$5.50 range by late Q3 2025, contingent upon broader market conditions and continued development progress within the Polkadot ecosystem.
Fundamental Analysis
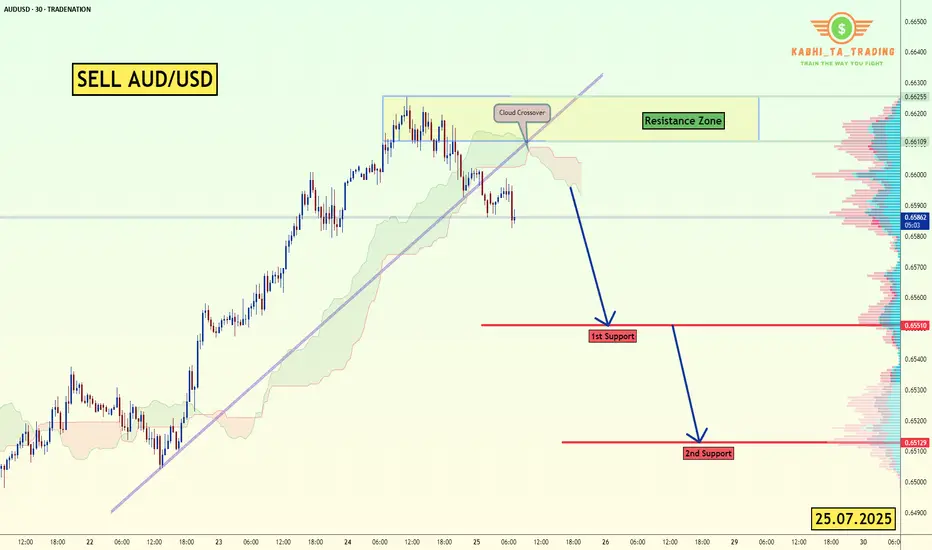
AUD/USD - Breakout (25.07.2025)The AUD/USD Pair on the M30 timeframe presents a Potential Selling Opportunity due to a recent Formation of a Trendline Pattern. This suggests a shift in momentum towards the downside in the coming hours.
Possible Short Trade:
Entry: Consider Entering A Short Position around Trendline Of The Pattern.
Target Levels:
1st Support – 0.6551
2nd Support – 0.6513
🎁 Please hit the like button and
🎁 Leave a comment to support for My Post !
Your likes and comments are incredibly motivating and will encourage me to share more analysis with you.
Best Regards, KABHI_TA_TRADING
Thank you.
Disclosure: I am part of Trade Nation's Influencer program and receive a monthly fee for using their TradingView charts in my analysis.
USDJPY (weekly Analysis) 26/07Hi everyone the weekly analysis is now up. hope everyone has a great weekend and as always happy trading.

07/25/25 Trade Journal, and ES_F Stock Market analysis
EOD accountability report: +228
Sleep: 5 hours
Overall health: Still struggling to catch up on sleep. gonna take gg sleeping pills today
** VX Algo System Signals from (9:30am to 2pm) **
— 9:07 AMMarket Structure flipped bearish on VX Algo X3! :white_check_mark:
— 9:53 AM Market Structure flipped bullish on VX Algo X3! :white_check_mark:
— 10:30 AM Market Structure flipped bullish on VX Algo X3! :white_check_mark:
— 11:00 AM VXAlgo ES X1 Sell Signal :x:
**What’s are some news or takeaway from today? and What major news or event impacted the market today? **
Market structure algo was flipping a lot today, even in premarket, which tells me that MM was changing position a lot and things could be unreliable so i decided to end the trading day early at $200 and closed up shop on my main acccount.
**News**
*S&P 500 ENDS AT A NEW RECORD HIGH
**What are the critical support levels to watch?**
--> Above 6395= Bullish, Under 6372= Bearish
Video Recaps -->https://tradingview.sweetlogin.com/u/WallSt007/#published-charts

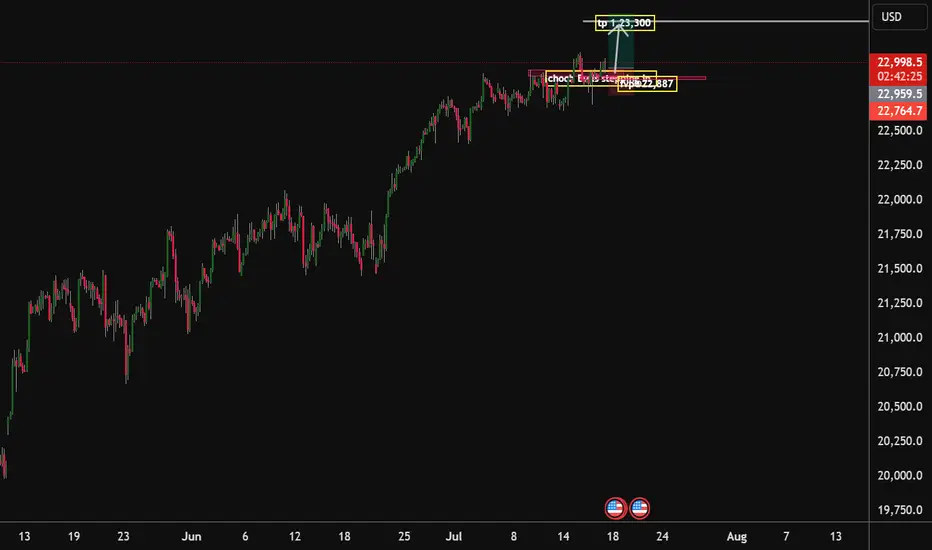
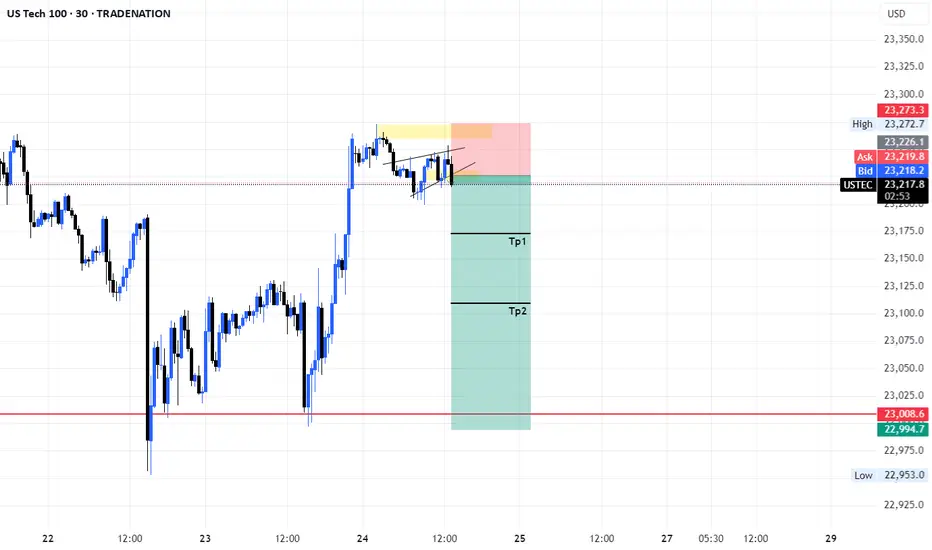
Nasdaq100 Bulls ready to drive the price to 23,300 handle With the choch on the market structure and with Key data released on Thursday, reflected strength in the U.S. economy. Stocks rose this Thursday, buoyed by fresh economic data reports and a slew of corporate earnings releases. The tech-heavy Nasdaq Composite has advanced 0.4%, and quarterly earnings reports released this week have exceeded Wall Street’s expectations, fueling investor confidence. I am expecting that by the end of this week or the beginning of next week will see the bulls drive the market to our 23,300 handle. I am with the bulls on this one
Tp1.23,300.
Eur/Gbp Bears to seek the 0.86180 Handle By early next week, my analysis according to the market structure being formed suggests that the institution that drives the market will have to be dovish on this pair, as there is unmitigated liquidity awaiting to be grabbed @ the 0.86100 zone by the end of next week will have to see that zone being mitigated
Tp 1.0.86180

A slight pullback to around 112,000 is expected before a bullishThere is a double top on the daily timeframe. It could pull back to the previous support level that I mentioned in the chart. Moreover, there is a healthy trendline support that can help BTC price bounce.

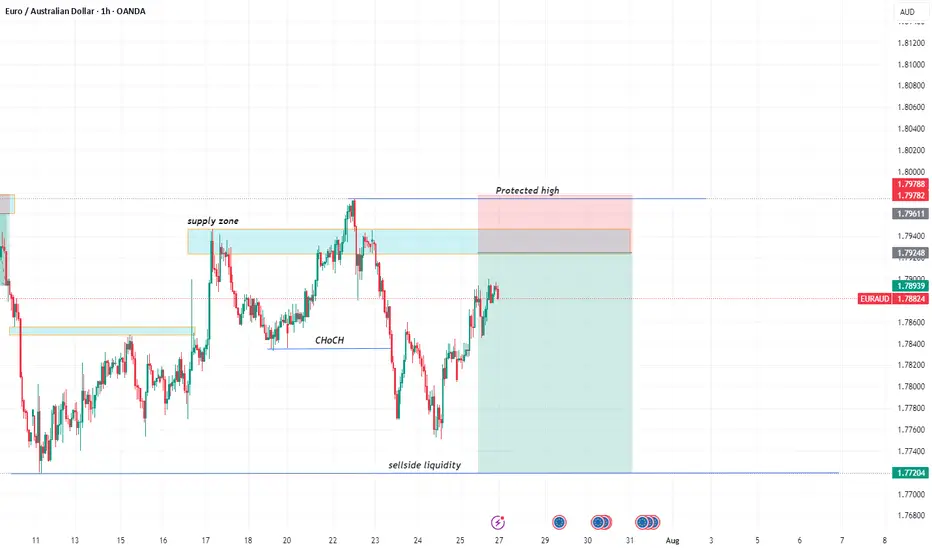
EURAUD SELL!!!targeting a supply zone on the 4hr time frame
Entry : 1.79248
TP : 1.77204
SL : 1.79788
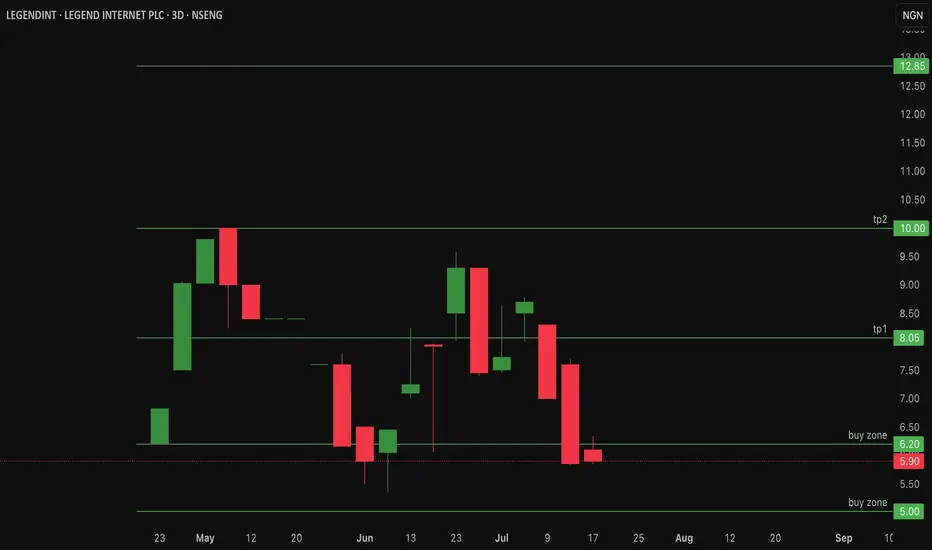
$legendint Could LegendInt be undervalued? - 40% RetracementLegend Internet Plc on the Nigerian Stock Exchange (NGX) was listed on April 24, 2025, under ticker LEGENDINT. The company offers fiber-to-the-home (FTTH) services in Abuja and digital products like LegendMail and MailPay.
IPO price: ₦5.64 per share, closed first trading day at ₦6.20. Previously NSENG:LEGENDINT has reached an all time high of 10naira/share and has currently retraced over 40%
Current price: 5.90
As a newly listed small-cap, it faces low visibility and high volatility, contributing to weak investor demand and price devaluation. It would be interesting to see what the future holds for #legendint.
Upside resistance at 8naira and 10naira per share
Buy zone range is between 5 -6.2naira/share
Price action looks like an inverse cup and handle pattern - Not a bullish pattern!
Invalidation for this Legend Idea is under 5naira per share!
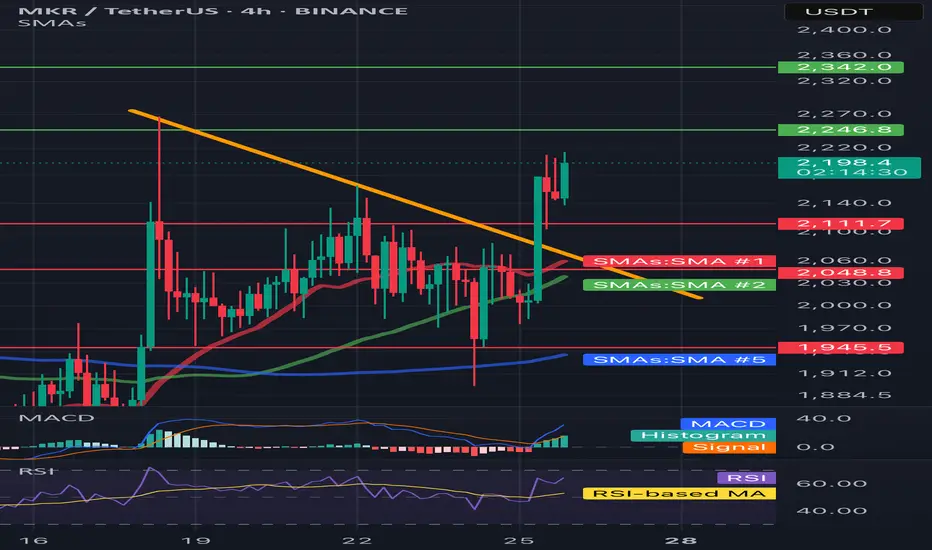
MKR/USDT 4H📈 Trend and price structure
• The price has just been above the downward trend line (yellow line), which suggests the potential reversal of the trend to the upward.
• Breaking was strong - a candle with a large growth volume and an increase +9.13%, which emphasizes the pressure of buyers.
⸻
🔍 levels of support and resistance
• resistance:
• ~ 2342 USDT - a clear level of resistance (green line) - may be the target for the next upward movement.
• 2246.8 USDT - first resistance to overcome.
• Support:
• 2111.7 USDT - level of local support after struggling (earlier resistance).
• 2048.8 USDT - SMA #1 (red medium), can be support at the back.
• 1945.5 USDT - strong support in the form of long -term SMA (blue line, SMA #5).
⸻
📊 Technical indicators
✅ MacD (below)
• The MacD line cut the signal line up - buy signal.
• The histogram is growing, which confirms the growth moment.
✅ RSI
• RSI has bounced from level 40 and is currently above 60 - it suggests upward momentum, but it is not yet purchased, so there may be room for further growth.
⸻
✅ Medium walking (SMAS)
• The price was pierced by SMA #1 (red) and SMA #2 (green) with impetus, which means a change in sentiment.
• If it stays above these medium - a bull signal.
• SMA 50 (green)> SMA 200 (blue) = potentially a golden cross is formed on a longer TF.
⸻
📌 Summary - technical scenario:
🐂 Bycza scenario:
• If the price lasts above 2111.7 USDT, it may continue to increase to USDTt and further up to $ 2,342.
• Confirmation will be the continuation of growth on MacD and RSI over 60-70.
🐻 Bear scenario (threats):
• If the price drops below 2048 USDT, possible correction up to 1945 USDT.
• RSI returning below 50 and Macd Cross down would be a reversal signal.
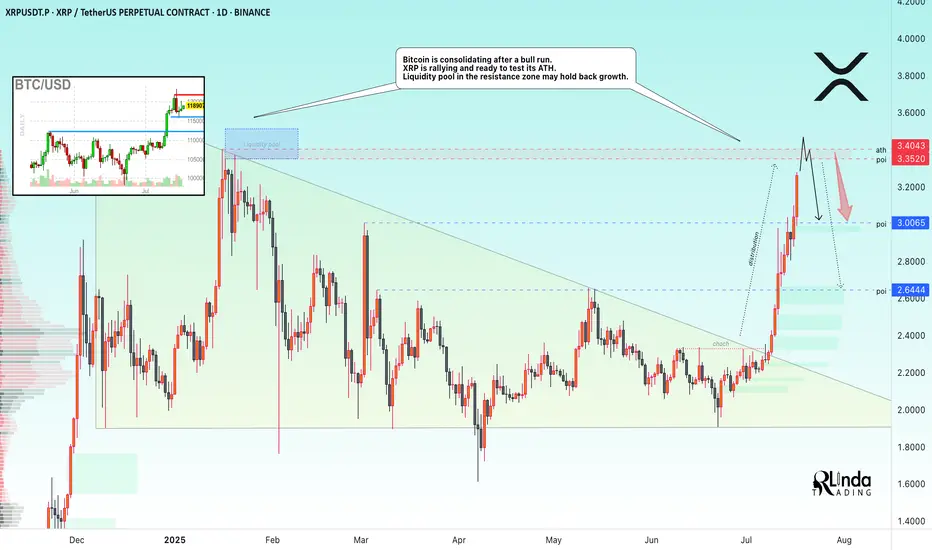
XRP → ATH retest. Reversal or continued growth?BINANCE:XRPUSDT.P is rallying and ready to test the resistance zone - ATH. Against this backdrop, Bitcoin is consolidating after a bull run. The liquidity pool may hold back growth.
Fundamentally, there is excitement across the entire cryptocurrency market. Altcoins are rallying after Bitcoin hit a new high and entered consolidation. The BTC.D index is declining, which generally provides a good opportunity for altcoins to grow. However, the index is approaching technical support, which may affect market sentiment overall...
As for XRP, there is a fairly strong liquidity pool ahead — the ATH resistance zone. The price is in a distribution phase after a change in character and a breakout of the downtrend resistance in the 2.33 zone. The momentum may exhaust its potential to break through the 3.35-3.34 zone, and growth may be halted for correction or reversal (in correlation with Bitcoin's dominance in the market).
Resistance levels: 3.35-3.40
Support levels: 3.0, 2.64
A breakout of resistance without the possibility of further growth, a return of the price below the level (i.e., inside the global flat) will confirm the fact of a false breakout of resistance, which may trigger a correction or even a reversal.
Best regards, R. Linda!
2025 Is a Big Year for Bitcoin Miners—Who’s Winning the Hash War
Bitcoin’s resurgence in 2025 has reignited the mining race. The halving came and went, hashprice bounced from the abyss, and a fresh wave of capital is pouring into the space. So we figured: time to catch you up on who’s making real moves and pulling ahead — both in market cap and megawatts.
⚡ CleanSpark (CLSK): The Sharpshooter
If Bitcoin mining were a sport, CleanSpark would be the athlete that trains all year, eats clean, and shows up for every match. No drama, just execution.
In 2025, CleanSpark continues to grow fast — but smart. It’s acquiring distressed sites, upgrading facilities with immersion cooling, and pushing its fleet beyond 50 EH/s. Its Tennessee expansion (a deal scooped up for pennies on the dollar) was classic CLSK: low cost, renewable-powered, and ready to scale.
In Q1 2025, CleanSpark posted $162.3 million in revenue, up a blistering +120% YoY, and delivered $246.8 million in net income, or $0.85 per share. It's one of the few miners that’s profitable and expanding — at the same time.
The stock is up 25–30% YTD, trading around $12. While it’s been volatile like the rest of the sector, CLSK remains the benchmark for cost-effective, execution-focused Bitcoin mining. If you’re looking for a fundamentals-backed growth story, this is it.
🏗️ Iris Energy (IREN): The AI-Ready Dark Horse
Iris Energy may have flown under the radar in past cycles, but in 2025 it’s turning heads — not just because of Bitcoin, but because of data infrastructure.
While IREN runs a lean BTC mining operation powered by 100% renewable energy in Australia and Canada, the real story is its pivot toward modular data centers. It’s one of the few miners actively positioning itself for GPU workloads and AI compute as a hedge against mining volatility.
The upside? Flexibility. If BTC mining margins compress again, IREN has the facilities and roadmap to reconfigure its power-hungry machines for AI hosting. The market likes the optionality. The stock’s up ~70% this year and may still be cheap if the data center thesis catches on.
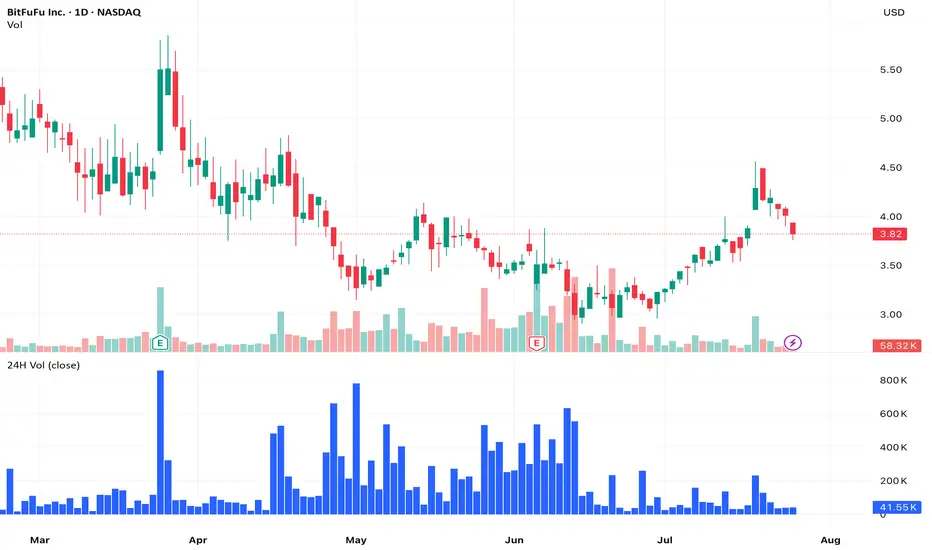
🔥 BitFuFu (FUFU): The Challenger
BitFuFu came in hot after its 2024 IPO — vertically integrated, Bitmain-backed, and global from day one. It’s the largest cloud mining provider in the mining space. It provides cloud mining, sells miners, hosts them, runs its own mining pool (BitFuFuPool), and operates a global fleet clocking over 36 EH/s under management.
While others focused on HPC & AI business, BitFuFu doubled down on mining scale and infrastructure. It aims to own over 1 GW of power capacity and launched its own mining operating system.
The post-halving reality has been rough. Q1 2025 revenue came in at $78 million, down 46% YoY, with self-mining revenue dropping 70.7%. But the company has a track record of being profitable every year since founded, plus its P/S is only 1.6, well below other mining giants such as Mara and Riot.
Watch this one. Especially if BTC pushes above $150K.
🐋 Marathon Digital (MARA): The Goliath, Still Standing
Marathon is the largest public miner by market cap — and has been the face of institutional mining exposure for years. It’s also the most debated name in the game.
On one hand, MARA controls a monster fleet with over 75 EH/s expected by year-end, global mining operations from the U.S. to the UAE, and a budding software business for managing hashrate.
On the other, critics argue it’s bloated, overly reliant on third-party infrastructure, and too slow to pivot in a fast-moving landscape.
Still, when Bitcoin’s hot, Marathon runs. The company holds a large BTC treasury of over 50,000 BTC, is adding immersion-cooled sites, and remains a proxy trade for many traditional investors wanting in on mining without picking niche plays.
Love it or hate it, MARA isn’t going anywhere. And if BTC moons in Q4, it’ll be one of the first tickers to feel the heat.
🧊 Cipher Mining (CIFR): The Quiet Killer
Cipher isn’t flashy. It doesn’t dominate headlines or make bold predictions. What it does do: mine Bitcoin efficiently, at low cost, with minimal dilution and maximum discipline.
Based in Texas, CIFR locked in long-term power contracts at enviably low rates and steadily grew its fleet past 13.5 EH/s. It has some of the best cost-per-BTC metrics in the industry and avoids unnecessary spending or debt.The Texas-based miner produced 602 BTC in Q1, and benefits from low power contracts and disciplined growth.
The market loves it: CIFR is up ~35% YTD, trading at $6.52. It’s becoming a favorite among investors who want hash exposure with less volatility and more transparency. The monthly production updates are clear, consistent, and confidence-building.
👀 Trends to Watch in H2 2025
1. Hashprice Rollercoaster: Hashprice (BTC earned per TH/s per day) has bounced from $39 post-halving lows to nearly $60. If BTC rallies again, miners with fixed-cost power will reap the upside.
2. GPU Hosting Pivot: With AI demand surging, some miners are repurposing infrastructure to host GPUs — think IREN.
3. M&A Season: Expect smaller players with weak cash flow to get scooped up.
4. Regulatory Shifts: Crypto Week laws passed in the U.S. provide more clarity. But ESG pressure and power usage scrutiny will remain part of the narrative.
💭 Final Thought
Bitcoin mining stocks aren’t just about Bitcoin anymore.
They’re about infrastructure. Data. Energy. Efficiency. Optionality. And in 2025, the winners will be those who can balance raw hashpower with strategic foresight.
Whether you’re team CLSK, FUFU, IREN, MARA, or CIFR — the landscape is shifting fast. And with BTC momentum building again, this might just be the beginning.
So — which miner are you backing this cycle?
GOLD could test 3375 before falling furtherGOLD could test 3375 before falling further
In our previous analysis, we were looking for gold to fall from the top and, as we can see, it has already reached 3341 from the 3430 area.
From the top down, the price depreciated by 2.85% in less than 3 days, so a possible correction is expected near the area of the structure coming from the left side around 3375.
Given that gold is only moving down, it may be possible for the downward movement to continue slowly. Both scenarios are possible at this point.
You may find more details in the chart!
Thank you and Good Luck!
PS: Please support with a like or comment if you find this analysis useful for your trading day

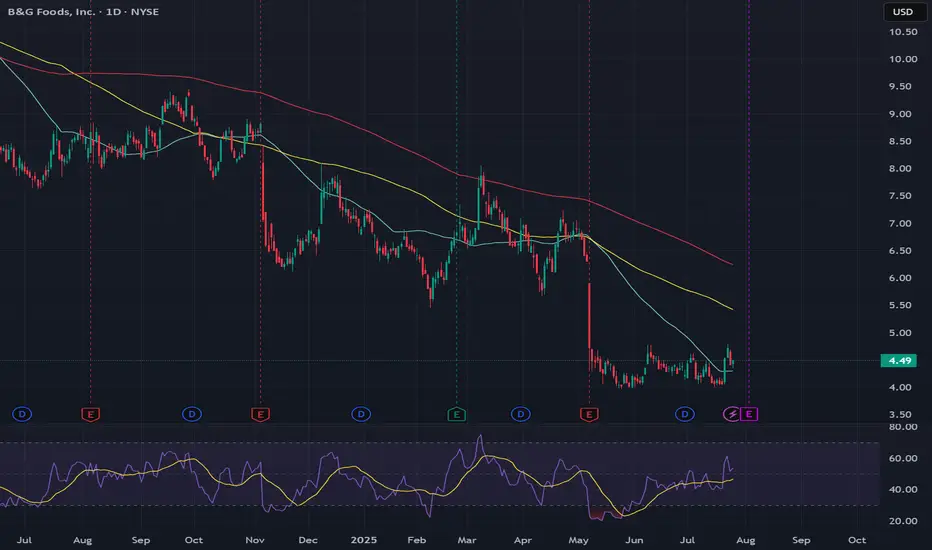
Tarriff help BGS has built a base at $4. U.S. tariffs = pricier Mexican imports. U.S. producers may gain
less competition, ability to raise prices, potential for better margins and more demand from buyers shifting away from imports. Call flow has seen some interest recently with a 20.47 short float I added JAN 5C at .40. Overall, insiders bought 219,570 shares for $1.7 million and sold 8,000 shares for $67,000 in the last 12 months, indicating net buying activity. These transactions reflect confidence from insiders, particularly Sherrill, whose purchases were significant and pre-arranged under Rule 10b5-1 plans
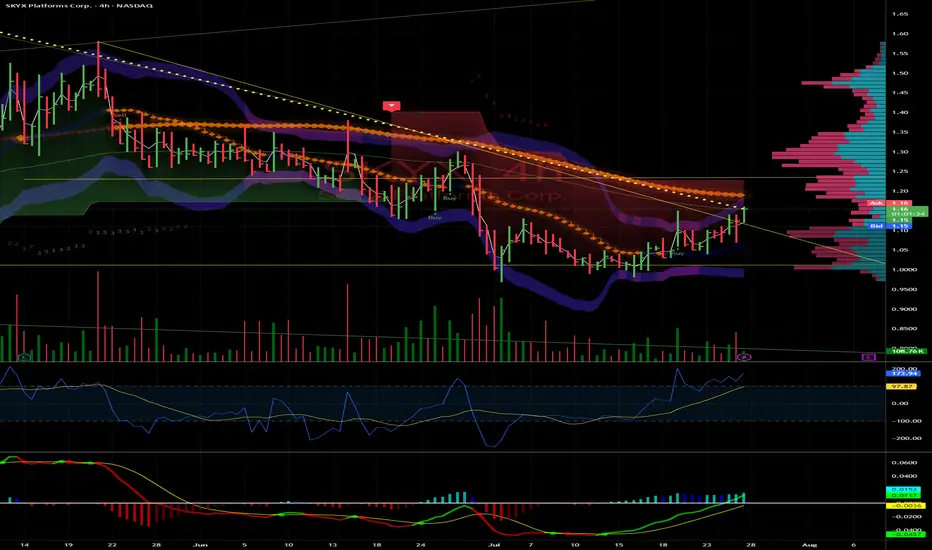
SKYX: Breakout to $1.58 and Potential Triple on Small-Cap Surge
SKYX Platforms Corp. (NASDAQ: SKYX) is primed for a run to $1.58 and could triple to $3.30 by year-end, driven by small-cap strength, e-commerce demand, and strong fundamentals. Here’s why SKYX is a must-watch.
Technicals: Clear Shot to $1.58
Trading at $1.10 , SKYX is coiling for a breakout. Resistance at $1.25 (psychological) and $1.40 (prior high) should fall easily with rising volume and a bullish MACD crossover. $1.58 is achievable by August, with $3.30 (200%+ gain) in sight if momentum holds.
Fundamentals: Smart Home Leader
With 97 patents and 60+ e-commerce websites, SKYX’s plug-and-play smart home platform is gaining traction. Their $3B Miami smart city deal (500,000+ units) and Profab Electronics partnership signal scalability . E-commerce sales, projected to hit $8T globally by 2027 , fuel SKYX’s growth.
Market Tailwind
The Russell 2000, which SKYX joined in June 2025, is breaking out, up 10% YTD . TNA’s 30% spikes amplify this . With a $138.61M market cap and 38 institutions adding shares (e.g., Susquehanna, 478,024 shares) , SKYX is set to ride this wave.
Risks
SKYX isn’t cash flow positive until H2 2025, and Q1 revenue missed ($20.1M vs. $21.15M). Small-cap volatility is a factor, but 12.4% YOY growth and the Russell breakout mitigate risks.The Play
SKYX hits $1.58 soon, clearing $1.25 and $1.40, then triples to $3.30+ by December on e-commerce, smart city deals, and small-cap momentum. I’m buying—thoughts, board?
Summary: Targets: $1.58 near-term, $3.30+ year-end.
Resistances: $1.25, $1.40.
Catalysts: Russell 2000/TNA breakout, e-commerce, smart city deal.
Risks: Cash flow, revenue misses, volatility.
Disclaimer: Not financial advice. Do your own DD. Stocks are volatile.
~Sherwood Coast's Group
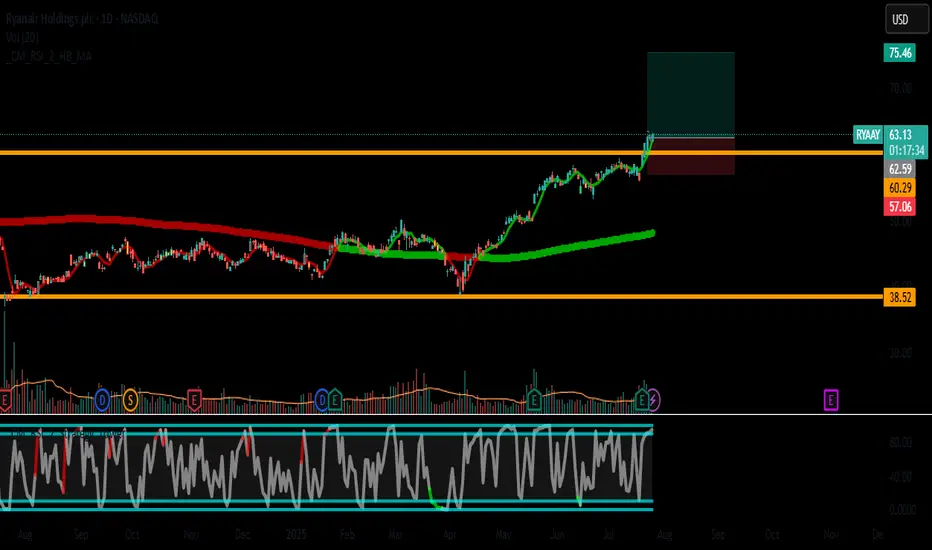
RYAAY (Ryanair Holdings) - Bullish Reversal Play🚀 Trade Idea: RYAAY (Ryanair Holdings) - Bullish Reversal Play
Entry: $63.00 | Stop Loss: $57.00 | Take Profit: $75.50
Risk/Reward Ratio: ~1:2.5
📈 Technical Setup
Trend Structure:
Breaking out from a 3-month consolidation range ($57-$63)
Daily chart shows higher highs forming after basing pattern
20 EMA ($60.50) crossing above 50 EMA ($59.20)
Key Levels:
Support: $57.00 (swing low & psychological level)
Resistance: $63.00 (breakout level) → $75.50 (2024 highs)
Momentum Indicators:
RSI(14): 58 and rising (room to run before overbought)
MACD: Bullish crossover with histogram expanding
Volume: 20% above average on breakout
✈️ Fundamental Catalyst
✅ Strong Summer Travel Demand:
Record Q2 passenger numbers (18.7m, +12% YoY)
Fuel costs stabilizing while fares remain elevated
✅ Valuation Case:
Trading at 12x forward P/E (below 5-yr avg of 15x)
35% EPS growth projected for FY2025
✅ Sector Tailwinds:
Jet fuel prices down 18% from Q1 peaks
EU travel recovery accelerating
🎯 Trade Management
Entry Strategies:
Aggressive: $63.00 (breakout entry)
Conservative: $61.50 (pullback to breakout level)
Profit Targets:
T1: $68.00 (partial 50%)
T2: $75.50 (full position)
Stop Placement:
Hard stop: $57.00 (-9.5%)
Trailing stop: Move to $60 after $68 reached
⚠️ Risk Considerations
Monitor oil prices (key cost driver)
Watch EUR/USD (currency exposure)
Next earnings: August 29 (event risk)
Alternative Scenario:
If $63 holds as resistance, wait for deeper pullback to $60 support
📌 What's Your Take?
Like if you're bullish on airlines! Any other levels you're watching?
#Airlines #Breakout #RYAAY #TravelStocks
(Chart shows clean breakout with volume confirmation. Trade with proper risk management!)
📢 Disclaimer:
This post and the information contained herein are for educational and entertainment purposes only and should not be construed as financial advice, investment recommendations, or an offer to buy/sell securities. Trading stocks, options, and other financial instruments carries substantial risk of loss and is not suitable for all investors.
Do your own research (DYOR) before making any investment decisions.
Past performance is not indicative of future results.
The author may hold positions in mentioned securities at the time of writing.
Always consult a licensed financial advisor before making investment decisions.
By engaging with this content, you agree that you are solely responsible for your own trading decisions.
Trade at your own risk. 🚨
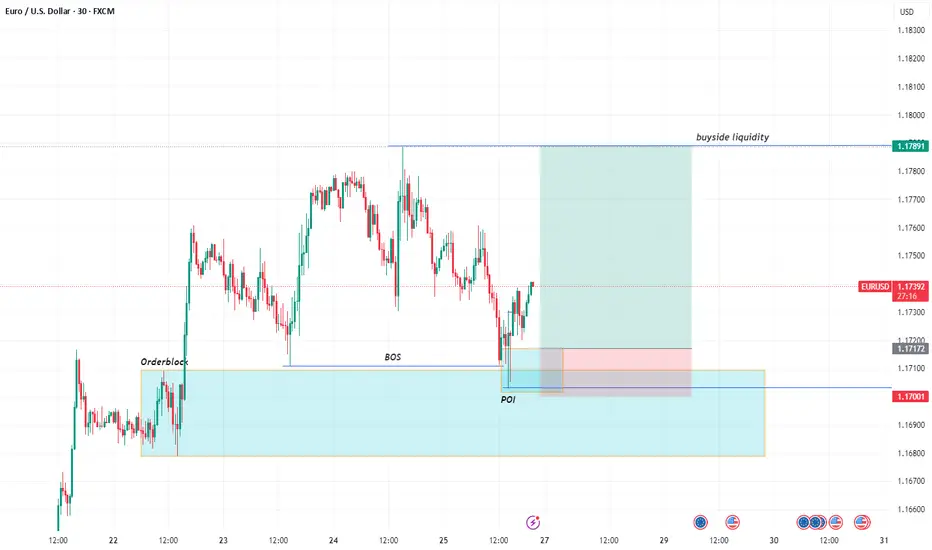
EURUSD BUYTapped into an orderblock on the 4hr time frame, so i scaled down to the 30mins to look for a buy entry
Entry : 1.17172
TP : 1.17891
SL : 1.17001
SOL LONGSolana is bouncing off the support level and the ascending trendline. Bullish movement is expected to continue and reach $205

Amazon Has a Mixed Technical Picture Heading Into EarningsNext week will see four of the "Magnificent Seven" stocks report quarterly earnings -- Apple NASDAQ:AAPL , Amazon NASDAQ:AMZN , Microsoft NASDAQ:MSFT and Meta Platforms NASDAQ:META . Let's check out AMZN ahead of its results.
Amazon's Fundamental Analysis
FactSet recently reported analysts' consensus view calls for S&P 500 companies to see 9.3% earnings growth for 2025 as a whole, of 9.3%, up from 9% in 2024.
But very interestingly, FactSet also said that earnings growth across the "Magnificent Seven" is projected at 14.1% year over year for just Q2 alone.
By contrast, analysts project just 3.4% y/y earnings gains for the S&P 500's other "Less Than Magnificent 493." That illustrates the Mag-7's impact on the broader market.
As for Amazon, analysts estimate that the e-commerce giant will see $1.32 in Q2 GAAP earnings per share on roughly $162 billion of revenue.
This would represent 4.8% y/y growth from Q2 2024's $1.26 in GAAP EPS, as well as a 9.5% y/y gain from the approximately $148 billion in revenues that AMZN saw in the same period last year.
This has become the norm for Amazon, as revenue growth has landed between 9% and 11% for each of the past four quarters (and is projected to print within that range for the next four quarters as well).
But significantly, of the 34 sell-side analysts that I can find that track AMZN, 27 have reduced their Q2 earnings estimates for the firm since the current quarter began. (The other seven swam upstream and actually boosted their forecasts.)
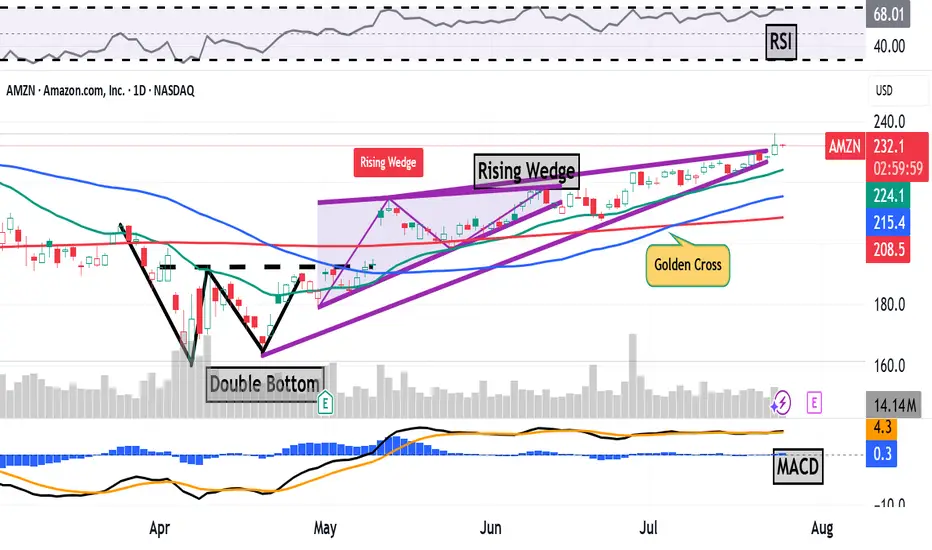
Amazon's Technical Analysis
Next, let's look at AMZN's chart going back some six months and running through Tuesday afternoon:
This is an interesting chart, with both positive and negative technical signals.
On the positive side, the stock saw a "double-bottom" pattern of bullish reversal that spanned the month of April, with a $193 pivot (marked "Double Bottom" at the above chart's left).
That produced an upside breakout that appeared to accelerate, with a "golden cross" occurring on July 7 (marked at the chart's right).
A golden cross is generally seen as a bullish technical pattern that occurs when a stock's 50-day Simple Moving Average (or "SMA," denoted with a blue line in the chart) crosses above a rising 200-day SMA (the red line).
There's a catch, though.
While breaking out higher in the chart above, AMZN appeared to develop a "rising-wedge" pattern of bearish reversal, marked with purple diagonal lines in the chart above.
Readers will note that this pattern actually began at the nadir of the double bottom's second bottom in late April. The rising wedge's upper trendline then kicked in on May 13, but the pattern's two lines appear to be closing.
When a wedge closes after two to three touches on each trendline (which we have here), the resultant move can be explosive.
However, it's not necessarily clear which way a stock will move from there -- up or down. A true closing pennant can explode violently in either direction, but as noted above, what we're seeing with Amazon is a pattern of bearish reversal.
This does give me pause about AMZN and makes me more cautious than I might otherwise be about getting involved with the stock ahead of earnings. (I don't currently own any AMZN shares.)
Meanwhile, Amazon's Relative Strength Index (the gray line at the chart's top) looks strong, but nowhere near being technically overbought.
That said, the stock's daily Moving Average Convergence Divergence indicator (or "MACD," marked with black and gold lines and blue bars at the chart's bottom) isn't telling us much at all.
The histogram of Amazon's 9-day Exponential Moving Average (or "EMA," marked with blue bars) is flat-lining right around the zero bound, while the 12-day EMA (black line) is running in line with the 26-day EMA (gold line).
While both lines are running above zero, it matters greatly which one ends up on top. For the short to medium term, the bulls will be rooting for the black line, while the bears will be hoping that the gold line can wind up on top.
(Moomoo Technologies Inc. Markets Commentator Stephen “Sarge” Guilfoyle had no position in AMZN at the time of writing this column.)
This article discusses technical analysis, other approaches, including fundamental analysis, may offer very different views. The examples provided are for illustrative purposes only and are not intended to be reflective of the results you can expect to achieve. Specific security charts used are for illustrative purposes only and are not a recommendation, offer to sell, or a solicitation of an offer to buy any security. Past investment performance does not indicate or guarantee future success. Returns will vary, and all investments carry risks, including loss of principal. This content is also not a research report and is not intended to serve as the basis for any investment decision. The information contained in this article does not purport to be a complete description of the securities, markets, or developments referred to in this material. Moomoo and its affiliates make no representation or warranty as to the article's adequacy, completeness, accuracy or timeliness for any particular purpose of the above content. Furthermore, there is no guarantee that any statements, estimates, price targets, opinions or forecasts provided herein will prove to be correct.
Moomoo is a financial information and trading app offered by Moomoo Technologies Inc. In the U.S., investment products and services on Moomoo are offered by Moomoo Financial Inc., Member FINRA/SIPC.
TradingView is an independent third party not affiliated with Moomoo Financial Inc., Moomoo Technologies Inc., or its affiliates. Moomoo Financial Inc. and its affiliates do not endorse, represent or warrant the completeness and accuracy of the data and information available on the TradingView platform and are not responsible for any services provided by the third-party platform.
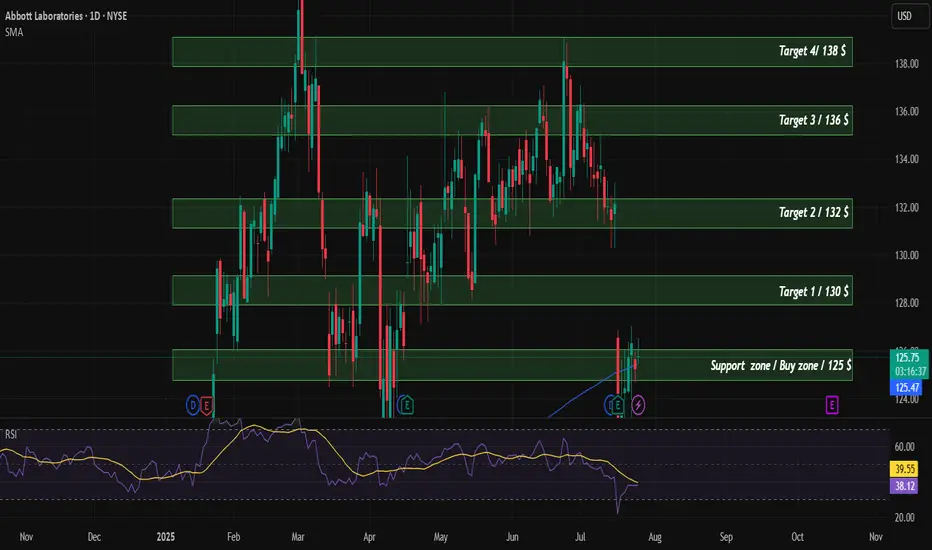
ABT Buy/LongTechnical analysis of the company. According to financial indicators, the company is currently undervalued and is supported by SMA200. The target price for the company is $142.
XRPUSD - Target reached. Reversal on the plateSo, that was a nice long trade.
Now price is stretched at the Upper Medianline Parallel (U-MLH).
As of the time of writing, I already see price pulling back into the Fork. A open and close within the Fork would indicate a potential push to the south.
Target would be the Centerline, as it is the level where natural Meanreversion is.
Observation Hat ON! §8-)

Us100 short position 24/07/2025English : According to our analysis, we anticipate a bearish scenario.
Morocan Darija : kanchofo d'apres l'analyse dyalna antsanaw hboot
ATENTION : I only share my ideas, not signals
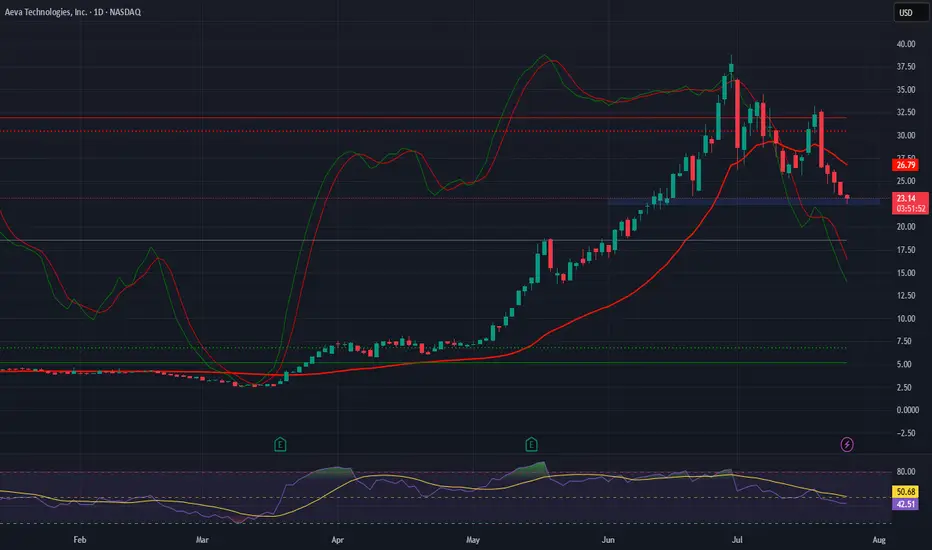
Aeva Technologies (AEVA) – Pioneering Next-Gen LiDAR Company Snapshot:
Aeva NASDAQ:AEVA is revolutionizing perception systems with 4D FMCW LiDAR—offering instant velocity detection, high precision, and long-range sensing, setting a new standard for autonomous systems.
Key Catalysts:
Breakthrough Technology
AEVA’s proprietary 4D Frequency Modulated Continuous Wave (FMCW) LiDAR provides real-time velocity and depth data, outperforming traditional Time-of-Flight systems in accuracy and safety.
Automotive OEM Traction 🚗
Strategic collaborations are translating into production-stage contracts, marking a key inflection from R&D to scalable revenue generation.
Multi-Sector Expansion 🌐
AEVA’s sensing tech is penetrating robotics, aerospace, and industrial automation, significantly broadening its TAM and diversifying revenue streams.
Government & Aerospace Validation
Recent contract wins with defense and aerospace clients underscore AEVA’s technological credibility and commercial viability.
Investment Outlook:
Bullish Entry Zone: Above $22.50–$23.00
Upside Target: $39.00–$40.00, supported by production scaling, cross-sector adoption, and deep-tech differentiation.
⚙️ AEVA stands at the forefront of smart sensing innovation with strong momentum into high-growth verticals.
#AEVA #LiDAR #AutonomousVehicles #Robotics #Aerospace #IndustrialTech #SensorRevolution #4DPerception #FMCW #TechStocks #Innovation #SmartMobility