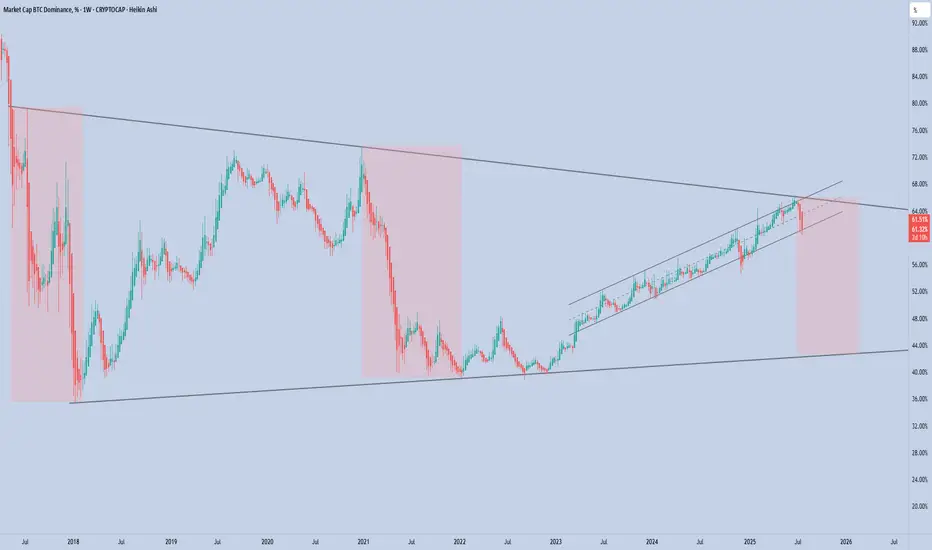
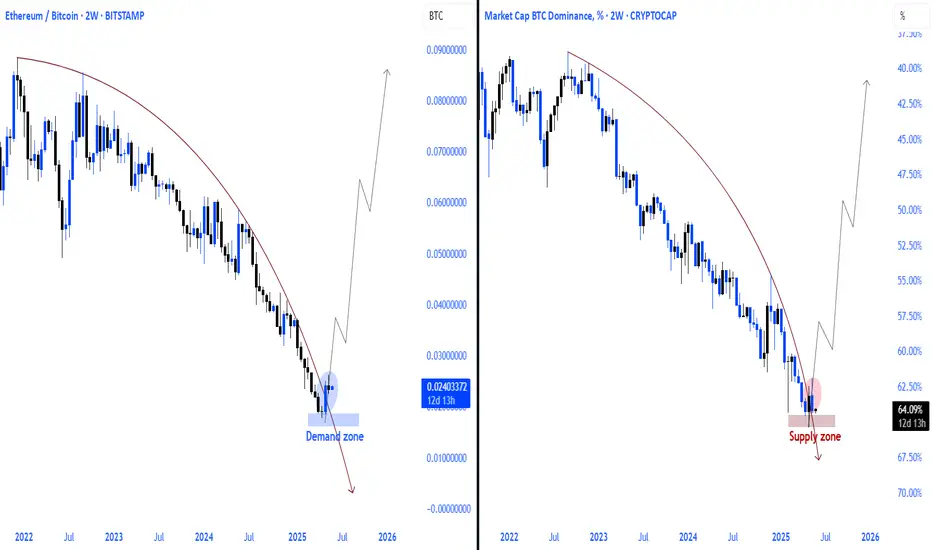
Bitcoin Dominance – Critical Breakdown on the Horizon
Bitcoin dominance is currently testing a major long-term resistance zone formed by the upper boundary of a multi-year wedge. After months of steady climb, the structure is now showing the first signs of exhaustion
If dominance loses the key 60% support zone, that would mark a major structural shift — historically followed by downtrends in dominance and strong capital rotation into altcoins.
Until dominance reclaims the upper trendline or regains bullish momentum, the risk-reward now favors altcoins. Momentum is shifting. Altseason might just be around the corner.
Fundamental Analysis
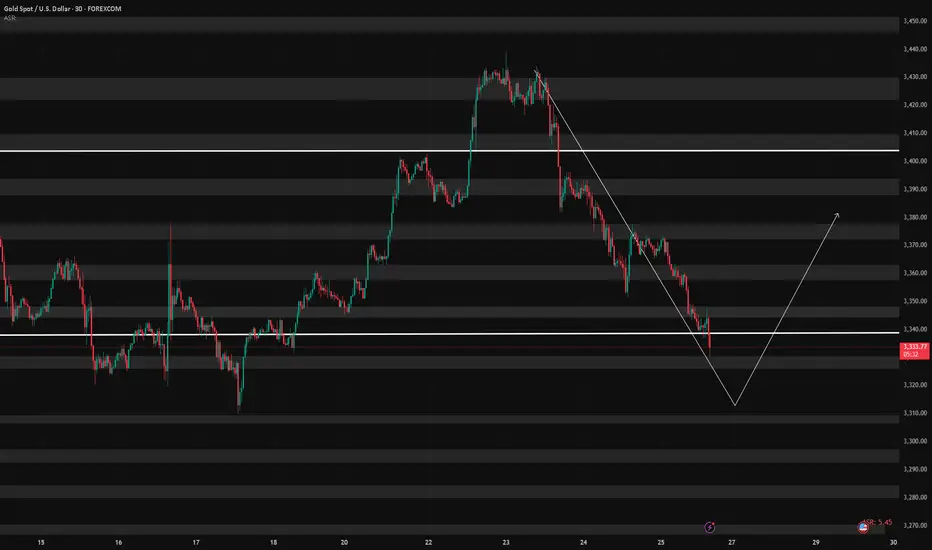
7/25: Key Levels to Watch Closely for Next Week's TradingGood evening, everyone!
Due to health reasons, I had to take a short break from updates — thank you all for your understanding and support.
This week, gold rallied to the 3440 level, forming a double-top pattern, and has since entered a phase of consolidation with a downward bias, currently retracing back to the key 3337-332 support area.
While a short-term rebound is possible from the 30-minute chart perspective, the weekly structure is not favorable to the bulls. On the daily chart, price has once again reached the MA60 support, and is currently forming three consecutive bearish candles, which suggests that bearish momentum may continue.
Unless there is significant bullish news next week, the market may remain under pressure. Key levels to monitor:
Upside resistance zones: 3343, 3352, 3358, 3366, 3372, 3378, and 3386–3392
Downside support zones: 3337, 3332, 3323, 3312
If the weekly chart breaks down, watch for: 3300 psychological level and 3260 (weekly MA20)
Additionally, during this week's decline, a price gap has been left between 3395–3398. If the market starts to rebound on the 2-hour chart, there is a chance this gap will be filled. However, this area also serves as strong resistance, and any approach toward it could result in heavy selling pressure. Caution is advised in the event of a sharp rally.
I'm still recovering and unable to monitor the markets for extended periods. Once my health improves, I’ll resume regular updates. In the meantime, feel free to leave any questions, and I’ll do my best to respond. Thanks again for your continued support, and I wish everyone success and strong profits in the market!
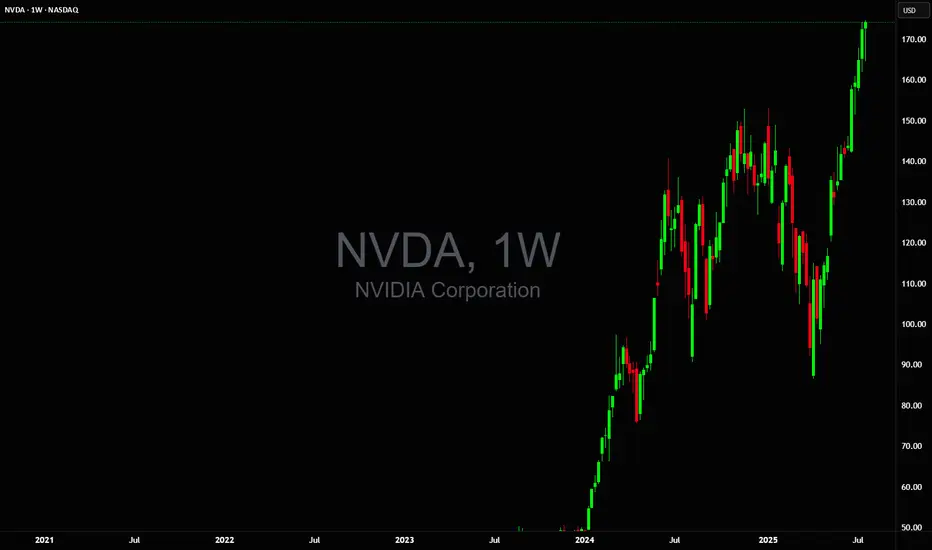
99% of people buying $NVDA don't understand this:🚨99% of people buying NASDAQ:NVDA don't understand this:
NASDAQ:GOOGL : “We’re boosting AI capex by $10B.”
Wall Street: “Cool, that’s like $1B or 0.06 per share for $NVDA.”
So from $170.50 at the time of news to $170.56 right?
No.
NASDAQ:NVDA trades at 98× earnings. So that $0.06? Turns into $6.00
Why?
Because people are expecting that to be happening every single year for 98 years and they're paying All of it Today in Full amount.
So NASDAQ:NVDA will get $1B more per year. But NASDAQ:NVDA price per share already increased by $100B in past 2 days 😂
Then it crashes 40% and everyone is wondering why.
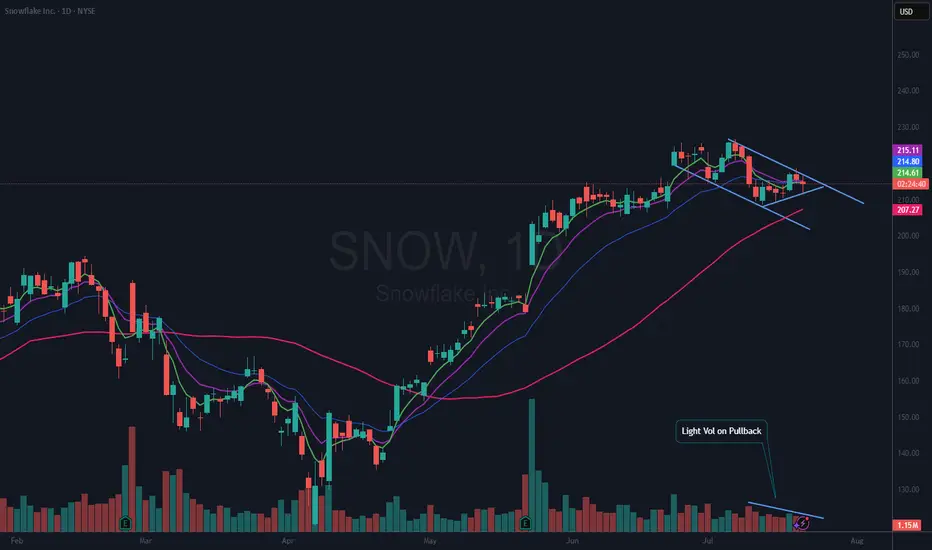
$SNOW Bull Flag?NYSE:SNOW has been and still may be one of the leaders in this market. It is forming a Bull Flag and within that flag is a nice wedging formation.
I am bullish with this name, so I have an alert set on the upper downtrend line. Should it break that, I will look for a good risk reward entry to open a position. It is possible if the market pulls back, that NYSE:SNOW could continue down to test the 50 DMA (red). All TBD.
If you like this idea, please make it your own and follow your trading plan. Remember, it is your money at risk.
In addition, Nvidia NASDAQ:NVDA and Snowflake NYSE:SNOW were among the investors that backed artificial intelligence company Reka's $110 million funding round, Reka said Tuesday.
Reka said the investment will accelerate its technical development efforts and will also scale its multimodal platforms.
The investment boosts the startup's valuation to more than $1 billion from the previous $300 million in a 2023 funding round, Bloomberg reported Tuesday.

Ye Chart Kuch Kehta Hai - IXIGO (Le Travenues Technology)IXIGO (Le Travenues Technology) Stock Analysis
Technical Chart Analysis
Key Observations
Strong Weekly Breakout: The stock has surged past previous resistance levels with a sharp upward move. The current price is ₹219.88, near its recent high of ₹229.96.
Fibonacci Retracement Levels:
The price has decisively cleared major Fibonacci retracement levels (0.236, 0.382, 0.5, 0.618), indicating strong momentum.
Price is trading above the important 0.786 level (₹216.70), often seen as a bullish continuation signal.
Volume Spike: There's a significant surge in volume (circled in blue). Such big volume confirms strong accumulation and buying interest from institutional and retail investors.
Moving Averages:
The price is well above the EMA clusters (50, 100, 200), reflecting sustained uptrend and strong relative strength.
The 21 EMA and other short/long-term averages are below the current price, confirming bullish trend continuation.
Future Growth Signals From Chart
Breakout With Volume: A high-volume breakout above resistance and Fibonacci levels suggests potential for further upside as buyers dominate the market.
No Immediate Overhead Resistance: With price at all-time or recent highs, there's less supply overhead, which often allows for unimpeded further growth.
Positive Trend Structure: Higher highs and higher lows are observed on the weekly timeframe, signifying a well-established bullish trend.
Fundamental Analysis Aspects
Business Model
Core Business: IXIGO (Le Travenues Technology) operates as a leading travel booking platform in India, leveraging technology to aggregate travel options (flights, trains, buses, hotels) for price comparison and booking.
Asset-light Model: The company primarily acts as an aggregator, minimizing capital expenditure and allowing for scalable growth.
Financial & Growth Metrics
Revenue Growth: IXIGO has reported strong revenue growth in recent years, driven by the recovery in travel demand, increased market penetration, and digital adoption.
Profitability: The company has moved towards profitability, capitalizing on operating leverage as volumes grow.
Expanding Market: The Indian travel and tourism sector is expected to see sustained double-digit growth aided by rising disposable incomes, digital transformation, and increasing urbanization.
Cost Efficiency: Operating margin improvements are visible, strengthened by digital efficiencies and low fixed costs.
Competitive Strengths
Brand Recognition: IXIGO is regarded as a trusted platform with a large user base, especially for train and budget travel.
Technology-driven: Advanced use of AI and data analytics to personalize recommendations and reduce customer acquisition costs.
Government Initiatives: Broader policy push towards digital public infrastructure (e.g., UPI, IRCTC integrations) continues to support volumes.
Future Growth Catalysts
Expansion into Tier 2/3 cities with increasing internet penetration.
Continued recovery in the travel sector post-pandemic.
Diversification into new travel segments and value-added services.
Strategic partnerships and potential international expansion.
Risks to Watch
Intense competition from established OTAs.
Vulnerability to economic downturns or travel disruptions.
Fluctuations in user acquisition costs and evolving technology.
Conclusion:
The technical setup for IXIGO shows strong bullish signals with robust volume support and price action above key resistance levels. Fundamentally, the company stands to benefit from sectoral recovery, digital adoption, and its asset-light, technology-driven business model—making it well-positioned for potential future growth.

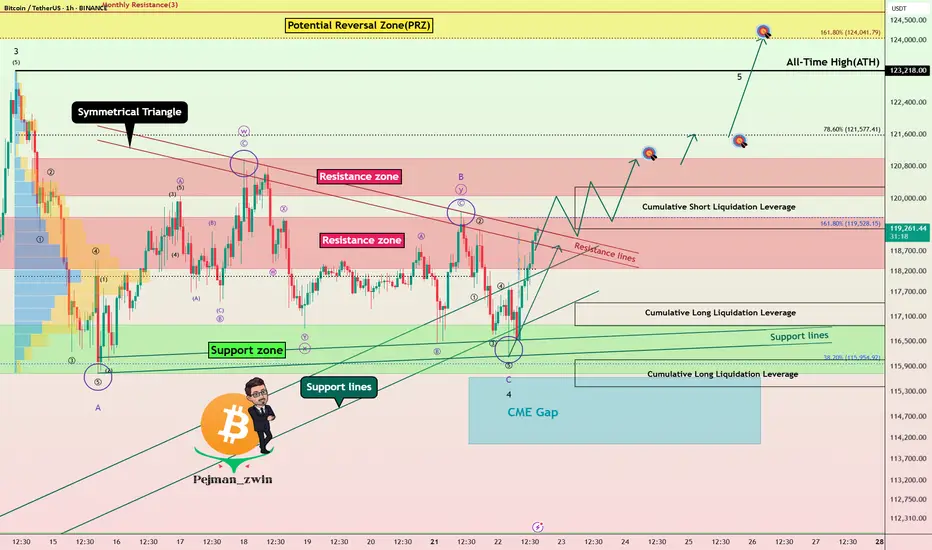
Powell’s Comments Could Decide BTC’s Fate: New ATH or Rejection!Bitcoin ( BINANCE:BTCUSDT ) has attacked the Support zone($116,900-$115,730) several times over the past week but failed to break through, meaning that buyers are still hoping for a BTC increase or even a new All-Time High(ATH) .
Bitcoin has reached a Resistance zone($119,530-$118,270) again and is trying to break the upper lines of the Symmetrical Triangle Pattern . The Cumulative Short Liquidation Leverage($117,255-$116,675) is important and includes high sell orders , so if Bitcoin can break the Resistance zone($119,530-$118,270) and the Resistance lines with high momentum , we can hope for a continuation of the upward trend.
Whether or not the Resistance zone($119,530-$118,270) and the Resistance lines break could depend on the tone of Jerome Powell’s speech today .
Jerome Powell will speak at the opening of the “ Integrated Review of the Capital Framework for Large Banks ” — the final major appearance before the Federal Reserve enters its pre-meeting blackout period.
Market Expectations:
The speech is officially about regulatory frameworks (like Basel III), but traders are watching closely for any hints regarding interest rate policy. Even indirect comments could move risk assets like BTC.
Rate Cut Signals?
With political pressure mounting (including criticism from Trump ) and markets pricing in a potential cut later this year, Powell may adopt a cautious, data-dependent tone emphasizing flexibility in decision-making.
--------------------
In terms of Elliott Wave theory , it seems that the wave structure of the main wave 4 correction is over. The main wave 4 has a Zigzag Correction(ABC/5-3-5) , so that the microwave B of the main wave 4 has a Double Three Correction(WXY) . Of course, the breakdown of the Resistance zone($119,530-$118,270) and Resistance lines can confirm the end of the main wave 4 .
Also, there is a possibility that the 5th wave will be a truncated wave because the momentum of the main wave 3 is high , and Bitcoin may NOT create a new ATH and the main wave 5 will complete below the main wave 3.
I expect Bitcoin to rise to at least the Resistance zone($121,000-$120,070) AFTER breaking the Resistance zone($119,530-$118,270) and Resistance lines .
Second Target: $121,620
Third Target: $123,820
Note: Stop Loss(SL)= $117,450
CME Gap: $115,060-$114,947
Cumulative Long Liquidation Leverage: $117,429-$116,878
Cumulative Long Liquidation Leverage: $116,053-$115,411
Please respect each other's ideas and express them politely if you agree or disagree.
Bitcoin Analyze (BTCUSDT), 1-hour time frame.
Be sure to follow the updated ideas.
Do not forget to put a Stop loss for your positions (For every position you want to open).
Please follow your strategy and updates; this is just my Idea, and I will gladly see your ideas in this post.
Please do not forget the ✅' like '✅ button 🙏😊 & Share it with your friends; thanks, and Trade safe.
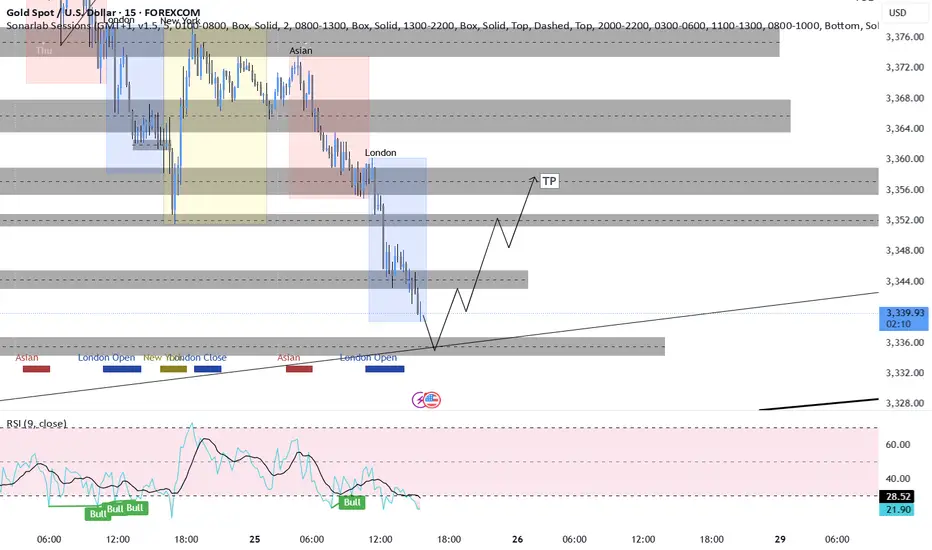
GOLD (XAUUSD) Intraday Idea LongGold been keeping falling on both Asian and European sessions.
Most probably likely to pullback to London high after the New York session open.
Let's see if this plays out!
Good Luck!
Report - 25 jully, 2025U.S.–EU Tariff Negotiations Stabilizing Markets
Reports confirm the U.S. and EU are nearing a deal for 15% reciprocal tariffs—lower than the initially threatened 30% by President Trump. This easing of tensions led to moderate equity gains in both blocs, with the Stoxx 600 reaching a 6-week high before closing +0.2%. Pharmaceutical and auto stocks outperformed (Volkswagen +2.3%, Bayer +2.3%).
Forecast: If the 15% deal is finalized by the August 1 deadline, it would remove a key overhang on equities and boost cyclical sectors reliant on transatlantic trade. A failure, however, risks escalation, triggering retaliatory tariffs by the EU on $93bn of U.S. goods, dragging risk assets sharply lower.
DXY Outlook: Tariff de-escalation boosts safe-haven flows and investor optimism, supporting USD strength.
S&P 500: Short-term relief rally expected if the 15% tariff framework is signed. However, margin compression risks remain from lingering supply chain disruptions.
Tesla vs Trump: Policy Shock Rattles EV Sector
Elon Musk warned that Trump's anti-EV stance and trade war posture will sharply erode Tesla’s regulatory credit revenue and remove the $7,500 EV tax credit. Tesla's stock has cratered 37% since December, with a sharp 8% drop yesterday. Adjusted Q2 net income was down 22%, revenue -12%.
Risk Forecast: Loss of EV subsidies + political fallout between Musk and Trump could drag Tesla further and dampen broader EV sector growth.
XAUUSD: Rising political uncertainty and risks to the U.S. tech sector may drive safe-haven flows into gold.
Dow Jones: Tesla's underperformance and anti-EV policies could limit industrial sector gains.
ECB Holds Rates Amid Trade Risk Fog
The European Central Bank paused its easing cycle, holding the benchmark rate at 2%. Lagarde emphasized a "wait-and-watch" stance, signaling uncertainty due to unresolved trade talks and tariff volatility.
Market Implication: Eurozone government bond yields rose (10Y Bund at 2.70%), paring rate-cut bets. The euro softened to $1.1760.
EURUSD: Lack of further ECB accommodation and weaker consumer confidence amid trade frictions.
Fed Independence in Jeopardy? Market Confidence Wobbles
Pimco warned that White House pressure on Fed Chair Powell—including potential firing and scrutiny over $2.5bn HQ renovations—could destabilize markets. Trump continues pushing for aggressive 1% rates, diverging from current 4.25–4.5% levels.
Fiscal/Political Implication: Undermining Fed autonomy risks flight from U.S. bonds, undermining monetary policy credibility and capital inflows.
USDJPY: Yen may gain if markets lose faith in U.S. institutional integrity, despite rate differentials.
DXY: Temporary support from yields, but structural downside if Fed credibility erodes.
Deutsche Bank and BNP: Diverging Strengths in Volatile Landscape
Deutsche Bank posted its strongest Q2 in 18 years, driven by litigation charge reversals and stable investment banking performance. BNP Paribas also reported solid FICC trading (+27%), though equity trading lagged due to weak derivatives demand.
Equity Implication: Strong capital returns and stable European banking profitability support DAX resilience amid trade noise.
DAX: Boosted by banking and auto outperformance.
China–EU Trade Strains Escalate
Von der Leyen directly confronted Xi Jinping over trade imbalances and support for Russia. EU exports to China are down 6% YoY while Chinese imports to the EU are up 7%. Xi defended Beijing’s stance, warning against "decoupling" rhetoric.
Geostrategic Implication: EU may escalate anti-dumping and export control measures. Markets may see renewed volatility in European industrials and luxury sectors reliant on China.
XAUUSD: Rebalancing of power and heightened East–West tensions favor gold.
Oil Oversupply Warning from TotalEnergies
Total warned of an oil glut due to OPEC+ production increases and weakening global demand. Q2 profits fell 30% YoY. Brent now likely to stay within $60–70 range barring major geopolitical flare-ups.
Crude Oil: Short- to medium-term downside risk with soft demand and oversupply fears.
Energy Stocks: Dividend maintenance remains but debt levels and margin pressures may weigh.
AI Spending Surges – Alphabet and SK Hynix
Alphabet posted a 19% Q2 profit jump as AI integration boosts search volumes. Google’s cloud revenues rose 32%. Capex raised to $85bn. SK Hynix also posted record revenues from high-bandwidth memory chip sales, extending its lead over Samsung.
S&P 500: AI-driven earnings upside bolsters tech sector. Expect multiple expansion in mega-cap AI-exposed names.
XAUUSD : Robust AI investment supports risk appetite but inflationary fears could lift gold marginally.

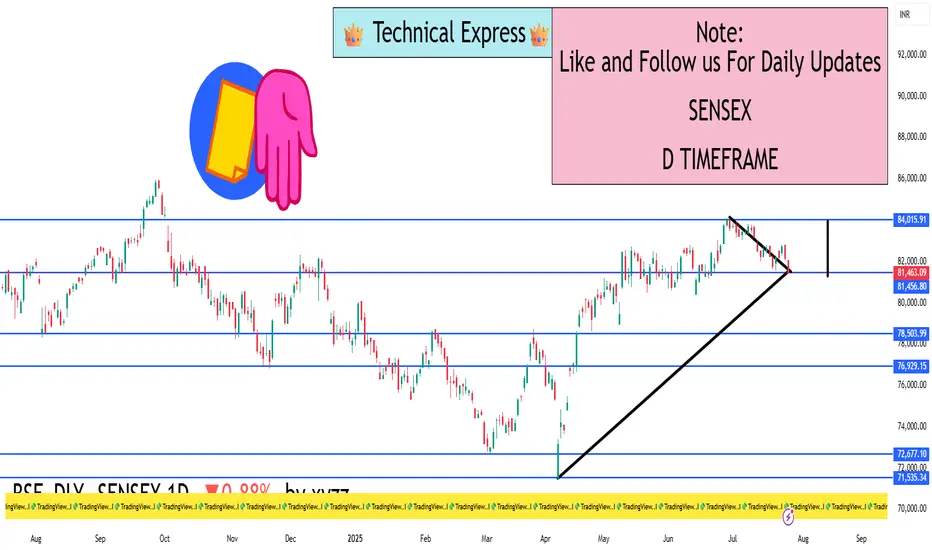
SENSEX 1D Timeframe📉 SENSEX Daily Overview (as of July 25, 2025)
Current Price: Around 81,460
Daily Change: Down by approximately 720 points (–0.9%)
Day’s High: About 82,070
Day’s Low: About 81,400
Previous Close: Around 82,184
📊 1-Day Candlestick Analysis
The candle for today is bearish, indicating strong selling pressure.
The price opened near previous levels but faced resistance at around 82,000.
Sellers dominated most of the day, pushing the index toward the 81,400 support zone.
🔍 Key Support and Resistance Levels
Level Type Price Range
Resistance 82,000 – 82,200
Support 81,400 – 81,000
If Sensex breaks below 81,400, the next target could be around 80,500 or 79,900.
If it holds above support and bounces, it could retest 82,200.
🧠 Technical Trend Analysis
Short-Term Trend: Bearish
Medium-Term Trend: Neutral to mildly bullish (as long as above 80,000)
Market Structure: Lower highs forming, suggesting pressure building on bulls
Indicators (assumed):
RSI may be approaching oversold
MACD likely showing bearish crossover
Volume increasing on red candles—indicating strong sell interest
📌 Sentiment & Market Context
Financial stocks (like banking, NBFCs) are under pressure.
Global cues (such as interest rate uncertainty and geopolitical concerns) are impacting investor confidence.
FII outflows and weak earnings in key sectors are adding to bearish momentum.
The broader trend remains range-bound, but with short-term downside bias.
✅ Strategy Suggestions (For Traders & Investors)
Swing Traders: Wait for a reversal candle (like a bullish engulfing or hammer) before considering long positions.
Breakout Traders: Watch for breakdown below 81,000 for continuation of the fall.
Positional Traders: Can wait to enter near 80,000–79,500 if the market holds that key level.
🔄 Summary
SENSEX is under pressure with a drop of 720+ points.
Technical structure suggests caution, especially if 81,000 breaks.
Support: 81,000 – 80,500
Resistance: 82,000 – 82,200
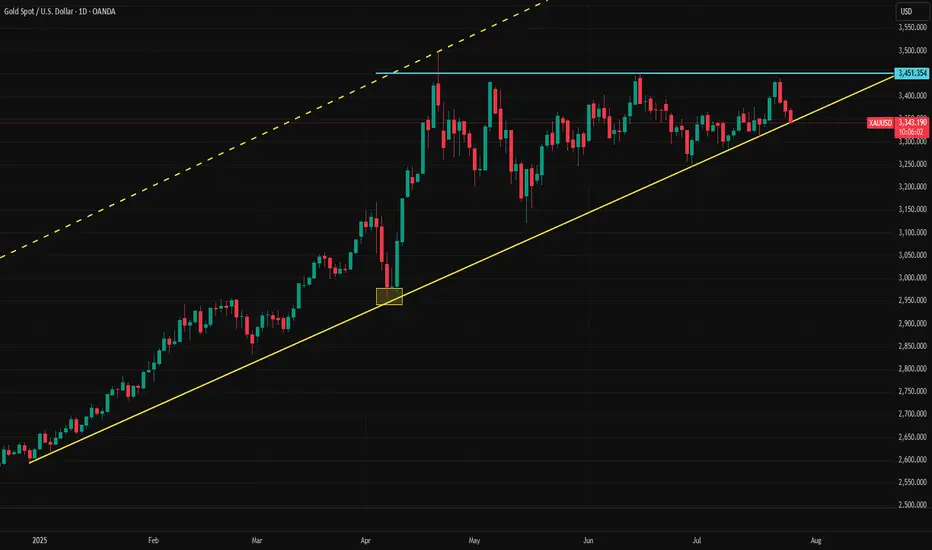
Gold Tests Year-to-Date TrendlineGold is getting a breather from recent newsflow and is now testing the trendline on the daily timeframe. The Japan deal, some positive developments in the EU–US negotiations, and yesterday’s Trump–Powell "sitcom" have helped ease concerns about the economy.
Although the trend began in December, when viewed from April, it clearly forms an ascending triangle pattern. Ascending triangles typically break to the upside, which could favor gold bulls. However, the lower support line is being tested very aggressively and has been challenged multiple times, which is not a good signal.
Today could be decisive, potentially leading to a downside break or an upward move that sets the tone for the weekly close. For gold traders, today and Monday could be key in determining the medium-term direction.
Ethereum’s $4,000 Target Alive as Historic Rally Signs EmergeBINANCE:ETHUSDT is currently trading at $3,680, just 9% away from the critical $4,000 resistance that many investors have been waiting for over the past seven months. The altcoin is expected to continue its upward momentum despite the recent consolidation, with the potential to breach the $4,000 mark soon.
Looking at broader technical indicators, the NUPL (Net Unrealized Profit/Loss) suggests that BINANCE:ETHUSDT is poised for a significant rally . The NUPL indicator, when reaching a threshold of 0.5, traditionally signals a pause in the uptrend, followed by a sharp rally.
$ BINANCE:ETHUSDT is currently nearing this threshold , which, in the past, has marked the beginning of powerful upward price action.
As long as BINANCE:ETHUSDT remains above its key support levels, the price is likely to surge toward $4,000 . If Ethereum can maintain its momentum, a breach of $4,000 could act as a catalyst for further gains.
However, should unforeseen selling pressure arise, $BINANCE:ETHUSDTprice could slip below the $3,530 support level. In such a scenario, Ethereum may fall to $3,131, invalidating the current bullish outlook. The key will be maintaining support and capitalizing on the retail-driven surge.

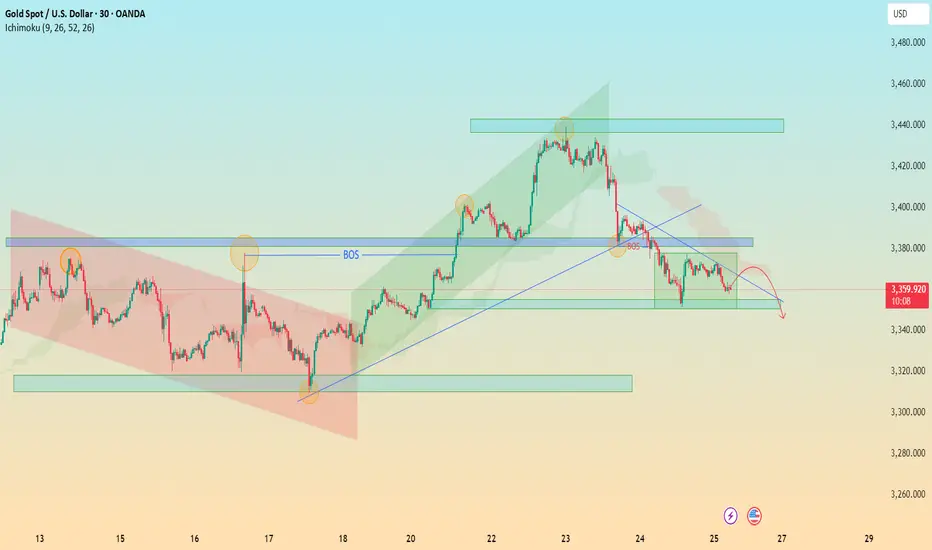
XAU/USD Bearish Retest in Motion – Watch 3340 for Breakout 🔍 XAU/USD (Gold) – Bearish Reversal Outlook
Timeframe: 30-Minute
Date: July 25, 2025
Indicators Used: Ichimoku Cloud, BOS (Break of Structure), Trendlines, Support & Resistance Zones
---
⚙ Technical Breakdown:
1. Previous Market Structure – Accumulation to Expansion:
Descending Channel (Red Box): Market moved within a bearish channel until the breakout occurred.
Key Break of Structure (BOS) around 3365 level signaled the beginning of bullish momentum — a textbook shift from accumulation to expansion phase.
Rally towards 3445 zone: Strong impulsive wave followed by higher highs and higher lows within a green rising channel.
2. Bull Trap and Structural Breakdown:
At the 3445-3460 resistance zone, price failed to maintain momentum and formed a double top / distribution setup.
The second BOS near 3385 confirmed a shift from bullish to bearish market structure.
Ichimoku Cloud also flipped bearish — price is now trading below the cloud, signaling potential continued downside.
3. Current Consolidation and Bearish Retest:
Price is now trapped in a bearish flag / rectangle pattern between 3360 – 3380.
Recent rejections from the descending trendline and overhead supply zone indicate weak bullish attempts and presence of strong selling pressure.
4. Anticipated Move – Bearish Continuation:
The projected red path suggests a retest of the diagonal resistance, followed by a breakdown toward key demand zone at 3340 – 3320.
If that zone fails, we may see a deeper move toward 3280.
---
📌 Key Technical Zones:
Zone Type Price Level (Approx.) Description
Resistance 3445 – 3460 Double Top / Strong Supply
Support 3340 – 3320 Historical Demand Zone
Short-term Resistance 3375 – 3385 BOS Retest + Trendline
---
🎯 Trading Insight:
📉 Bias: Bearish
⚠ Invalidation Level: Break above 3385 with volume
📊 Potential Target: 3340 → 3320
🧠 Trade Idea: Look for short entries on weak retests near descending trendline or cloud rejection.
---
🏆 What Makes This Chart Unique for Editors’ Picks:
✅ Multiple Confluences: Structural shifts (BOS), trendlines, Ichimoku, and classic patterns (channels, flags).
✅ Clear Visual Storytelling: Logical flow from bearish to bullish and back to bearish structure.
✅ Forward Projection: Predictive outlook based on strong technical context — not just reactive analysis.
✅ Educational Value: Useful for beginners and intermediate traders alike to understand structure transitions and key levels.
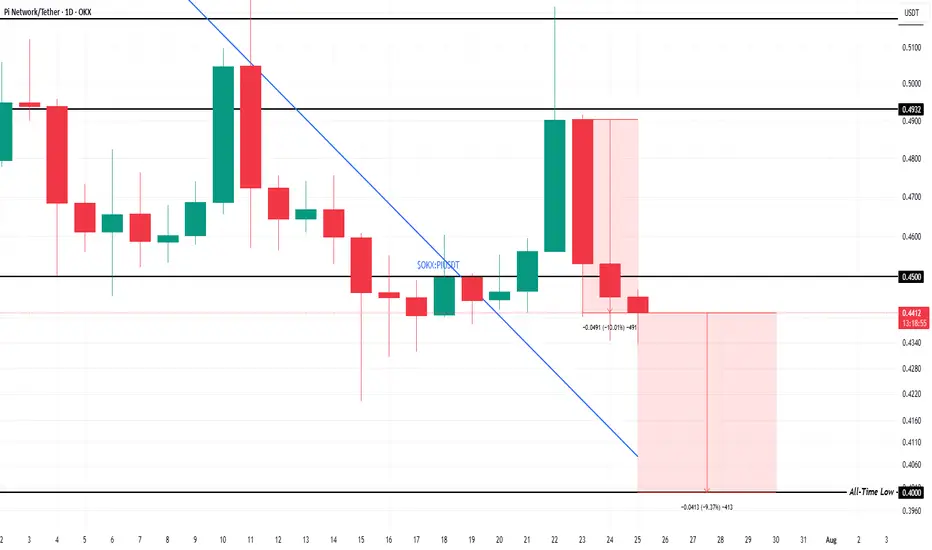
Pi Coin Price Falls 10%, All-Time Low Now Just 9% AwayOKX:PIUSDT price is currently hovering at $0.44, just 9% away from its all-time low of $0.40 . The recent decline has pushed the altcoin below the support of $0.45, indicating a weak position. The next support level for Pi Coin is crucial as it attempts to hold above its current levels.
With Pi Coin already down 10% in the past two days , the outlook appears grim. Should the selling pressure continue, the altcoin may easily slide to its all-time low, forming a new ATL (all-time low). This would mark a new low in OKX:PIUSDT short history, potentially signaling a longer-term bearish phase.
However, if OKX:PIUSDT manages to reverse its course, there is hope for recovery. If it can secure $0.45 as a reliable support floor, the altcoin may push past $0.49 and even reach $0.51 . If these levels are reclaimed, the bearish thesis could be invalidated, and a new upward momentum may be formed.
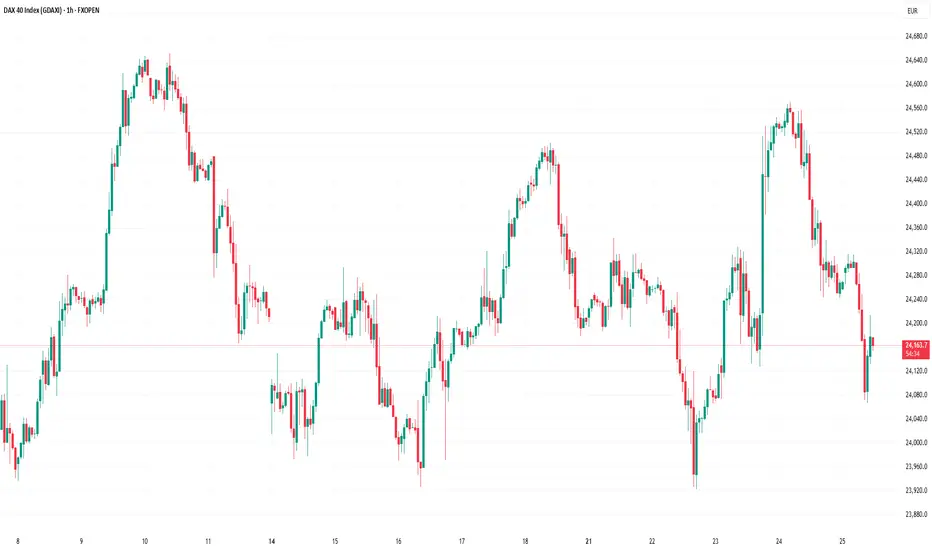
The DAX Index Is Losing Its Bullish MomentumThe DAX Index Is Losing Its Bullish Momentum
At the end of May, we noted that the German stock index DAX 40 was exhibiting significantly stronger performance compared to other global equity indices. However, we also highlighted the 24,100 level as a strong resistance zone.
Two months have passed, and the chart now suggests that bearish signals are intensifying.
From a technical analysis perspective, the DAX 40 formed an ascending channel in July (outlined in blue). However, each time the bulls attempted to push the price above the 24,460 level (which corresponds to the May high), they encountered resistance.
It is worth noting the nature of the bearish reversals (indicated by arrows) – the price declined sharply, often without intermediate recoveries, signalling strong selling pressure. It is likely that major market participants used the proximity to the all-time high to reduce their long positions.
From a fundamental standpoint, several factors are weighing on the DAX 40:
→ Ongoing uncertainty surrounding the US–EU trade agreement, which has yet to be finalised (with the deadline approaching next week);
→ Corporate news, including disappointing earnings reports from Puma, Volkswagen, and several other German companies.
Given the above, it is reasonable to assume that bearish activity could result in an attempt to break below the lower boundary of the ascending blue channel.
This article represents the opinion of the Companies operating under the FXOpen brand only. It is not to be construed as an offer, solicitation, or recommendation with respect to products and services provided by the Companies operating under the FXOpen brand, nor is it to be considered financial advice.
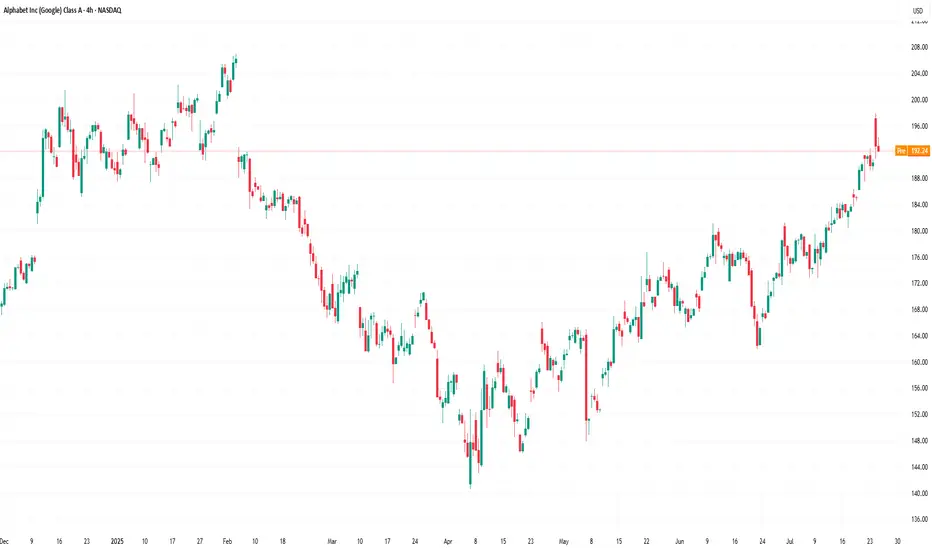
Alphabet (GOOGL) Stock Chart Analysis Following Earnings ReleaseAlphabet (GOOGL) Stock Chart Analysis Following Earnings Release
Earlier this week, we highlighted the prevailing bullish sentiment in the market ahead of Alphabet’s (GOOGL) earnings report, noting that:
→ an ascending channel had formed;
→ the psychological resistance level at $200 was of particular importance.
The earnings release confirmed the market’s optimism, as the company reported better-than-expected profits, driven by strong performance in both its advertising and cloud segments.
In his statement, CEO Sundar Pichai noted that AI is positively impacting all areas of the business, delivering strong momentum.
The company is expected to allocate $75 billion this year to expand its AI capabilities.
As a result, Alphabet (GOOGL) opened yesterday’s trading session with a bullish gap (as indicated by the arrow). However, as the session progressed, the price declined significantly, fully closing the gap.
This suggests that:
→ the bulls failed to consolidate their gains, allowing the bears to seize the initiative;
→ the ascending channel remains valid, with yesterday’s peak testing its upper boundary;
→ such price action near the $200 level reinforces expectations that this psychological mark will continue to act as resistance.
It is possible that the positive sentiment following the earnings report may weaken in the near term. Accordingly, traders may consider a scenario in which Alphabet’s (GOOGL) share price retraces deeper into the existing ascending channel. In this case, the former resistance levels at $180 and $184 may serve as a support zone.
This article represents the opinion of the Companies operating under the FXOpen brand only. It is not to be construed as an offer, solicitation, or recommendation with respect to products and services provided by the Companies operating under the FXOpen brand, nor is it to be considered financial advice.
ETH/BTC vs btc dominanceethereum received a reaction as we expected from the current demand zone in the bitcoin pair, and it seems inevitable that the upward momentum from the current area will continue. on the bitcoin dominance side, the same situation exists, but I think we will witness a bearish absolute process.
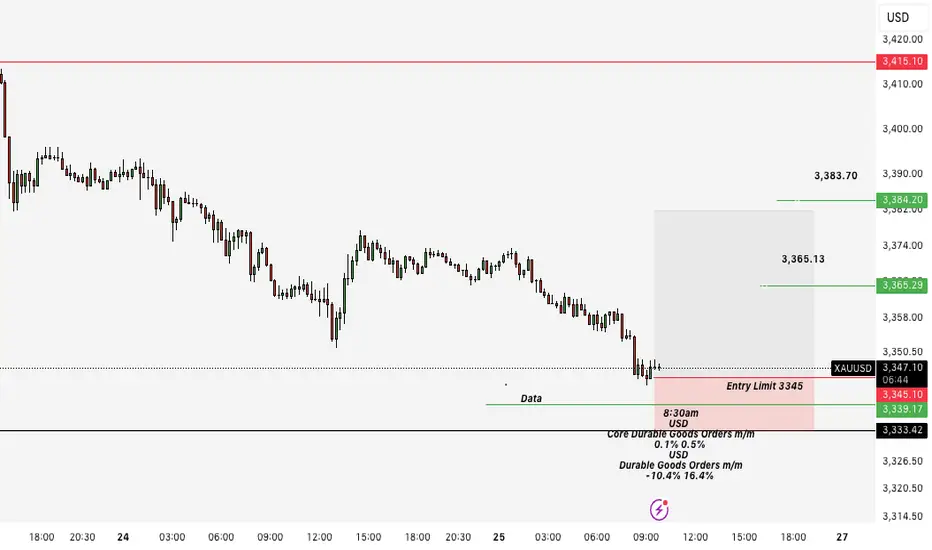
15 m Friday ScalpWaiting for A Trigger on Price 3345
SLS will be 37
Targets 3365-3371-3381.
Risk management is Key
Hold Continue into 8:30 am est data release.
I expect a nice Bullish valley cnadle but we will get major momentum on selling but a wick fill into the closure July 25th.
Bitcoin Btc usdt Daily analysis
Time frame daily
If btc can't break the green uptrend line strongly I guess it drops to 87$
But if btc can continue it's sharp way , my target is 170 $

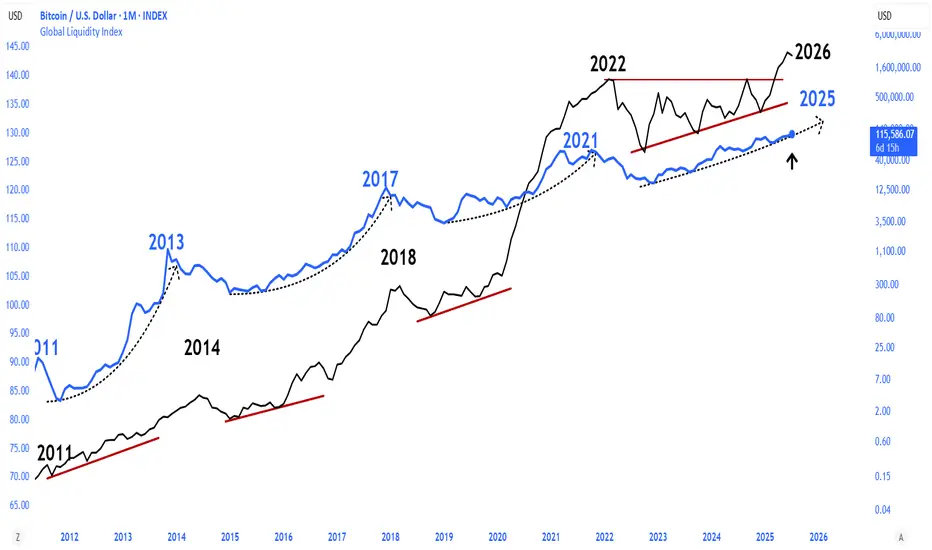
Global Liquidity Index vs BitcoinGlobal liquidity index at ATH!
CRYPTOCAP:BTC will continue to follow hard!
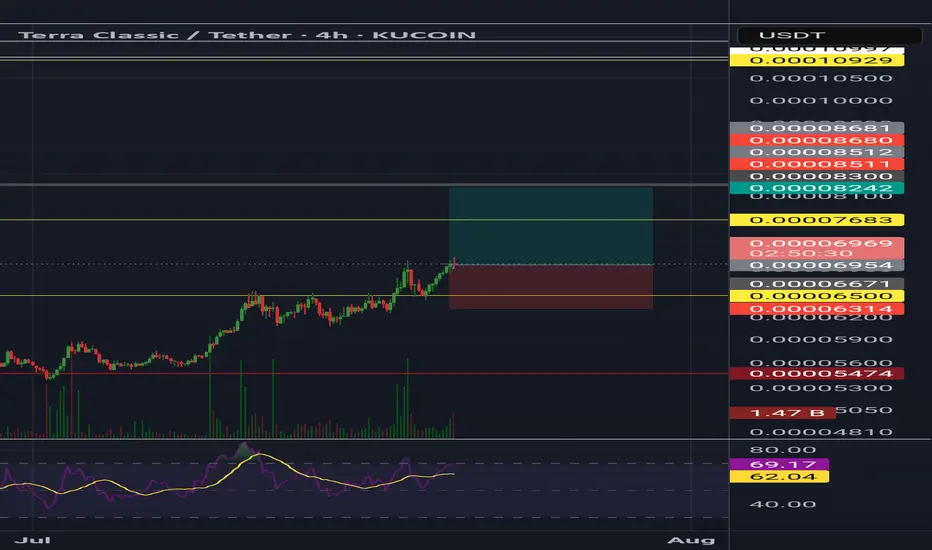
Terra classic Lunc usdt Daily analysis
Time frame 4hours
Risk rewards ratio =2 👈
Target = 0.000083 $
Double benefit in short time is good for traders
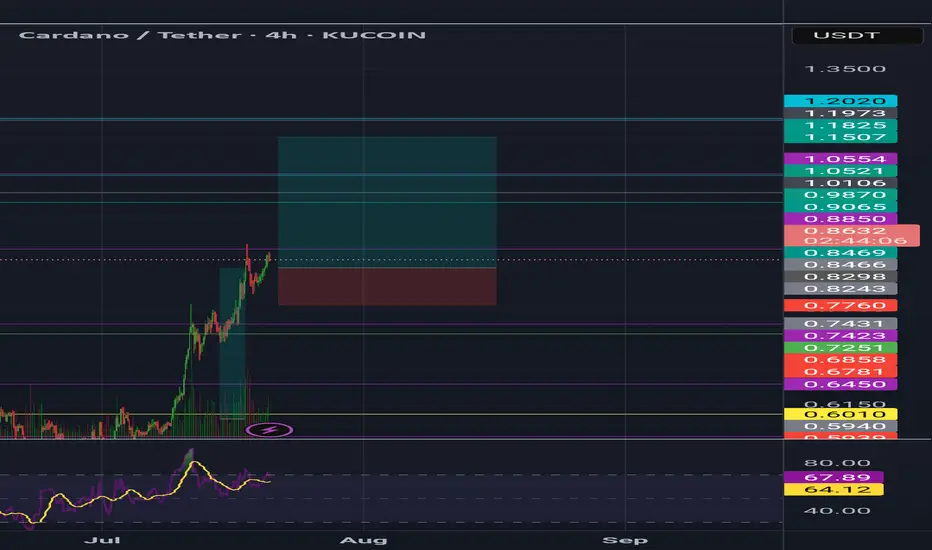
CardanoAda usdt Daily analysis
Time frame 4hours
Risk rewards ratio >4.3
Target =1.15$
Cardano is the Valuable asset in crypto market
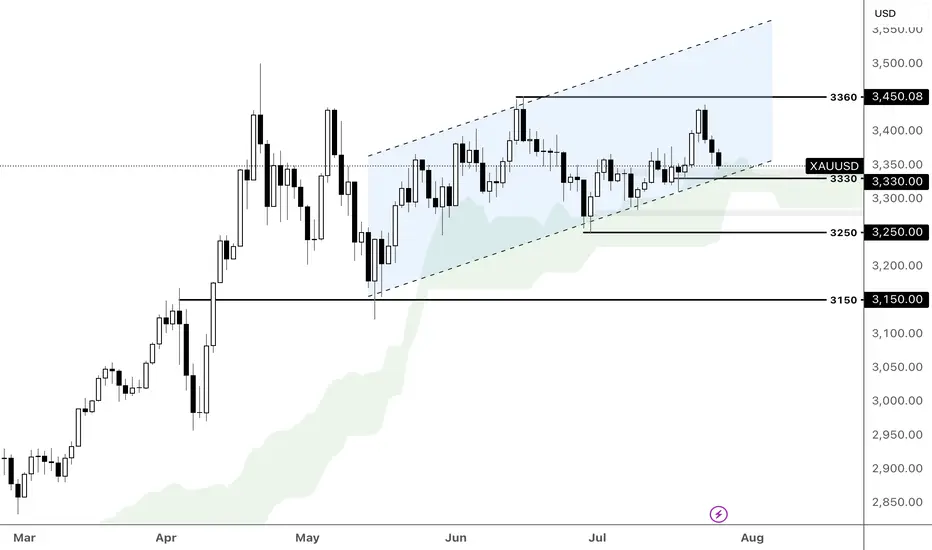
XAUUSD is approaching the support at 3330XAUUSD is approaching support at 3330, which aligns with the ascending channel support and Ichimoku cloud. If we see a rebound from this support, the price could gain upward momentum toward the following resistance at 3360. Conversely, a break below this support could prompt a deeper retracement toward the following support at 3250.
Gold eased as easing tariff tensions and solid US labor data trimmed demand for safe-haven assets. Following a separate deal with Japan, a reported breakthrough in US-EU trade negotiations reduced geopolitical risk premiums.
US jobless claims declined for a sixth straight week, reinforcing expectations that the Fed will hold rates steady next week, though a cut in September remains on the table.
While political friction between President Trump and Fed Chair Powell sparked fresh headlines, it had a limited market impact.
By Li Xing Gan, Financial Markets Strategist Consultant to Exness