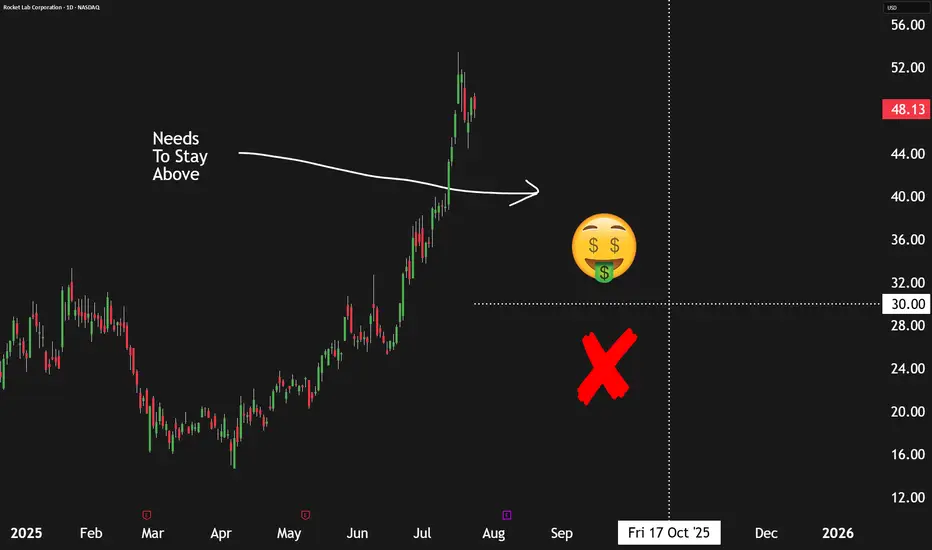
How We're Earning A 13%+ Yield Selling Puts On Rocket LabThe commercial space sector is booming, and Rocket Lab NASDAQ:RKLB stands out as one of the most promising players—not just another speculative startup or space tourism hype. But while the company is making strong operational strides, its stock valuation appears stretched, prompting a more strategic approach to investing.
📈 Strong Execution, Growing Opportunity
Rocket Lab continues to hit meaningful milestones. In Q1, the company:
Secured a U.S. Space Force contract for its upcoming Neutron heavy-lift rocket.
Won hypersonic-related contracts with the U.S. Air Force and the U.K. Ministry of Defense.
Successfully completed five Electron rocket launches and booked eight more.
Made a strategic acquisition for developing "Flatellites," enhancing vertical integration.
Revenue rose 32% year-over-year, with gross margins in the mid-30% range. Importantly, Rocket Lab has a $1 billion+ revenue backlog, with over half expected to convert in the next year, and a healthy mix of government and commercial clients across both its Launch and Space Systems divisions.
💰 Valuation: Big Potential, Bigger Price Tag
Rocket Lab's business is solid, but its valuation raises red flags. With a price-to-sales ratio near 55x (compared to SpaceX's ~14x), investors are paying a steep premium for future success. The company is still unprofitable, and the high valuation leaves little room for error. Simply put, the market may be rewarding Rocket Lab too early.
📊 The Smarter Move: Sell Put Options
Instead of buying shares at inflated levels, the better approach is to sell put options—a strategy that earns upfront cash and offers the opportunity to buy shares at a discount if the stock drops.
Recommended trade:
Sell October 17th $30 strike put options
Premium: ~$96 per contract
Required buying power: ~$2,904
Implied return: ~3.3% over 90 days, or ~13.4% annualized
This provides income now, while still giving investors potential exposure to Rocket Lab at a 40% discount to current prices.
⚠️ Risks to Consider
This isn’t risk-free. If Rocket Lab’s execution falters—especially with Neutron—shares could drop sharply. Selling puts means you may still be forced to buy at $30, even if the stock falls much lower. This strategy works best for investors comfortable owning RKLB long term at a lower entry price.
✅ Bottom Line
Rocket Lab is a strong business, but the stock looks overheated. Selling put options offers a more balanced way to participate in its growth story—earning income now while positioning to buy the stock later at a better value.
Rating: Buy (via options strategy)
Fundamental Analysis
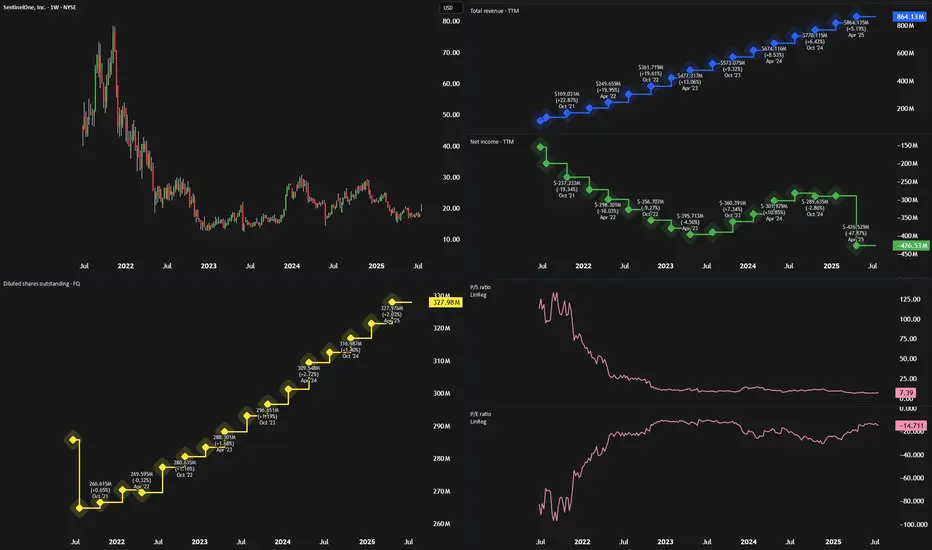
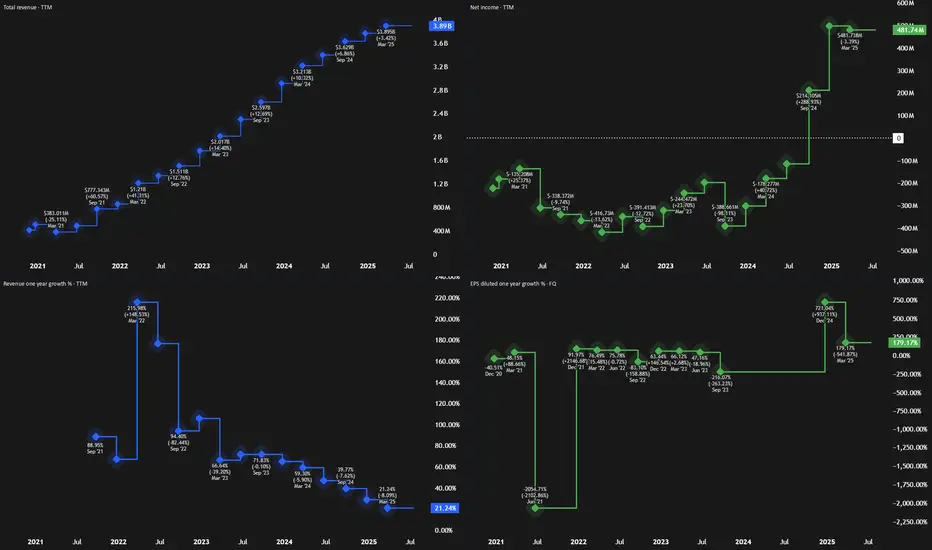
SentinelOne Looks Like Palantir Before The BreakoutIn every market cycle, some high-growth companies are misunderstood—until they aren’t. Palantir (PLTR) was one such stock, dismissed early for its lack of profitability and complex model, only to soar when its AI tools gained traction. Now, SentinelOne (NYSE: S) may be next in line.
🧠 What SentinelOne Does
SentinelOne is a top-tier cybersecurity firm offering an AI-powered endpoint protection platform called Singularity. Like Palantir, SentinelOne has faced criticism for:
Persistent losses
High stock-based compensation (SBC)
A misunderstood business model
Despite this, its technology is sticky, deeply embedded in client IT systems, and well-positioned to ride macro trends in AI and cybersecurity.
📈 Financials: Turning a Corner
While the stock hasn’t moved much in two years, trading around $18, SentinelOne’s fundamentals are improving:
Revenue Growth: Double-digit YoY revenue growth (23%+ in each of the last 10 quarters)
Free Cash Flow: $214 million in the past 12 months (~25% FCF margin)
Gross Margins: High and improving
Operating Expenses: Slowing, creating operating leverage
Adjusted Earnings: Near breakeven, signaling profitability is in reach
These trends mirror Palantir’s path before its breakout, particularly the shift from high OpEx to better margins and rising free cash flow.
💰 Valuation: Still Underrated
SentinelOne is trading at only 6x sales and 27x free cash flow, despite:
Strong 20%+ expected revenue growth
Analyst EPS estimates of ~$0.50 by 2028
A market cap under $6 billion
It’s significantly cheaper than peers like CrowdStrike and Palo Alto Networks—despite having similar growth and margin profiles.
⚠️ Risks to Consider
Fierce Competition: Cybersecurity is a crowded field. SentinelOne will have to keep innovating to stay relevant.
Market Sentiment: As a high-growth name, it may be hit hard in downturns.
Limited TAM vs. PLTR: The cybersecurity market isn’t as vast as AI data platforms.
🚀 Final Take
With strong recurring revenue, improving profitability, and an attractive valuation, SentinelOne looks poised for a re-rating. While it may not match Palantir’s scale or splash, the setup is strikingly similar.
Rating: Strong Buy
Why We See 100%+ Upside In SoFi Over The Next 3 YearsAfter soaring to nearly $28 per share during the SPAC-fueled fintech boom in 2021, SoFi Technologies (SOFI) crashed back to earth, trading under $5 as rising interest rates, regulatory headwinds, and lack of profitability dimmed investor optimism. But the tide has turned.
Over the past year, SoFi has reshaped its business and posted significant growth. Shares are now up 247% since our previous bullish call at $6. With the company now profitable and diversifying revenue, we'd argue there’s still upside ahead.
💼 A Stronger, Diversified Business
SoFi has evolved from a student loan-focused lender into a full-spectrum fintech platform. It now operates across:
Lending: $413M in Q1 revenue
Financial Services (consumer banking): $303M
Technology Platform (B2B): $103M
While lending still makes up the majority, the tech and services segments are growing fast—especially financial services, which doubled revenue YoY and tripled profit. SoFi's white-label platform also gives it a SaaS-like recurring revenue profile.
Q1 results showed:
Revenue: $770M (+33% YoY)
EPS: $0.06, with a $31M revenue beat
This business mix gives SoFi more stability and better scalability than many traditional financial firms.
💰 Valuation: Pricey vs. Banks, Cheap vs. Fintech
Critics point to SoFi’s rich valuation—trading at over 8x sales—as a concern. But when compared to other fintechs like NuBank (12x sales) and Robinhood (28x), SoFi looks much more reasonably priced.
On a forward earnings basis, SoFi trades at ~32x GAAP EPS, and if growth continues, this could drop below 30x. That’s appealing for a company expected to grow:
Revenue: ~25% annually
Net income: ~33% annually
By 2027, analysts project $1B in operating income, double today’s figure. If SoFi maintains current valuation multiples, this alone could double the stock in 3 years.
⚠️ Risks to Watch
Regulatory scrutiny in the financial sector
Cyclicality of consumer lending
Intense competition from firms like Robinhood, Chime, and Coinbase
Despite these challenges, SoFi’s expanding ecosystem and growing brand strength position it well.
✅ Final Take: Still a 'Strong Buy'
With accelerating revenue, expanding margins, and a scalable business model, SoFi has moved beyond its hype-fueled origins and is now a real fintech contender. Even after its rally, its valuation still leaves room for meaningful upside.
Rating: Strong Buy
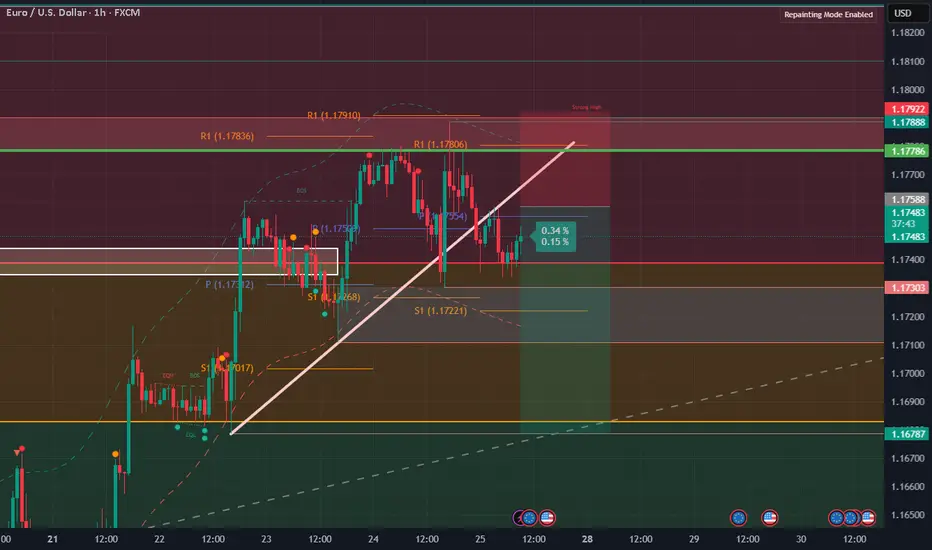
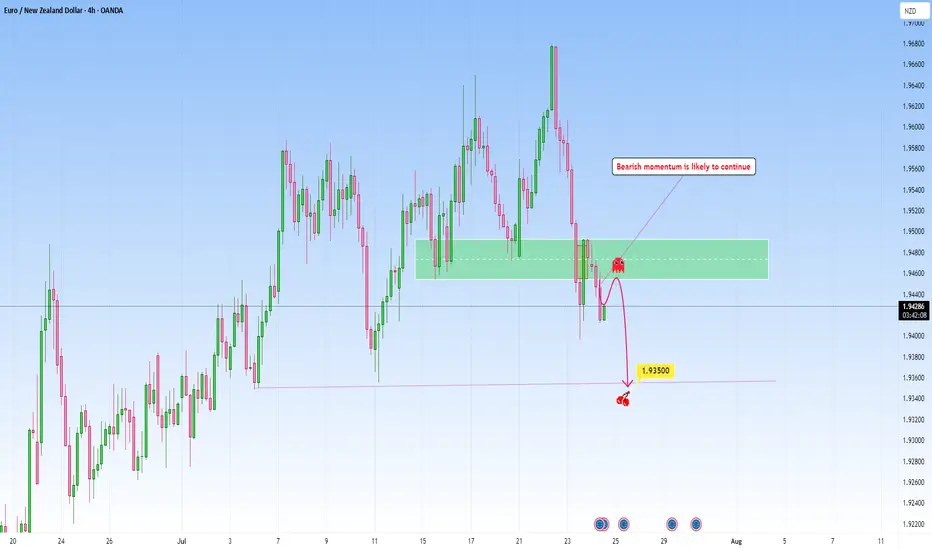
EURNZD Continuation setup following recent bearish momentumThe market has recently pushed down with momentum.
Price attempted a timid "echo bounce" back into the broken support but was rejected, confirming this area now serves as area for bearish re-entries.
From what I can tell, we're entering the next leg of what I call the “Gravity Spiral Phase”, where sellers take over after taking a clear zone. Each wave down is not just a move, but a continuation of momentum migration into new bearish move.
Target: 1.93500
This level marks the next gravity anchor, a zone where price memory may attempt to stabilize, but only temporarily.
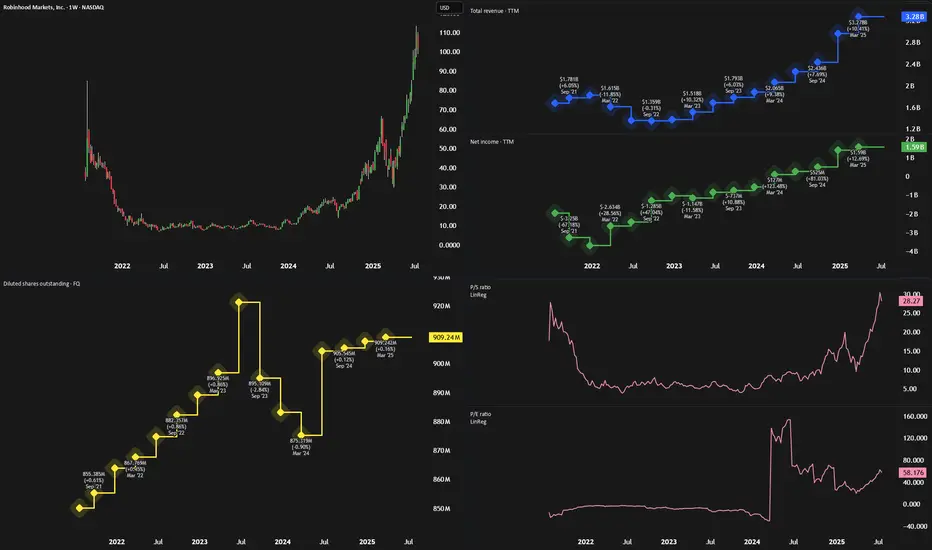
Everyone's Bullish On Robinhood - But Its Time To SellRobinhood NASDAQ:HOOD has seen an incredible rally over the past year, rising more than 500% since August 2023. Much of this surge has been driven by renewed crypto enthusiasm—sparked by Circle’s IPO—and Robinhood’s aggressive push into new products across fintech and crypto.
But despite strong financial performance, we now believe the stock has run too far, too fast.
💰 Strong Fundamentals, But Slowing Growth
Robinhood’s recent financials are undeniably impressive:
Trailing 12-month revenue: $3.27B (up ~60% YoY)
Net income: $1.59B
Operating income: $1.2B
Revenue from commissions and interest income has outpaced expenses, resulting in high margins. But looking ahead, earnings-per-share (EPS) growth is expected to slow. Analysts forecast mid-teens EPS growth in 2026 and 2027, with a potential dip this year as one-time tax benefits roll off.
Robinhood Gold, the company’s premium service, is growing steadily (ARR projected to top $250M this year), but it’s still a small slice of total revenue.
🛠️ Product Expansion or Strategy Drift?
Robinhood is launching a wide array of new offerings—from robo-advisors and AI tools to crypto products in Europe and futures trading in the U.S.
The issue? These launches feel disjointed. U.S. users get a full-featured experience with stocks, options, crypto, and banking tools. UK users are limited to U.S. stock trading, with balances held in USD. In Europe, Robinhood leans heavily into crypto.
While the company claims it’s building a “global financial ecosystem,” the rollout has been inconsistent and confusing. This scattered approach may dilute brand clarity and user trust.
📊 Valuation: Sky-High and Hard to Justify
At current prices, HOOD trades at:
26x revenue
54x trailing earnings
74x forward earnings
At over 45x FY3 earnings, higher than fintech peers like SoFi (29x), Etoro (20x), and Interactive Brokers (27x)
The only comparable valuation is Coinbase (COIN), which has a more dominant position in crypto and stronger institutional traction. Given that most of HOOD’s revenue still comes from traditional brokerage services, this crypto-fueled valuation seems overblown.
🚨 Bottom Line
Robinhood remains a promising long-term company, but its stock looks overheated. Slowing earnings growth, a scattered international strategy, and a sky-high valuation point to limited upside from here.
Verdict: Sell
Investors sitting on big gains may want to take some profits while the euphoria lasts.
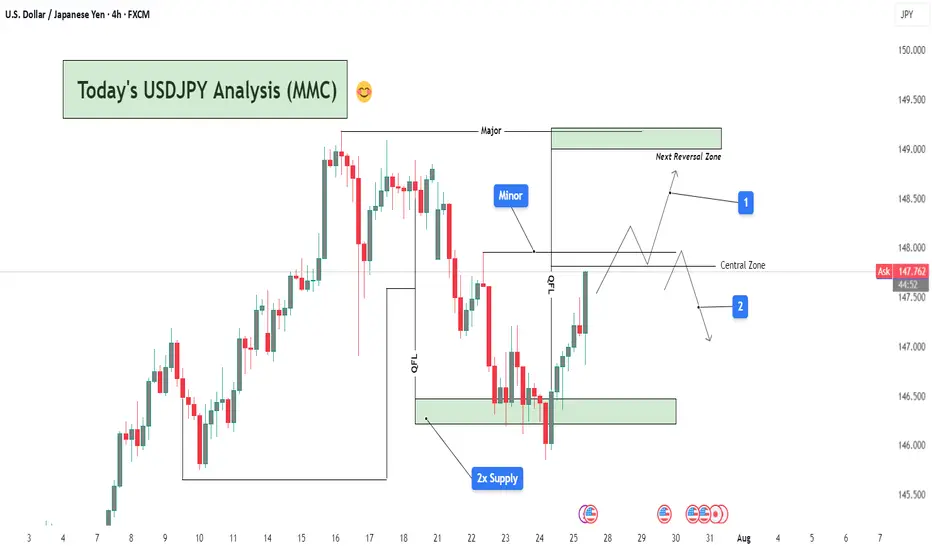
USDJPY Analysis : Smart Money Setup & MMC Concept + Target📌 Chart Overview:
This 4H USDJPY chart presents a multi-phase market structure analysis rooted in MMC (Major-Minor-Central) framework, Smart Money Concepts (SMC), and liquidity mapping. The price is currently trading around 147.39, and the chart outlines two possible scenarios labeled 1 (bullish continuation) and 2 (bearish rejection).
🔍 Key Zones & Technical Elements Explained:
🔹 1. 2x Supply Zone (Support Reaction)
Price rebounded sharply from the double-tested demand zone marked around 146.00–146.50.
This zone has historical significance and has acted as a base for previous bullish momentum.
The sharp V-shaped recovery suggests strong buying interest at institutional levels, hinting at a potential bullish continuation.
🔹 2. QFL (Quick Flip Liquidity) Zone
A notable zone where previous bullish structure broke down. It’s now being retested from below.
The QFL structure acts as a hidden supply zone or potential liquidity trap.
Watch for price rejection here, especially if it aligns with liquidity sweep patterns.
🔹 3. Minor & Major Structural Levels
Minor zone: A smaller consolidation and reaction zone—used to observe minor trend shifts or scaling entries.
Major zone: Sitting around 148.50–149.00, this is your Next Reversal Zone. It overlaps with a historical resistance area and could lead to a significant reaction.
📈 Projected Scenarios:
✅ Scenario 1: Bullish Continuation
Price breaks above the Central Zone and holds.
After breaching the minor resistance, it climbs towards the Major Reversal Zone (148.50–149.00).
There, we look for:
Either a reversal trade setup (liquidity grab + bearish confirmation).
Or continuation beyond 149.00, especially if supported by USD strength/fundamentals.
🚫 Scenario 2: Bearish Rejection
Price fails to hold above the Central Zone.
Rejection at QFL or Minor levels sends the pair back into the mid-147s and potentially down to retest the 2x Supply Zone again.
Breakdown from there could lead to a move towards 145.50–146.00, forming a potential double bottom or deeper retracement.
🧩 Technical Insights Summary:
Trend Context: Short-term bullish recovery from demand, but macro trend still uncertain.
Key Confluence:
2x Supply → Strong demand.
QFL + Central → Key breakout/rejection zones.
Major Zone → High-probability reversal area.
Bias: Neutral to Bullish, favoring Scenario 1 if price sustains above 147.50.
Watch for:
Candlestick rejections in Major Zone.
Break-and-retest behavior in Central Zone.
USD-related news near July 30–31 (highlighted below chart).
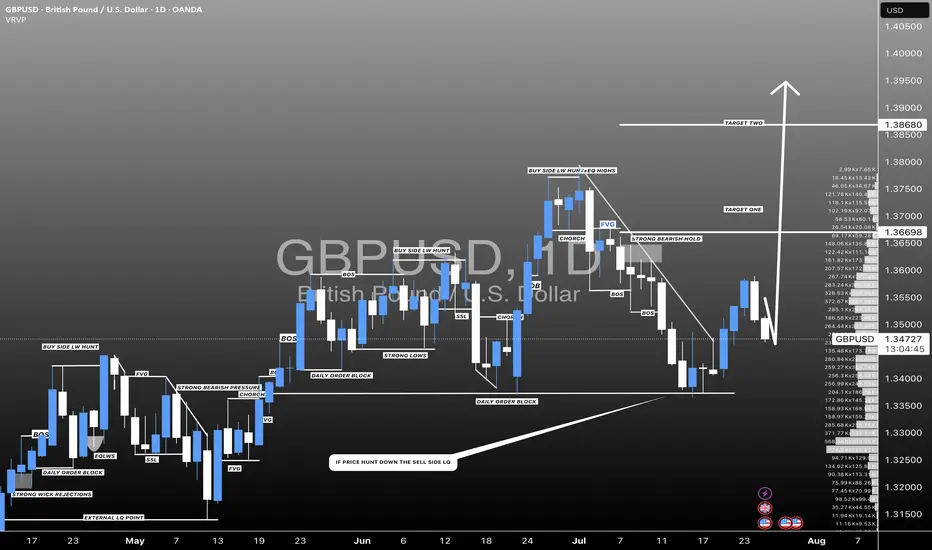
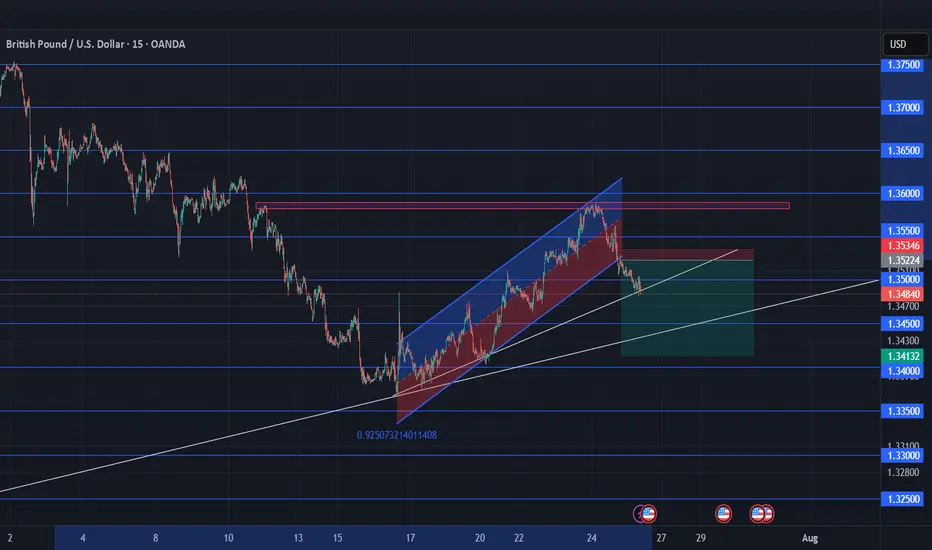
#GBPUSD: Going As Expected, Strong Move AheadHey Everyone,
We have a good opportunity coming up on gbpusd; since our last update on gbpusd, price went as expected. We will see huge increase in price in coming days. Good luck and take care!!
If you like our work then please like and comment.
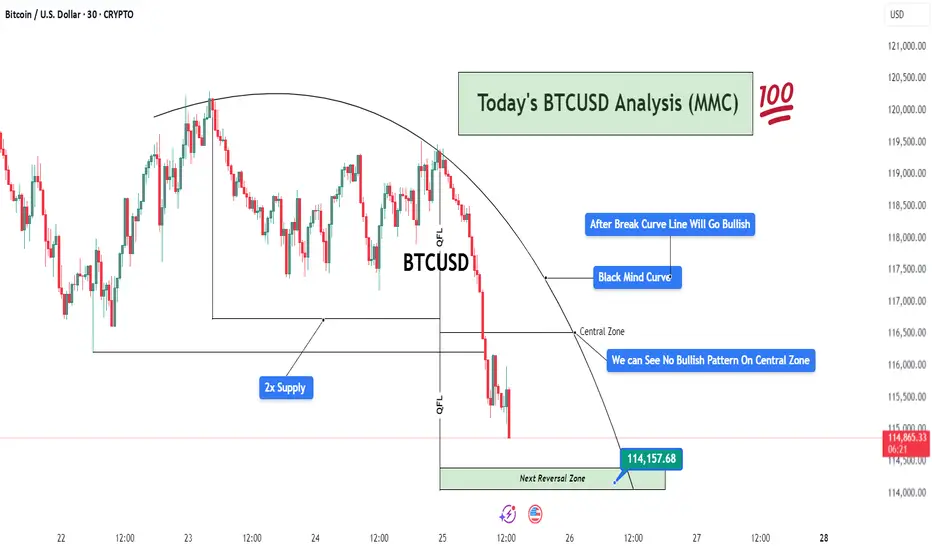
BTCUSD Analysis (MMC) – Bearish Flow Toward Reversal ZoneThis 30-minute BTCUSD chart highlights a well-structured bearish movement following the MMC (Mirror Market Concepts) framework. The analysis centers around the Black Mind Curve, multiple QFL drops, and supply/demand imbalances, presenting a professional outlook on current price action and potential reversals.
🧠 Black Mind Curve – Mapping Market Psychology
The Black Mind Curve is a visual representation of the market’s psychological behavior and serves as a dynamic resistance throughout this structure. Price respected the curvature, slowly losing bullish strength while forming lower highs.
This curve mirrors a distribution phase, where smart money unloads long positions before initiating a downside move.
Your annotation: “After Break Curve Line Will Go Bullish” implies that unless the curve is cleanly broken with strong bullish conviction, the bias remains bearish.
So far, the price is respecting the curve, reinforcing sellers’ control.
🔵 2x Supply Zone – Aggressive Selling Region
The supply zone is tested twice, confirming the presence of institutional-level sellers. This zone becomes critical because:
First touch: Minor reaction, but no follow-through.
Second touch: Strong rejection with extended downside move.
The double rejection clearly shows that buyers are trapped, fueling bearish momentum.
From an MMC view, this confirms the beginning of the “Mirror Market Shift” — where smart money rotates out of longs and traps retail longs near resistance.
📉 QFL (Quick Flip Liquidity) Events – Momentum Crashes
Two major QFL-based breakdowns appear in the chart after price consolidated within ranges. These drops are essential to understand:
QFL reflects market structure breaks where liquidity is engineered, and a sharp sell-off follows.
The first QFL drop occurs after the curve-resistance rejection, and the second confirms continuation.
These are liquidity runs, used to clear stop-losses and maintain bearish pressure.
This creates a domino effect — each QFL level becomes a signal of deeper imbalance.
⚠️ Central Zone – No Bullish Pattern Detected
The Central Zone marks a temporary support or midpoint level — a place where price might find footing if buyers show up.
However, as you noted:
“We Can See No Bullish Pattern On Central Zone”
No bullish engulfing candle.
No pin bar rejection.
No spike in volume.
No market structure shift.
This confirms that buyers are either weak or absent in this zone. MMC traders use this info to stay with the dominant trend (bearish) until proven otherwise.
🟩 Next Reversal Zone – 114,157.68 (Critical Demand Zone)
The green zone marked as “Next Reversal Zone” is a key level to monitor:
This area aligns with historical demand, where BTC previously reversed or slowed down.
Price is likely to hunt liquidity below recent lows before a potential bullish reaction.
It’s a Smart Money zone — designed to trap breakout sellers and absorb volume for a reversal.
Traders should watch for:
Bullish engulfing patterns
Break of structure to the upside
Divergence with RSI/volume
Sweep and reclaim setup
Once the price enters this zone, MMC reversal tactics come into play — buyers may step in aggressively here.
📅 Fundamentals & Timing
At the bottom of the chart, we see upcoming U.S. economic news events, which can act as volatility catalysts. Price could reach the reversal zone just before or during high-impact news, which aligns perfectly with smart money manipulation.
Be cautious of fakeouts around news time.
Confirmation is key before entry.
🧭 Final Outlook & MMC Strategy
Trend Direction: Bearish until 114,157.68 zone is hit.
Momentum Drivers: QFL drops, strong rejection from 2x supply, absence of bullish signals.
Key Watch Level: 114,157.68 – wait for MMC reversal pattern here.
Invalidation: If price breaks and closes above the Black Mind Curve with volume.
📌 Trade Idea Summary (For Caption Use):
BTCUSD respecting MMC Black Mind Curve. 2x Supply Zone triggered QFL breakdowns. No bullish confirmation at Central Zone. Eyes on Next Reversal Block near 114,157.68. Watch for reaction and potential reversal setup. #SmartMoneyMoves
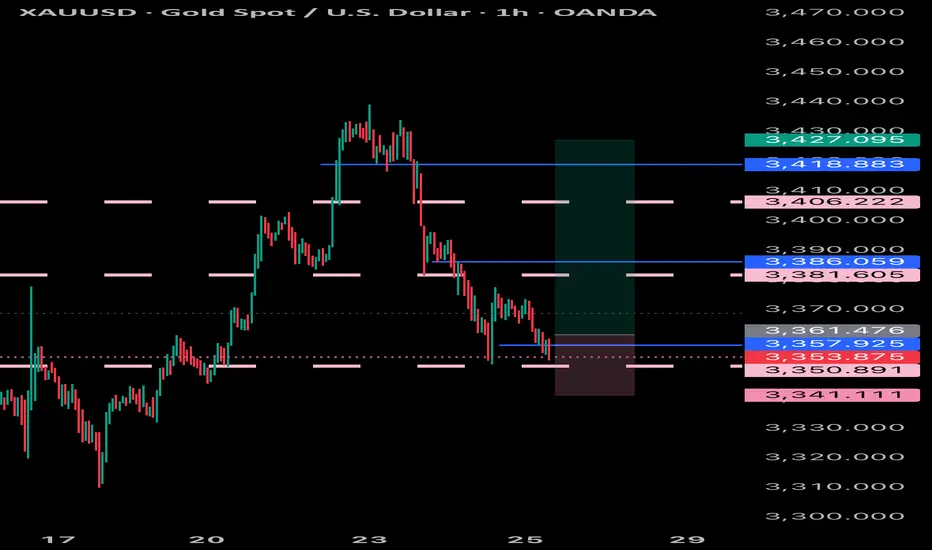
GOLD XAUUSD BUY We shall be looking to scalp a bit on the gold as it has been selling for a while now and can expect a reversal as nothing sells forever in the market, so can buy a dip and expect it to push a fair amount
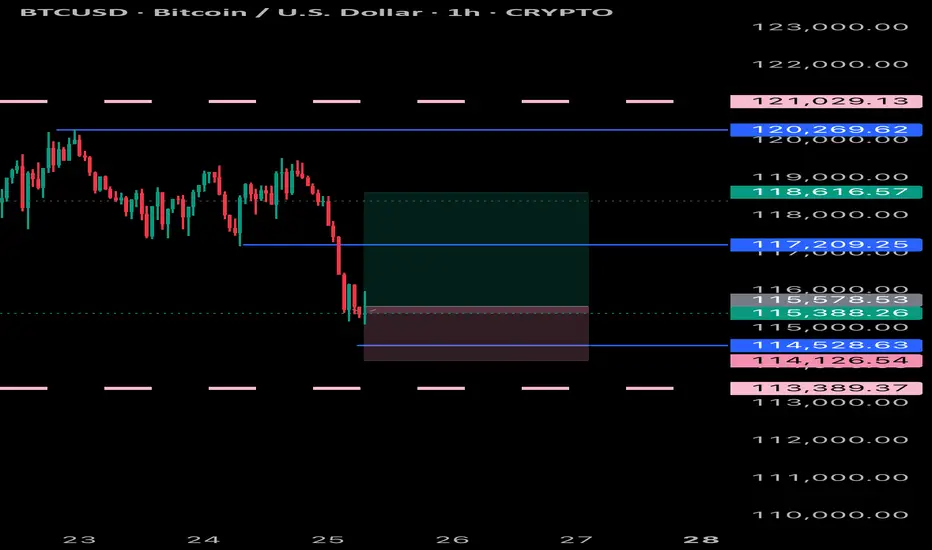
BTCUSD BUYING can expect a bullish move from bitcoin as it has dropped a fair amount and can extract a reversal to the up side due to being oversold
EUR GBP: Long EUR GBP long 'relative fundamental' trade, based on the fairly 'hawkish' ECB and also today's and yesterday's 'soft' UK data. Entry 0.8712
The risk to the trade is the fact the stop loss is not behind a solid 'upswing of note'. But this is the only moment I have to potentially trade today and I think it's worth a go.
I do think a 'risk on' trade is also viable (which is also a risk if the GBP strengthens in a positive environment). But I've chosen to go with the 'freshness' of the UK data.
EUR GBP has a low ATR, the trade has a 10 pip stop loss and 15 pip profit target.
If it's ongoing, I will close the trade before end of day to avoid weekend risk.

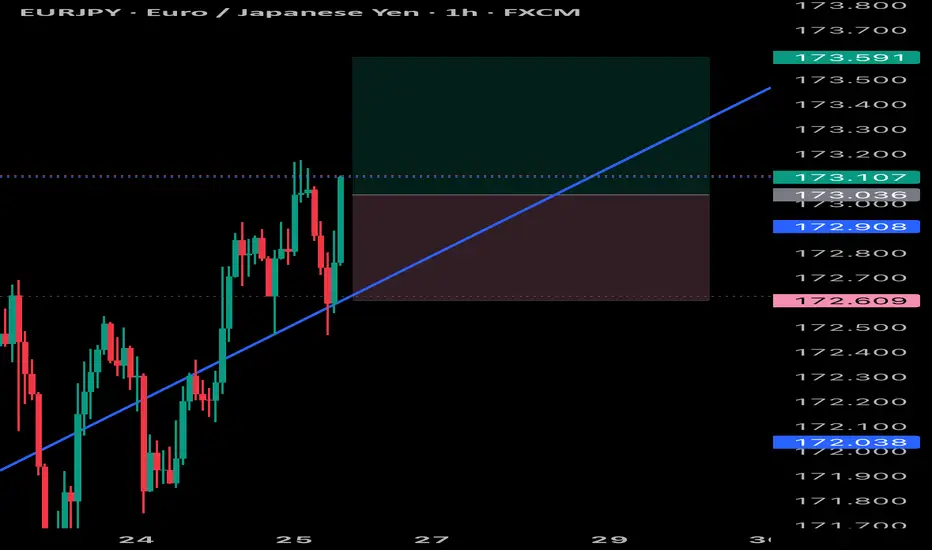
EURJPY BULLS Bullish move from Eurjpy and will keep following it, to its very top with small pullbacks coming but stay prepared can put buy stops
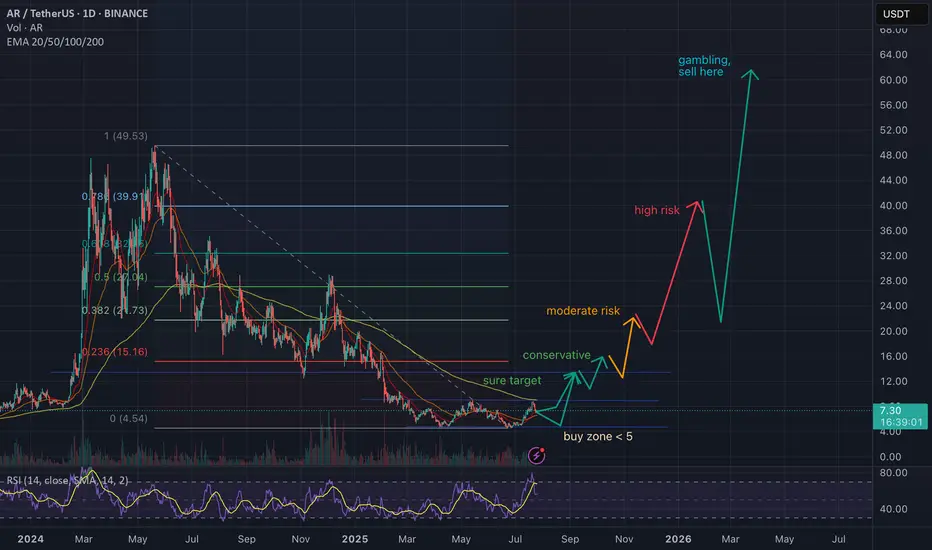
ARUSDT: Crypto Summer Game PlanBINANCE:ARUSDT
RWA + AI coin, two narratives that will be hot
Not inflationary, 99% supply circulating
People really use it for permanent storage
Main CEX liquidity is very thin in AR -> possible God candles like in previous history
Possible supply shock at late stage
Main risk is community governance and hacks. Otherwise in case of altseason this should meet the marked targets. Preferable accumulation zone is <5 USD, most probably not available anymore.
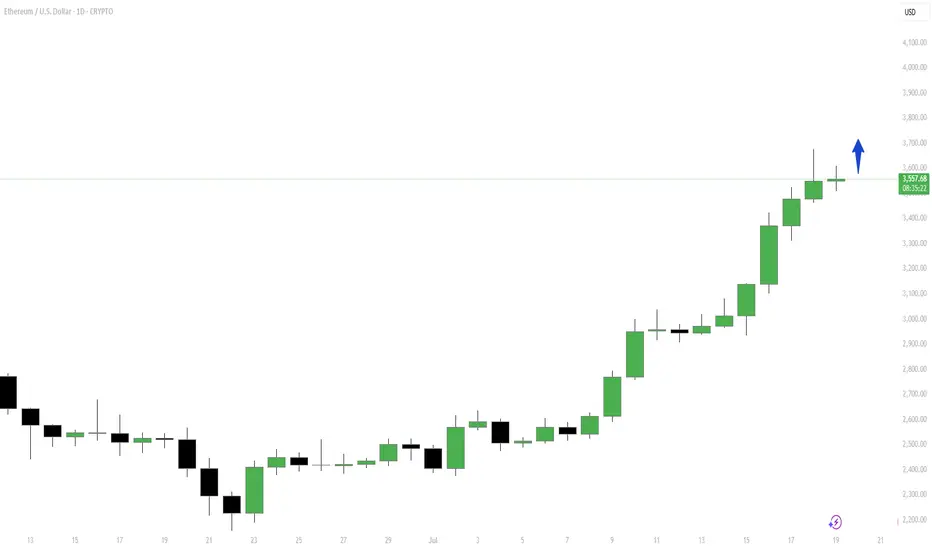
Strategy Idea: “React, Don’t Predict” ETH at Decision ZoneHey Traders, Ethereum recently made a strong move up to around $3,600. Now it’s slowing down, and we’re at a key decision point. Two things can happen from here:
Option 1 – Pullback:
If the price drops, watch the $3,200–$3,300 zone. That area could act as support. If a strong bullish candle forms there (on the daily or 4H chart), it could be a good buying opportunity.
Option 2 – Breakout:
If ETH stays above $3,550 and breaks the recent high with strong momentum, price could move toward $3,800 or even $4,000. Only buy if the breakout is clear and strong.
Basic Plan for New Traders:
Wait for confirmation before entering
Don’t buy the top
Use stop loss to manage risk
Only risk what you can afford to lose
Be patient. No setup = no trade
Reminder:
We don’t predict, we react. Let the chart show the move, then decide. Stay safe and stick to your plan.
Don't forget to follow me, boost this content, and comment if you like this strategy idea or have any questions.
-Neo
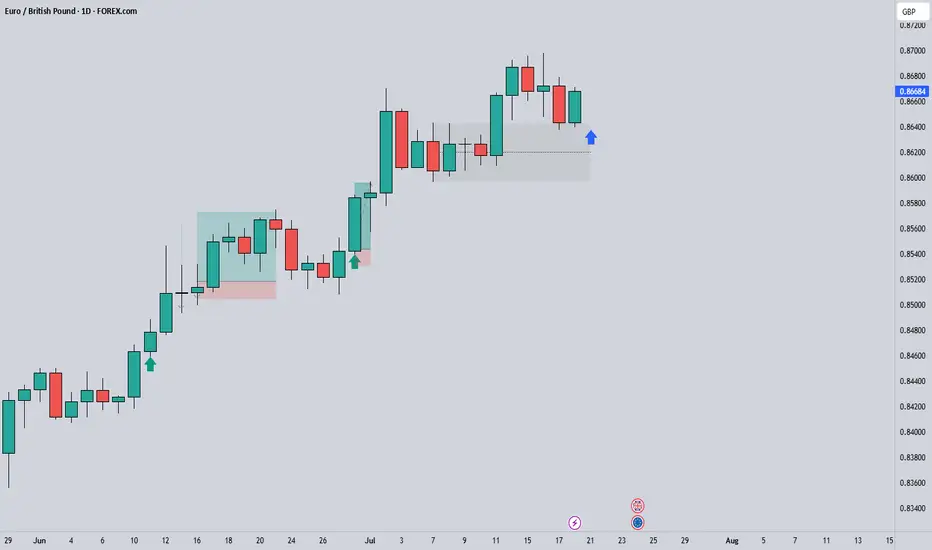
EURGBP Long Project1. Price Drivers: higher timeframe demand
2. Current Trend: up
3. Momentum: bullish
Action: Waiting for entry on the intraday timeframe (entry will be published further)
*Disclaimer: I will not accept liability for any loss or damage, including without limitation to any loss of profit, which may arise directly or indirectly from use of or reliance on such information.
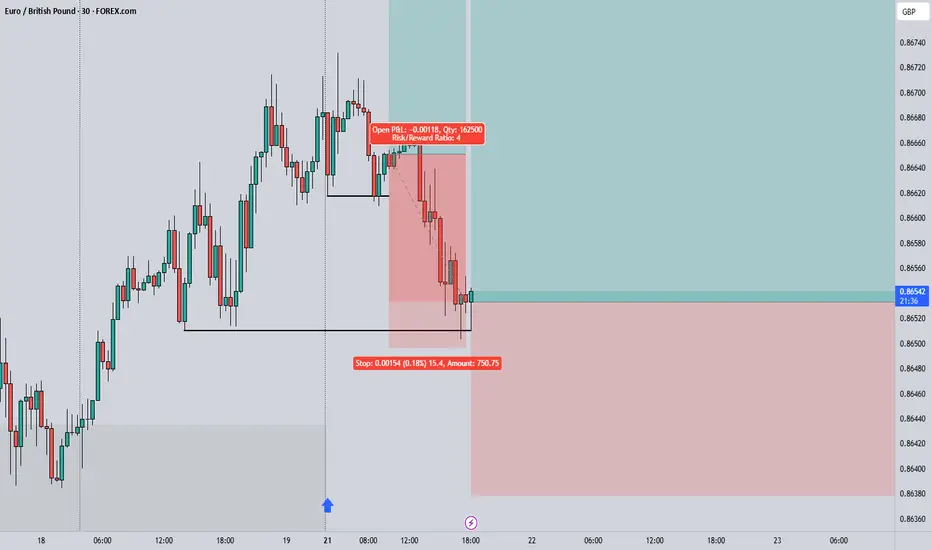
EURGBP 2nd Buy EntryEntry: 0.86533
Stop Loss (R): 0.86379
Take Profit (4R): 0.87149
*Disclaimer: I will not accept liability for any loss or damage, including without limitation to any loss of profit, which may arise directly or indirectly from use of or reliance on such information.
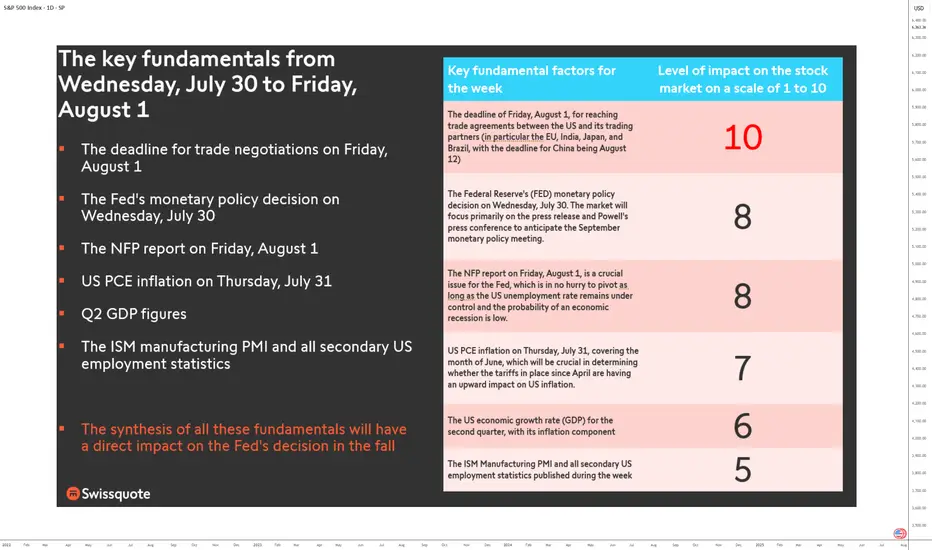
FUNDAMENTALS: THE WEEK OF TRUTH IS COMING!This is a high-stakes, high-pressure week for markets as the final days of July approach. Between Wednesday, July 30, and Friday, August 1, all the market-moving fundamentals are concentrated in a three-day window. It’s a stress test for the U.S. equity market: either it extends its bullish trend, or it enters a much-needed consolidation phase.
Three days. No more. Catalysts are so tightly packed they could shake even the steadiest traders. We’re looking at a full-spectrum stress test—monetary, economic, and geopolitical. Why so crucial? Because every major macro driver is converging in an ultra-condensed timeframe: the trade deal deadline with U.S. partners, the Fed’s policy decision, GAFAM earnings, PCE inflation, the NFP jobs report, Q2 GDP figures, and key technical barometers—all as we enter the seasonally weaker August-September period.
1) Wednesday, July 30 – The Monetary Moment of Truth
The week opens with a critical event: the Fed’s monetary policy meeting. It’s not just about rates, but forward guidance. The market stands at a crossroads. Either the Fed signals a dovish pivot for late 2025, and risk appetite returns—or it delays action, and the S&P 500, already stretched (Shiller PE Ratio back to end-2021 levels), enters a correction.
At the same time, GAFAM kick off their earnings season. U.S. tech remains the market’s beating heart. If these giants disappoint, the sector will drag down the entire market. Remember, tech accounts for 35% of the S&P 500’s weight.
2) Thursday, July 31 – PCE Inflation Decides the Direction
Next up is the Fed’s preferred inflation metric: core PCE. A critical indicator. If inflation ticks up, the autumn rate-cut narrative falls apart. Add in the second estimate of Q2 GDP and earnings from the next GAFAM batch, and Thursday becomes a pivotal day for the S&P 500. The key question: will core PCE inflation rebound, possibly influenced by tariff impacts?
3) Friday, August 1 – The Verdict: NFP and Trade Talks
NFP jobs report + trade negotiation deadline = explosive combo. By Friday, markets will have priced in the Fed, inflation, and earnings. What’s left? U.S. labor. Weak numbers could revive recession fears. Strong ones might push back the Fed’s easing timeline.
Also on the radar: trade talks. The August 1 deadline could spike volatility. And let’s not forget the China-specific deadline on Tuesday, August 12.
Conclusion: No Room for “TACO”
There’s no margin for error. No room for “TACO” (Trump Always Chickens Out). This market must deliver across the board—or the current overvaluation will be left with no safety net. The July 30 week is a true fundamental stress test. And the consequences will be swift.
DISCLAIMER:
This content is intended for individuals who are familiar with financial markets and instruments and is for information purposes only. The presented idea (including market commentary, market data and observations) is not a work product of any research department of Swissquote or its affiliates. This material is intended to highlight market action and does not constitute investment, legal or tax advice. If you are a retail investor or lack experience in trading complex financial products, it is advisable to seek professional advice from licensed advisor before making any financial decisions.
This content is not intended to manipulate the market or encourage any specific financial behavior.
Swissquote makes no representation or warranty as to the quality, completeness, accuracy, comprehensiveness or non-infringement of such content. The views expressed are those of the consultant and are provided for educational purposes only. Any information provided relating to a product or market should not be construed as recommending an investment strategy or transaction. Past performance is not a guarantee of future results.
Swissquote and its employees and representatives shall in no event be held liable for any damages or losses arising directly or indirectly from decisions made on the basis of this content.
The use of any third-party brands or trademarks is for information only and does not imply endorsement by Swissquote, or that the trademark owner has authorised Swissquote to promote its products or services.
Swissquote is the marketing brand for the activities of Swissquote Bank Ltd (Switzerland) regulated by FINMA, Swissquote Capital Markets Limited regulated by CySEC (Cyprus), Swissquote Bank Europe SA (Luxembourg) regulated by the CSSF, Swissquote Ltd (UK) regulated by the FCA, Swissquote Financial Services (Malta) Ltd regulated by the Malta Financial Services Authority, Swissquote MEA Ltd. (UAE) regulated by the Dubai Financial Services Authority, Swissquote Pte Ltd (Singapore) regulated by the Monetary Authority of Singapore, Swissquote Asia Limited (Hong Kong) licensed by the Hong Kong Securities and Futures Commission (SFC) and Swissquote South Africa (Pty) Ltd supervised by the FSCA.
Products and services of Swissquote are only intended for those permitted to receive them under local law.
All investments carry a degree of risk. The risk of loss in trading or holding financial instruments can be substantial. The value of financial instruments, including but not limited to stocks, bonds, cryptocurrencies, and other assets, can fluctuate both upwards and downwards. There is a significant risk of financial loss when buying, selling, holding, staking, or investing in these instruments. SQBE makes no recommendations regarding any specific investment, transaction, or the use of any particular investment strategy.
CFDs are complex instruments and come with a high risk of losing money rapidly due to leverage. The vast majority of retail client accounts suffer capital losses when trading in CFDs. You should consider whether you understand how CFDs work and whether you can afford to take the high risk of losing your money.
Digital Assets are unregulated in most countries and consumer protection rules may not apply. As highly volatile speculative investments, Digital Assets are not suitable for investors without a high-risk tolerance. Make sure you understand each Digital Asset before you trade.
Cryptocurrencies are not considered legal tender in some jurisdictions and are subject to regulatory uncertainties.
The use of Internet-based systems can involve high risks, including, but not limited to, fraud, cyber-attacks, network and communication failures, as well as identity theft and phishing attacks related to crypto-assets.
MY SHORT BIAS ON GBPUSDIf you're looking for an opportunity to scalp on GBPUSD, this is my BIAS, although I missed in, but my analysis is already in profits
Trap Set at the Top? Sensex Sell-Side Objective = 81,886Sensex is currently trading at 82,220 and showing early signs of a potential sell-side move based on Smart Money dynamics. After grabbing buy-side liquidity above recent highs, we’ve now entered a distribution phase.
Price has shown rejection from a premium zone, and a market structure shift is forming on lower timeframes — all pointing toward a probable move to the sell-side liquidity pool near 81,886.
This zone aligns with Smart Money's objective to tap resting liquidity below recent swing lows before any major reversal. Caution is advised for longs. Wait for confirmation if you're planning to ride the short move with the institutions. 🎯💼

Bitcoin’s Epic Run from 80K to 120K: What’s Next for BTC?Yo traders, it’s Skeptic from Skeptic Lab! 🩵 Diving into Bitcoin’s wild ride from 80K to 120K—breaking down the key supports, resistances, and what’s next for BTC.
From the $76k bounce to smashing $110K, we’re eyeing the $120K PRZ. Will it correct or keep soaring? Check the video for the full scoop! Drop your thoughts or coin requests in the comments, boost if it vibes & Let’s grow together!

Can the S&P 500's Ascent Continue?The S&P 500 recently achieved unprecedented highs, reflecting a multifaceted market surge. This remarkable performance stems primarily from a robust corporate earnings season. A significant majority of S&P 500 companies surpassed earnings expectations, indicating strong underlying financial health. The Communication Services and Information Technology sectors, in particular, demonstrated impressive growth, reinforcing investor confidence in the broader market's strength.
Geopolitical and geostrategic developments have also played a crucial role in bolstering market sentiment. Recent "massive" trade agreements, notably with Japan and a framework deal with Indonesia, have introduced greater predictability and positive economic exchanges. These deals, characterized by reciprocal tariffs and substantial investment commitments, have eased global trade tensions and fostered a more stable international economic environment, directly contributing to market optimism. Ongoing progress in trade discussions with the European Union further supports this positive trend.
Furthermore, resilient macroeconomic indicators underscore the market's upward trajectory. Despite a recent dip in existing home sales, key data points like stable interest rates, decreasing unemployment claims, and a rising manufacturing PMI collectively suggest an enduring economic strength. While technology and high-tech sectors, driven by AI advancements and strong earnings from industry leaders like Alphabet, remain primary growth engines, some segments, such as auto-related chipmakers, face challenges.
The S&P 500's climb is a testament to the powerful confluence of strong corporate performance, favorable geopolitical shifts, and a resilient economic backdrop. While the immediate rally wasn't directly driven by recent cybersecurity events, scientific breakthroughs, or patent analyses, these factors remain critical for long-term market stability and innovation. Investors continue to monitor these evolving dynamics to gauge the sustainability of the current market momentum.

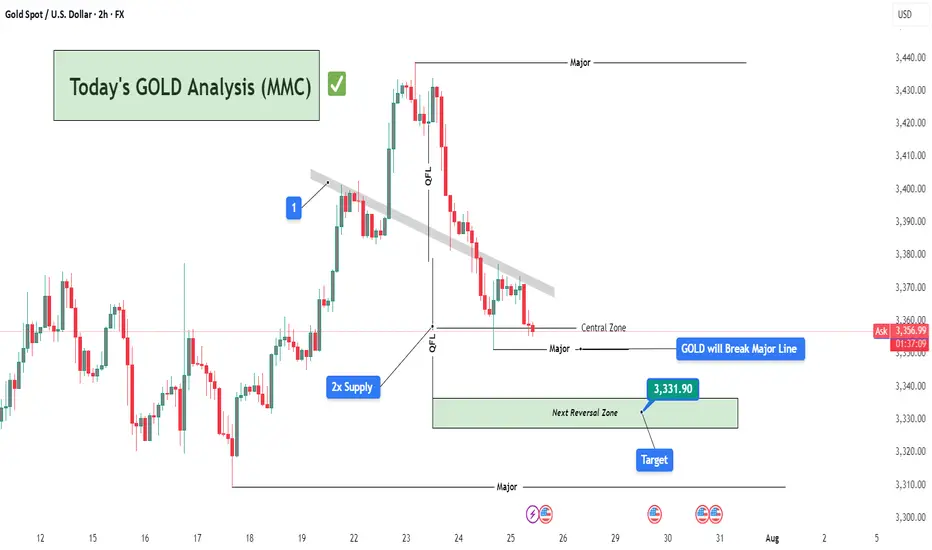
Today's GOLD Analysis (MMC) – Sell Bias Continues To Next TargetChart Overview:
This 2-hour GOLD (XAU/USD) chart showcases a clear bearish structure in line with the Mirror Market Concepts (MMC) methodology. Price action is respecting key supply zones and continues to reject significant levels, confirming the dominance of sellers in the short-term structure.
🔍 Key Technical Elements:
1️⃣ Break of Trendline (MMC QFL Entry Model)
The descending grey trendline marks consistent lower highs, showing clear bearish pressure. The breakout and rejections around this trendline zone (annotated “1”) confirm it as a strong supply area. This breakdown set the stage for a QFL (Quick Flip Liquidity) drop.
🧊 2x Supply Zone (High Confidence Rejection)
The 2x supply label highlights an area where price rapidly reversed with aggressive bearish momentum. This zone was tested and respected again, leading to further downside pressure, reinforcing the idea of institutional selling interest from that level.
📉 QFL Levels & Central Zone
Two major QFL drops are evident, where price broke previous demand structures and created new supply imbalance. The Central Zone currently acts as short-term support, but price is hovering just above it with weak bullish reaction, indicating potential for further breakdown.
🎯 Target & Reversal Zone – 3,331.90
The green zone below marks the Next Reversal Zone, with a highlighted price target at 3,331.90. This is where:
Previous liquidity was absorbed.
Demand imbalance may attract buyers again.
MMC reversal structures might be anticipated.
This zone aligns perfectly with the broader MMC concept of flipping between major zones and reversal blocks.
🧠 Trade Idea & Strategy (MMC Traders’ Minds)
Current Bias: Bearish
Entry Trigger: After rejection from trendline & 2x supply area.
Stop-Loss Suggestion: Above the trendline or recent supply wick (~3,375-3,380).
Take-Profit Zone: Primary TP at 3,331.90, with eyes on lower reversal targets if momentum persists.
Market Behavior: Controlled by sellers, liquidity sweeps seen, weak demand below Central Zone.
📌 Key Events to Watch
As marked at the bottom, major US news events are scheduled between July 30th and 31st, which could act as catalysts for price acceleration toward the reversal zone or cause sharp volatility. Plan accordingly.
🧭 Conclusion:
Gold is respecting bearish market structure under the MMC model. With clear QFL breakouts, rejection from 2x Supply, and weak bullish attempts near the Central Zone, this chart favors short setups targeting the 3,331.90 zone. MMC traders should monitor price action closely within the Reversal Zone for potential buy signals or trend continuation if sellers remain aggressive.
Eurusd ShortFX:EURUSD
Yesterday there was a false breakdown of the level after which we saw a return to the range and a breakdown of the trend line, today I expect the removal of Asian hai and a trip for liquidity