Ethereum gains momentum: SEC green light and Banks ShiftEthereum gains momentum: SEC green light and JPMorgan’s historic shift
By Ion Jauregui – Analyst at ActivTrades
Ethereum once again takes center stage in financial markets after a week full of positive signals: on one hand, the long-awaited clarification of its regulatory status by the SEC; on the other, the unexpected opening of JPMorgan to cryptocurrencies. All this in a context of growing institutional interest and corporate adoption.
Washington clears the path: ETH is a commodity
The chairman of the SEC, Paul Atkins, has resolved one of the biggest uncertainties in the crypto ecosystem: Ethereum will not be treated as a security, but as a commodity. In other words, it falls outside the scope of the SEC’s strictest regulations and is placed on the same level as bitcoin from a regulatory standpoint. This shift, which ends years of ambiguity, comes just as Ethereum spot ETFs begin to gain traction. On July 16 alone, these products recorded a net inflow of $726 million, reflecting strong demand from large investors. By way of explanation:
Security: A financial instrument representing a share in a company or a credit, such as a stock or bond. It is subject to financial market regulation (such as the SEC in the U.S.), especially regarding transparency, registration, and investor protection.
Commodity: A standardized tradable good, often raw, such as oil, gold... or bitcoin, according to regulators. It does not imply any ownership rights in a company and is not subject to the strict regulation applied to securities, but is instead overseen by other agencies like the CFTC.
JPMorgan breaks with the past and moves closer to cryptocurrencies
Jamie Dimon, CEO of JPMorgan and until recently a staunch critic of bitcoin, has made an unexpected move: the bank is studying the possibility of offering loans backed by cryptocurrencies like BTC and ETH. The system would allow clients to obtain liquidity in dollars without selling their crypto assets, by depositing them as collateral.
The bank would not directly custody these assets but would delegate that function to specialized providers such as Coinbase Custody. Although still in an exploratory phase, this represents a radical change in the relationship between big banking and the crypto world.
Trump Media, Western Union and Polymarket stoke the crypto narrative
It’s not just banks that are positioning themselves. Trump Media & Technology Group (TMTG) confirmed a $2 billion investment in bitcoin, making it the fifth publicly traded company with the largest BTC holdings in the world. The company is also preparing the launch of its own token on Truth Social, its social network.
Meanwhile, Western Union is exploring the use of stablecoins to improve the efficiency of international transfers, while Polymarket is studying the launch of its own stablecoin or a partnership with Circle (USDC). All this is happening after the recent approval of the GENIUS Act, which for the first time regulates these types of assets in the U.S.
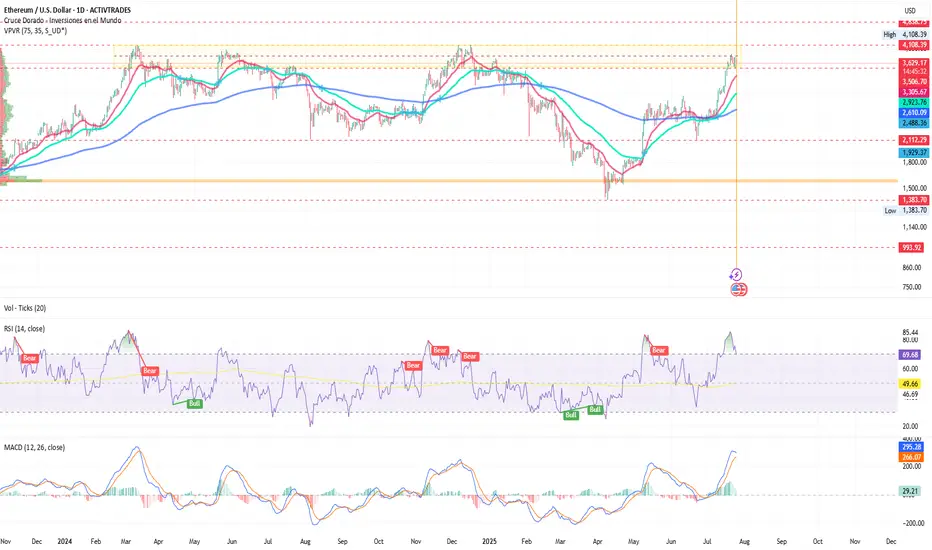
ETH/USD analysis: Beginning of a new bullish phase?
On the charts, Ethereum has responded to the macro and political environment with sustained recovery since April, entering a partial consolidation phase during several months this year. After holding the support level around $2,579, and since the golden cross on the 10th of this month, it has consolidated a price expansion leading it to test a new consolidation zone around $3,500. ETH now aims for more ambitious levels that could push the commodity towards recent highs of $3,857.67 and potentially break through to $4,000.
Currently, the price is within a range it has tested for the fourth time. If it fails to break out, we could see a pullback towards $2,700 or even a return to previous supports at $2,112 and the long-term point of control at $1,586.
Key support: $2,579
Immediate resistance: $3,857.67 (recent highs)
Target zone: $3,850 – $4,000 if a clean breakout occurs
Danger zone: Below $2,880, bearish pressure could return
Ethereum ready to make the leap
With the SEC’s legal backing, a recent surge in volume, the rise of spot ETFs, and the shift in traditional banking led by JPMorgan, Ethereum is cementing its role as a strategic asset in the new financial era, ready to lead the next phase of crypto adoption. This time, with Wall Street watching closely. Ethereum appears ready to play a leading role in the next stage of integration between traditional and digital finance — and it seems that big banks are betting heavily on ETH.
Ethereum is no longer in bitcoin’s shadow. Today, it stands as a key player in bridging traditional finance and the digital future.
*******************************************************************************************
The information provided does not constitute investment research. The material has not been prepared in accordance with the legal requirements designed to promote the independence of investment research and such should be considered a marketing communication.
All information has been prepared by ActivTrades ("AT"). The information does not contain a record of AT's prices, or an offer of or solicitation for a transaction in any financial instrument. No representation or warranty is given as to the accuracy or completeness of this information.
Any material provided does not have regard to the specific investment objective and financial situation of any person who may receive it. Past performance and forecasting are not a synonym of a reliable indicator of future performance. AT provides an execution-only service. Consequently, any person acting on the information provided does so at their own risk. Political risk is unpredictable. Central bank actions can vary. Platform tools do not guarantee success.
Fundamental Analysis
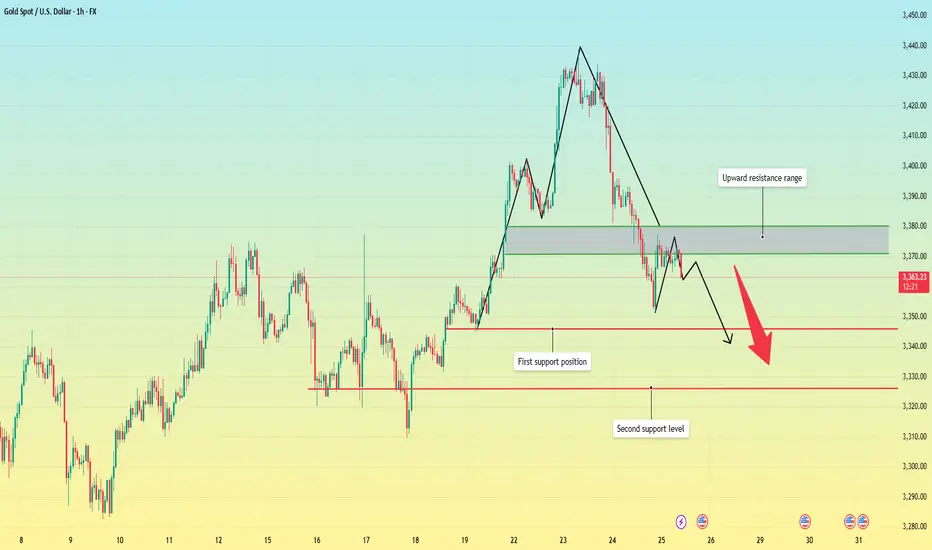
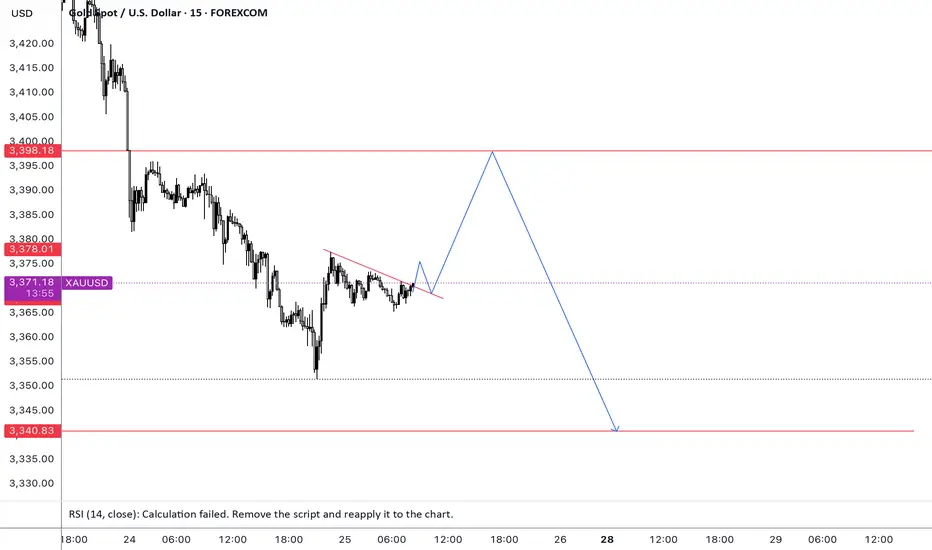
Gold is weak. Beware of lows.On Thursday, the dollar index ended a four-day losing streak thanks to the progress of the fund between the United States and its trading partners.
As signs of easing global trade tensions curbed demand for safe-haven assets, gold fell for the second consecutive trading day, and yesterday it hit the 3350 bottom support level.
From the 4-hour chart
although it rebounded to the 3370-3380 range after hitting 3350. But it can be found that the current rebound is actually weak, and it is still maintained at 3360-70 for rectification. At present, the bottom of the 4-hour bottom is absolutely supported at 3340-3335. The rebound high is around 3375. As of now, gold has not rebounded above 3375, and gold is actually in a weak position.
Secondly, from the hourly chart, the weakness is even more obvious. The high point on Thursday was around 3395. Today's current high point is around 3375. It can be seen that if the bottom falls below the 618 position 3350 again, it will directly touch around 3335. It coincides with the target position of 3340-3335 in the previous 4-hour chart.
Therefore, it is not possible to buy the bottom and go long today. Be alert to the possibility of further touching 3340-3335.
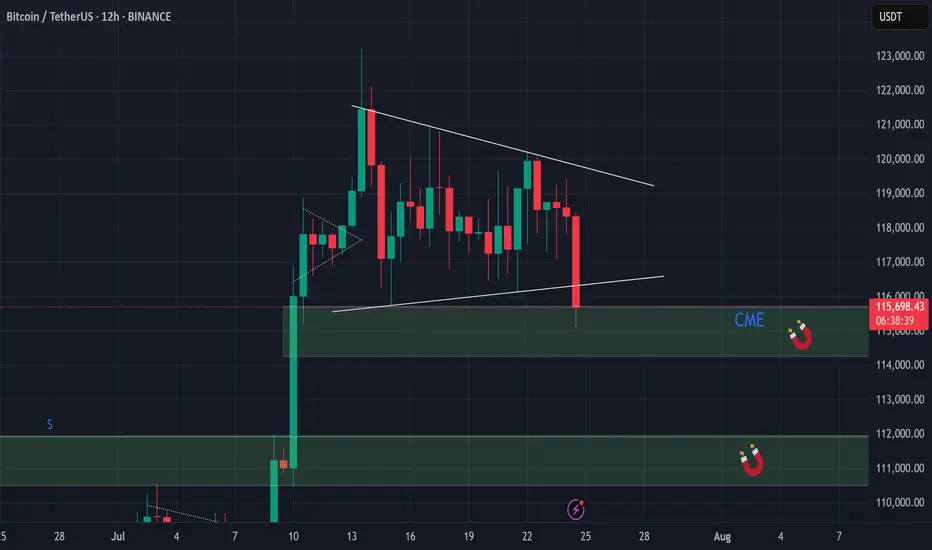
BTC - shake out!BTC Correction 📉
After observing the recent price action, it now seems clear that the inevitable correction is taking the stage.
I revisited the chart and drew potential bullish trendlines for a bull pennant on the 12h timeframe, but even those appear to be breaking down, confirming that we're currently experiencing a clear shakeout/correction.
I'm now expecting at least a full fill of the CME gap, and potentially even a drop toward $112,000.
Keep in mind that the CME price often lags behind spot prices on other exchanges, so in order to properly fill the gap down to $114,000 , a dip toward the $112,000 zone remains a very realistic scenario.
Take note that a lot of new retail investors are coming in recently by all the sounds of a ‘’possible altseason’’ around the corner, especially during the summer holidays when they have more time on their hands to look deeper into this.
all this in combination with a lot of long positions around and beneath the price range of 114k and 116k I expect a shake out and liquidity grab.
The only bullish short-term possibility that remains would be if this turns out to be a massive fakeout from the pennant structure, but I find that unlikely.
Personally, I’m watching for signs of a bottom sometime next week before looking for new upward momentum.
The BTC.D began a dive towards 60%, still: BTC remains dominant, which strongly impacts altcoins.
That’s why I’m currently staying cautious and holding off on entering new trades till we see clear support.
Let’s reach the summit together!
📝 Note
I'm currently building a portfolio of crypto analyses here on TradingView. Your feedback, tips, or validation are greatly appreciated, especially as I continue developing this skill further!
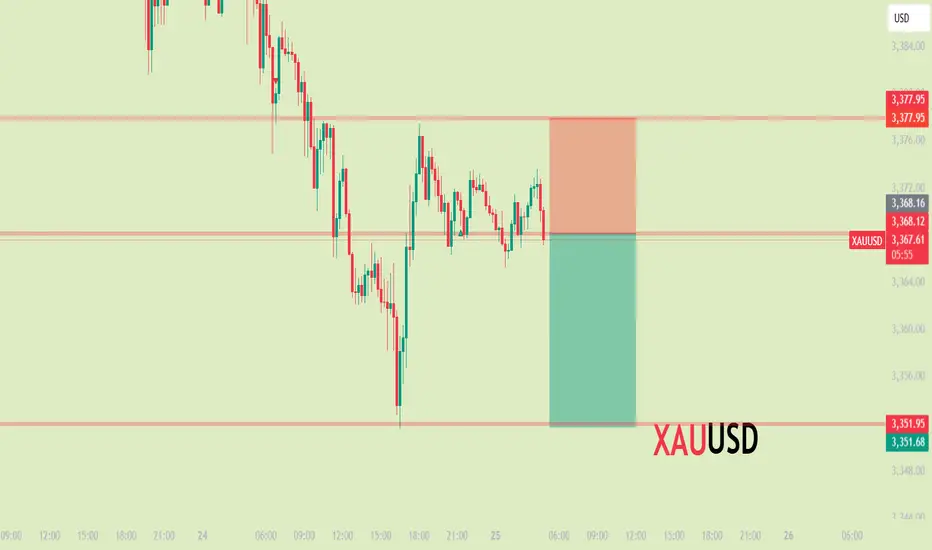
GOLD → Countertrend correction. Where will growth begin?FX:XAUUSD faced pressure in the 3430 zone, traders moved into profit-taking mode, triggering a correction. The price entered the sell-off zone...
On Thursday, gold is trading below $3400 as traders assess progress in US-EU trade talks and await preliminary PMI data from the US and the EU. These indicators could influence expectations for Fed and ECB rates. Optimism is being bolstered by reports of trade agreements between the US and Japan and other countries. The ECB is expected to keep rates unchanged, while the probability of a Fed rate cut in September is estimated at 60%. Investors are also watching Trump's conflict with Powell amid his visit to the Fed. Technically, the daily market structure is not broken, and a correction is forming within acceptable limits.
Based on the current direction, the market may test the intermediate bottom: trend support, the 3345-3320 area.
Resistance levels: 3375, 3383, 3400.
Support levels: 3345, 3320
A retest of resistance at 3375-3383 is possible. If the bears keep the price below this zone, the metal may continue its correction phase towards the zone of interest indicated on the chart. Local sell-offs have not yet broken the bullish daily structure.
However, the absence of a downward impulse and consolidation in 3375 - 3383 with a subsequent breakout of local resistance could increase demand again, which would generally lead to premature growth to 3400 - 3435.
Best regards, R. Linda!

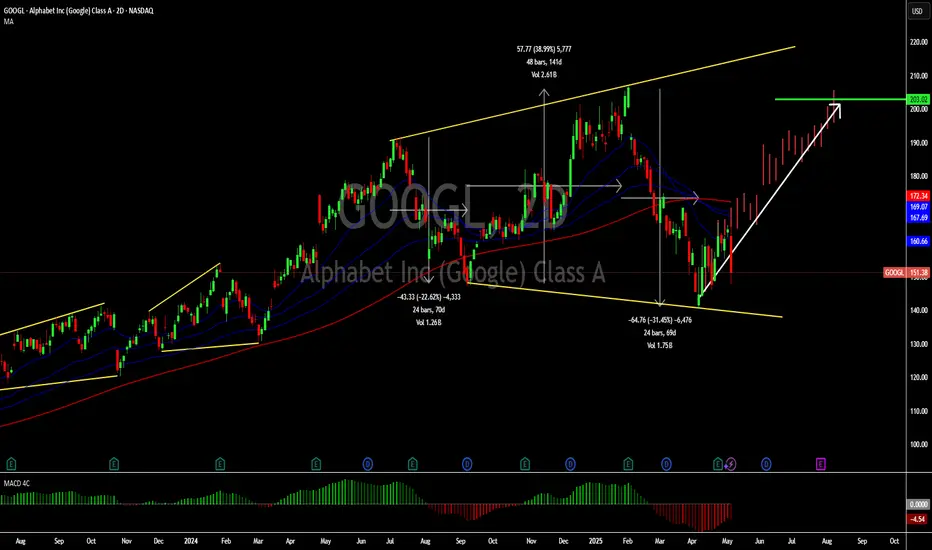
Google: A compelling buy at the current priceHello,
As Warren Buffett famously said, "Be fearful when others are greedy, and greedy when others are fearful." This mindset is particularly relevant right now with Alphabet Inc.
Despite being a company whose products we use daily—and will likely rely on even more in the future—Alphabet's stock recently declined following comments from Apple’s Eddie Cue regarding a drop in Safari search traffic. This has sparked concerns about Google's dominance in search and its ad revenue streams. Analysts are also highlighting growing competition from AI-driven platforms such as OpenAI, Grok, and Perplexity, raising questions about the future growth of Google Search.
While the headlines may seem discouraging, we remain confident in Google’s enduring leadership in the search space, underpinned by its unmatched scale, infrastructure, and user base. We also believe the market continues to underestimate how far ahead Google truly is in artificial intelligence.
In our view, this dip represents a strategic buying opportunity for long-term investors. Below is our in-depth analysis of Alphabet and why we believe it remains a strong investment.
Alphabet, Inc is a holding company, which engages in the business of acquisition and operation of different companies. Google Services includes products and services such as ads, Android, Chrome, devices, Google Maps, Google Play, Search, and YouTube. Google Services generates revenues primarily from advertising; fees received for consumer subscription-based products such as YouTube TV, YouTube Music and Premium, and NFL Sunday Ticket, as well as Google One; the sale of apps and in-app purchases and devices.
KEY NOTES FROM THE Q1 2025 EARNINGS CALL
Revenue up to $ 90.23 Billion (Q1 2024: $ 80.54 Billion)
Operating income for quarter one 2025 at $ 30.61 Billion (Q1 2024: $ 25.47 Billion)
Net income for quarter one 2025 at $ 34.54 Billion (Q1 2024: $ 23.66 Billion)
Diluted Earnings per share closed at $ 2.81 as at 31st March 2025 (2024: $ 1.89). Alphabet’s Board of Directors declared a quarterly cash dividend of $0.21 representing a 5% increase from the previous quarterly dividend of $0.20.
Cash and cash equivalents remained flat as of the end of March 31 2025 at $ 23.26 Billion (2024: $ 23.47 Billion)
Google advertising continues to do the heavy lifting for the alphabet business contributing $ 66.89 Billion of the total $90.23 Billion. Google Services includes products and services such as ads, Android, Chrome, devices, Google Maps, Google Play, Search, and YouTube. Of this amount, the breakdown is as below
•Google search & other: $ 50.70 Billion
•Youtube ads: $ 8.93 Billion
•Google Network: $ 7.26 Billion
Other services offered by the platforms contributed revenues as below
Google subscriptions, platforms & devices: $ 10.38 Billion
Google cloud: $ 12.26 Billion
Other bets: $ 450 million. Other Bets is a combination of multiple operating segments that are not individually material.
Hedging gains: $ 260 million
The company announced a share buyback program of up to $70 billion of its class A and class C shares. The buy backs will be executed through open market purchases or through privately negotiated transactions.
Business Opportunities/Strengths
Alphabet’s advertising business is firmly embedded in digital advertising budgets, allowing it to capitalize on the ongoing growth in digital ad spending.
The significant cash flows from advertising enable Alphabet to reinvest in growth areas like Google Cloud, AI-enhanced search, and innovative ventures such as Waymo. (Waymo is Alphabet's autonomous driving technology subsidiary, focused on developing self-driving cars and related technologies.)
With a strong foothold in the public cloud market, Alphabet has a substantial opportunity as a major provider for enterprises transitioning to digital platforms.
Risks to consider
Although Alphabet is working to diversify, text-based advertising remains its primary revenue source, presenting a concentration risk.
Ongoing investments in emerging, sometimes unproven technologies through its Other Bets segment continue to strain cash flows.
Increasing regulatory scrutiny of Alphabet's search dominance worldwide could lead to significant market disruptions through structural reforms.
Recommendation
We view Alphabet as a solid business with diverse solutions ranging from advertising, cloud business and driverless cars as well. While we acknowledge that the antitrust cases have continued to make headlines, we encourage investors to remain invested and focused on the business’s strengths. The business has unique products that will have the ability to remain leaders for a very long period of time. Android is the operating system for the majority of the world’s smartphones with more than two-thirds of all smartphones in the world running it. Virtually all smartphones, other than those manufactured by Apple, run on Android. We see this remaining as a google strength for a very long time. The Google Play Store’s unmatched ecosystem creates significant barriers for competing operating systems, limiting their access to critical applications. The recent correction on US technology companies provides us with a solid buying price for some of these great companies. Alphabet alone corrected by about 31% and has since bounced back.
We see the current price as a great entry price for long term investors based on both technical and fundamental analysis with a target price of $ 203.
Buyers in Asia are setting the toneBuyers in the Asia time zone in the S&P 500 daily chart is setting a positive tone for Friday's action. This creates an expectation of a positive close going into the weekend

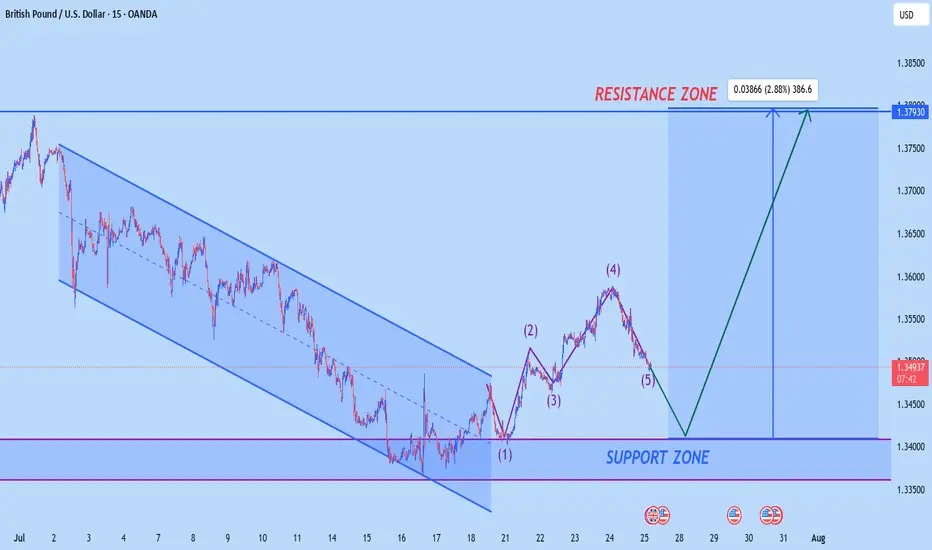
GBPUSD NEW BULLISH LOOKAccording to M15 analysis gbpusd market is near to touch support zone
it is very best chnace for buyer to buy from support level
dont be greedy use money managment
TRADE AT YOUR OWN RISK
REGARD ALBERT
EURUSD pullbackYesterday, EURUSD attempted to continue its bullish move but was rejected at 1,1788.
Keep an eye on whether it has the strength for another push higher. If it fails again, a correction is more likely to follow.
The first support levels to watch are 1,1699 and 1,1644.
Next week, the FED’s interest rate decision is due.
That news will likely determine both the direction and timing for entry.

Gold price analysis July 25Gold Analysis – D1 Uptrend Still Maintains, But Needs New Momentum
Yesterday’s trading session recorded a D1 candle closing above the Breakout 3363 zone, indicating that buying power in the US session is still dominant. This implies that the uptrend is still being maintained, although the market may need a short-term technical correction.
In today’s Tokyo and London sessions, there is a possibility of liquidity sweeps to the support zone below before Gold recovers and increases again in the New York session.
Important to note:
The uptrend will only be broken if Gold closes below the 3345 zone on the D1 chart.
In this case, the 3320 level will be the next support zone to observe the price reaction and consider buying points.
For the bullish wave to continue expanding towards the historical peak (ATH) at 3500, the market needs stronger supporting factors, which can come from economic data or geopolitical developments.
📌 Support zone: 3345 – 3320
📌 Resistance zone: 3373 – 3418
🎯 Potential buy zone:
3345 (prioritize price reaction in this zone)
3320 (in case of breaking through 3345)
🎯 Target: 3417

Gold fluctuated downward. Or it will continue.Gold was blocked near 3393 in the early trading on Thursday and began to fluctuate and fall, falling to 3351 as low as possible, then stopped falling and rose, and after rebounding near 3377, it was blocked and fell back to 3370 and fluctuated up and down, and the daily line closed with a negative line.
After three consecutive positive rises from last Friday to Tuesday this week, gold ushered in a turning point on Wednesday. On Thursday, it continued to fall and broke through the 5-day and 10-day moving averages, and the short-term market weakened. From the overall structure, the rising channel since June 26 remains valid. The highs on Tuesday and Wednesday approached the upper edge of the channel and then fell. The current price turned to fall and approached the lower edge of the channel.
There are two key positions for the support below: the first support level is near 3345, which is the lower edge support of the current rising channel; the second support level is near 3325, which is the trend line support formed by the connection of the previous low points.
From the 4-hour chart, the 3351 low point and the rebound resistance level can be used as a reference for today's long-short game. The breaking of key support and resistance will determine the trend direction of the next stage.
Operation strategy:
Short near 3375, stop loss 3385, profit range 3350-3330
Long near 3330, stop loss 3320, profit range 3350-3370
The Markets, the Rabbi and the Goat...It’s funny how sometimes markets react like people in old jokes…
They scream when things get bad, then cheer wildly when things return to how they were — as if something amazing just happened.
Let me tell you one of those jokes.
It’s about a house, a rabbi… and a goat.
A man goes to the Rabbi:
“Rabbi, my house is too small. The kids are screaming, my wife’s yelling, I’m losing my mind!”
The Rabbi calmly replies:
“Bring in the chicken.”
Two days later:
“Rabbi, it’s worse!”
Rabbi:
“Now bring in the duck.
Then the pig.
And finally… the goat."
Now the house is in complete chaos. Smell, noise, no space to move or breathe.
The man returns, ready to break down:
“Rabbi, this is hell!”
The Rabbi smiles:
“Now take them all out.”
A few days later, the man comes back glowing:
“Rabbi… it’s incredible! So much space! So quiet! So fresh!”
📉 Now, 2025 markets
In April, Trump imposed tariffs.
Markets fall sharply. Analysts scream recession. Headlines go full drama.
Recently, “brand new deals” have been announced.
Markets explode to new all-time highs.
Applause. Celebration. “Stability is back.”
But if you read the fine print…
The deal is basically the same old deal. Renegotiated. Repackaged.
Just without the goat.

Ethereum Price Target $3,120 by Sunday?Ethereum short position Price Target $3,120 by Sunday ? Negative divergence on the hrly RSI.
Exhausted the 15 minute positive divergence when bouncing off the EMA 200 on the 1 Hour chart. First profit target is $3,350 second is $3,120. I am usually wrong with my estimations... I would recommend the opposite. So go long!

XAUUSDXAUUSD Updated in 15M :
The gold signal is marked on the chart based on the latest price changes and the supply and demand in the market. These points include the entry point, stop loss, and take profit
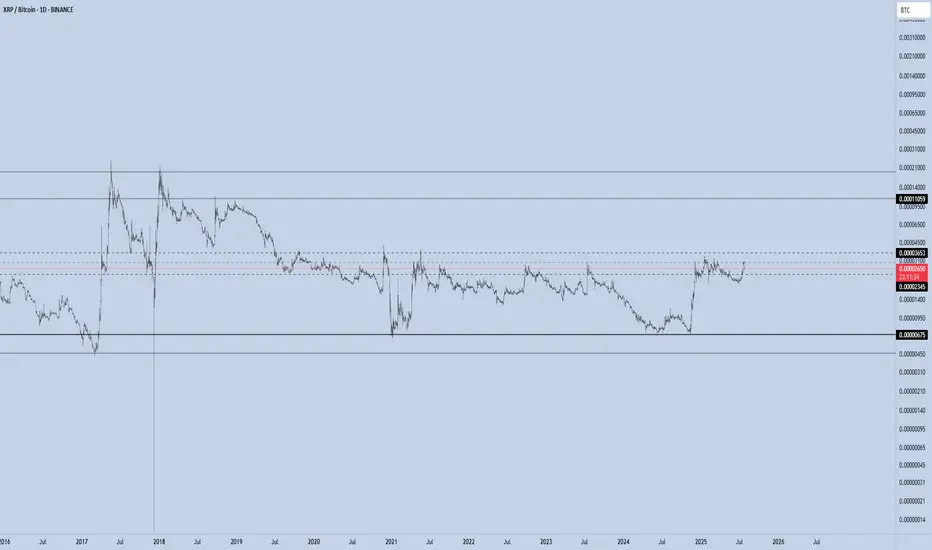
XRP/BTC – Channel Midline in Play The XRP/BTC pair trade inside a multi-year channel, with price currently testing the midline of this structure — a pivotal level that could define the next macro leg.
If bulls manage to break the midline to the upside and successfully retest it as support, the upper boundary of the channel becomes the next major target.
🔼 Upside Scenario:
A confirmed breakout above the midline would signal structural strength and likely lead to a rally toward the upper channel resistance.
If this move aligns with BTC dominance dropping below the 60% threshold, we could see a full-blown altseason emerge.
Under such conditions, historical XRP/BTC behavior suggests that XRP/USD could reach $12–$24.
🔽 Downside Risk:
Losing the mid-channel from here would weaken the structure and invalidate the breakout thesis.
In that case, XRP/BTC would likely rotate back toward range lows, and a defensive strategy is warranted.
Macro Implication:
The 60% BTC Dominance level remains critical. A clean breakdown below it historically marks the beginning of altseason, where high-beta plays like XRP against BTC have outperformed. XRP’s current posture within the channel reflects this high-stakes moment.
BTC-Alpha-"Exhaustion Zone" Update📍All Eyes on $119,300
Why? Because that’s the line that could break the bearish narrative.
A clean push above = bulls showing real strength — not just surviving, but swinging.
It might look like BTC is doing nothing… but under the hood, the chart is very much alive.
If bulls can’t break the descending trendline, it’s not just hesitation — it’s exhaustion.
And when bulls run out of gas?
The High-Powered Short Zone starts pulling like gravity.
—
🔸 Chart Patterns in Play
🟥 Bear Flag / Distribution Box
• Price is consolidating beneath a lower high + descending trendline
• Every rally attempt has fizzled inside the Exhaustion Zone
• Repeated failures at $119,300 = a clear ceiling
🟩 Coil Within Compression
• Higher lows pushing up against downtrend resistance
• Price is coiling tight — and compression always precedes expansion
• A breakout (or breakdown) is coming… the spring’s loaded
—
🧭 What to Watch
🔓 Break above $119.3K with volume = bull momentum resumes
❌ Break below $117K = bear flag confirmed → welcome back to the High-Powered Short Zone
—
Stay Sharp. Don’t confuse quiet charts with quiet outcomes.
BTC is gearing up for a move that won’t whisper.


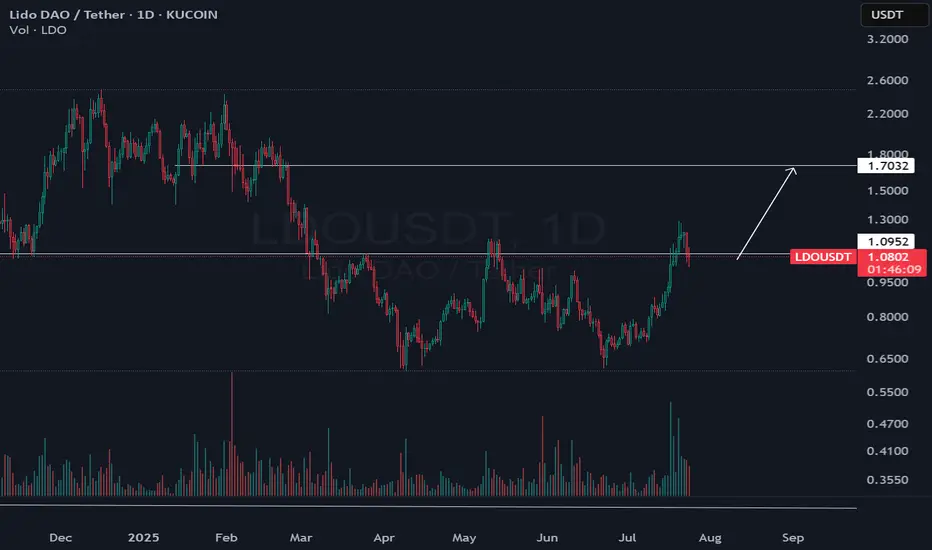
Ldo setupCrypto will have another long leg and according to my comprehensive analysis, this pump to the $1.7 range could happen for Lido.
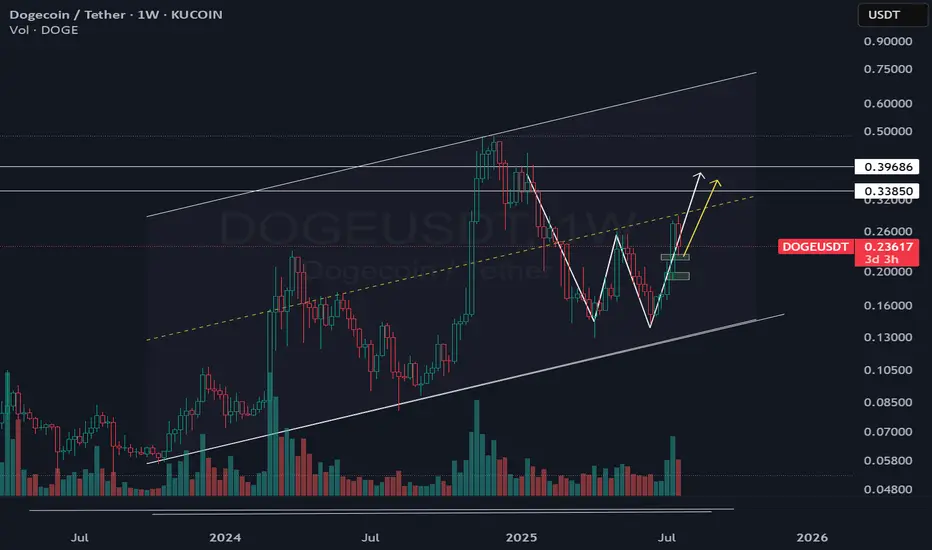
Doge is ready to complete double bottom!I'm closely monitoring DOGE as it approaches a critical technical zone. Based on recent price action and volume behavior, there’s a strong possibility to pump!
[USDJPY] Trade ideaJust entered this long position on this forex pair for an upside move.
Trying to catch the continuation of the trend on reversal pattern.
Great Trade !
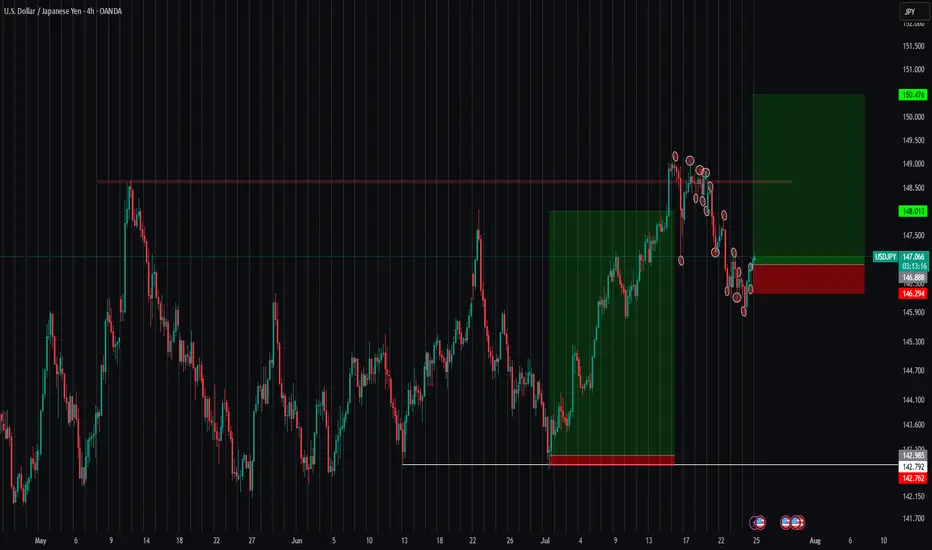
A PICTURE OF THE SURPOSE BULLISH MOVEMENT As analyzed in my previous poste , we had some quick fakes outs but the direction was confirmed to be bullish.
as we see we hope to ride it to the TF
THE TREND IS YOUR FRIEND

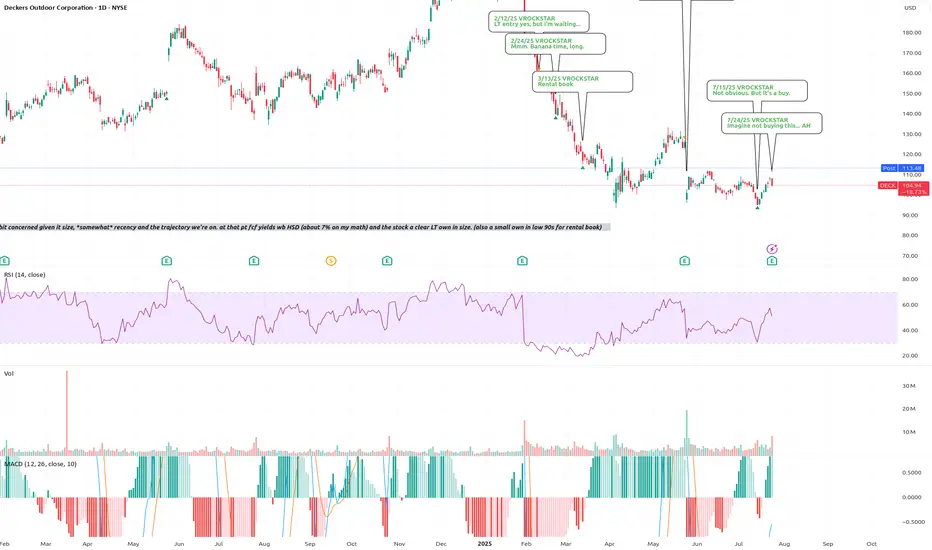
7/24/25 - $deck - Imagine not buying this... AH7/24/25 :: VROCKSTAR :: NYSE:DECK
Imagine not buying this... AH
- amazing to listen to the mental degradation of "sell side analysts".
- the quarterly ritual when real shareholders must endure management answering the room temperature IQ questions from these "research" providers is a circus
- right now there's a sell side "analyst" demanding an explanation for how 1 + 1 = 2. "put some meat on the bone" he says
- then he interrupts
- it's really amazing the way Elon handles these retards, i wish more mgmt teams would simply tell these folks the truth
- but alas
results is a smash. forget the minutia
- big revenue beat
- key brands growing (lol NYSE:NKE is not even growing and trades 2x multiples)
- buying back shares
- DTC is a tailwind
so weird AH action to see +15-20% then retrace to +2%
i'll be sizing this up and will respond tmr/ what i'm deciding. will be taking the 6x leverage on 1% 6mo ITM leverage to probably 2-3x leverage on 18 mo (jan '27) expires and targeting a gross of ~10%.
be well. enjoy.
V