$47 for Mr. 47th himself? TA aside, fundamentally its a no brainer. No matter how much you hate him, there is no reason a stock that has half of its market cap ($2 Billion) in CRYPTOCAP:BTC should stay at the market cap of $5 Billion.
Next time there is a pump rally in Bitcoin, this thing will join in on the fun.
$47 is not unrealistic. That would set the stock at around a $10-$15 Billion Market Cap value.
Fundamental Analysis

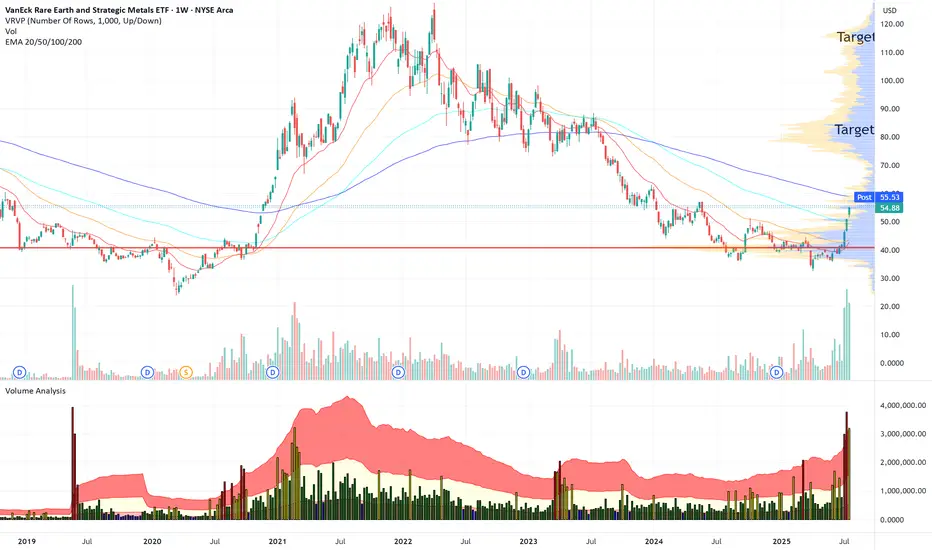
REMX Long - Buy and hold tradeThe price of ETF REMX is increasing fast on high volume. This is one of the best signs to buy. In this situation I prefer a buy and hold trade. Just my personal view - no financial advice!
Bitcoin, SPX, Ethereum, Tesla: Whats Next? BTC appears to be showing distribution signs.
I do believe BTC local top is in, but alt coins like Ethereum can still push a bit higher.
Ethereum short around 3900-4000 looks promising
Tesla fell sharply on the back of cash flow burn and expenditures.
Investors are also fearful of sales decline and loss of EV credits.
SPX hit major long term resistance today. Coupling this with a depressed Vix we are likely setting up for a pullback in the market.
Small caps saw distribution today on the back of rising yields. A failed breakout observed on IWM chart.

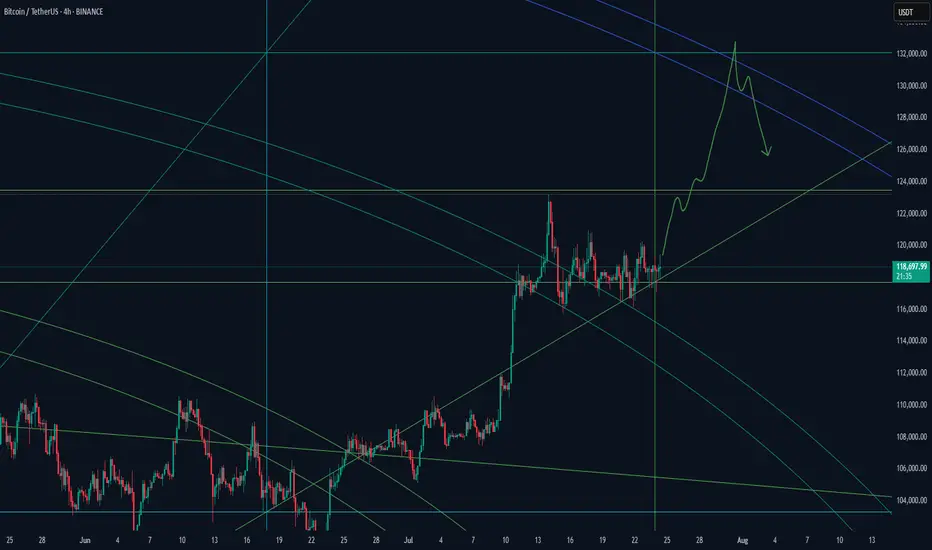
BTC/USD 4H Chart Review📊 Technical Structure (Symmetrical Triangle)
Formation: The symmetrical triangle (orange lines) remains intact—price continues to move within it.
Approaching the apex: The closer to the intersection of the triangle's arms, the greater the probability of a breakout. The current candle is testing the upper boundary of the formation (around $119,300), but has not yet broken it.
Direction: The formation is neutral, but tension is increasing. A breakout of either line (the upper boundary ≈$119,500 or the lower boundary ≈$117,700) could trigger a dynamic move with a range of around $3,000 (the height of the triangle at its widest point).
🧱 Support and Resistance Levels (Red and Green Lines)
Type Level (USD) Description
Resistance 123205 All-Time High – Possible Target After an Upward Breakout
Resistance 120556 Local Resistance – Triangle Breakout Range
Resistance 119200–119300 Currently Tested Level
Support 117752 Lower Triangle Boundary – Critical Defense Line
Support 115764 Next Local Support
📈 Technical Indicators
🔵 RSI (Relative Strength Index)
Currently: ~55 – indicates a neutral situation, having broken down from the overbought level (~74).
Indicates that the market has temporarily cooled down after a previous impulse. There is still room for further upward movement without exceeding 70.
🔵 MACD
The MACD and signal lines are approaching a crossover – if the MACD crosses the signal line upward, it could be a bullish signal.
The histogram is slightly positive – indicating weak but growing bullish momentum.
📊 Volume
Slightly increasing in the last candles – no confirmation of a strong breakout yet, but upward pressure is building.
🧠 Interpretation
Scenario Technical Conditions Movement Objective
🔼 Upward Breakout
Candlestick close above $119,500 USD 122,000–$123,200 USD
🔽 Downward Breakout
Close below 117,750 and confirmed by volume at 115,700, then 114,000 USD
🔄 Consolidation
Inconclusive, continued sideways movement
Between $117,700 and $119,500 USD
✅ Summary
Bitcoin is still in a neutral symmetrical triangle formation but is approaching a turning point.
The RSI has broken out of the overbought range, and the MACD is signaling a potential upside breakout.
Volume confirmation is still lacking, but technical conditions favor the bulls – if it manages to break above 119,500 and hold above, a move towards 122,000–123,000 USD can be expected.
In the event of a rejection, maintaining 117750 will be key; breaking it opens the way to 115700 and below.

ITDC - LongITDC rounding bottom base completed aND ready to move up.
Volume has contracted as well. Very less daily volume.
Strong promoter holding.. govt holding
New ITDC director has come, so she will bring changes.

Why a USD Bounce Could Trigger a Stock PullbackThe US Dollar has faced brutal selling during the first half of 2025. Some are even questioning whether the Dollar’s global hegemony is at risk. Early in the year the US stock market AMEX:SPY sold off aggressively, falling 19% from mid‑March to early April. Since then stocks have more than regained their losses and the Dollar is still in the tank. So where does that leave us for the rest of the year?
The Dollar Inverse Correlation
The US Dollar has an inverse correlation to most everything. Stocks, bonds, crypto, commodities, real estate — all are measured in Dollars. Therefore when the Dollar loses value, all things equal it takes more of them to reach the same value those assets were denominated at before. Conversely when the Dollar rises, other assets lose value in Dollar terms. Here we can see a long standing inverse correlation to stocks AMEX:SPY
Dollar in oversold territory
The Relative Strength Index (RSI) is a momentum oscillator that measures the magnitude of recent price changes on a scale from 0 to 100 to help identify overbought (above 70) or oversold (below 30) conditions. The Dollar has hit oversold several times so far this year, but not yet staged a material recovery.
Stocks in overbought territory
Meanwhile stocks have staged a blistering rebound off the "Liberation Day" driven selloff earlier this year. The S&P 500 now sits at an all‑time high, and you guessed it, has tapped overbought twice this month.
USD is fundamentally attractive
Because investors seek to earn the highest available yield on their capital, they tend to move funds into currencies offering higher interest rates (and away from those with lower rates), so differences in policy rates across countries create incentives for cross‑border borrowing and lending that drive FX flows. For example the Fed ( ECONOMICS:USINTR ) is at 4.5%, and the ECB ( ECONOMICS:EUINTR ) is at 2.15%. Moreover the Dollar is down significantly against major trading pairs that have lower yields. In our prior example the Dollar is down 11.98% against the Euro YTD (1- FX:EURUSD ), leaving substantial room for capital gains. Gravity could lure FX traders back in the second half of 2025.
Tariff calculus
Tariffs tend to bolster the imposing country’s currency in two main ways: by making imports more expensive they reduce import volumes, improving the trade balance (i.e. fewer foreign‑currency outflows), and by collecting duties in domestic currency the government effectively withdraws that currency from circulation, increasing its relative scarcity. Both effects lift demand for—and support the value of—the home currency.
Putting it all together
Despite the TVC:DXY ’s ~10.8% YTD slide and repeated oversold conditions, the compelling carry trade sets the stage for a USD bounce that, in turn, could pressure overextended equities. With stocks stretched and the Dollar oversold, the carry‑driven rebound in USD could well presage a pullback in equities. Stocks are expensive, Dollars are cheap 🤑

Nike - This is the bottom!💉Nike ( NYSE:NKE ) creates the bottom now:
🔎Analysis summary:
More than four years ago, Nike created its previous all time high. We have been witnessing a downtrend ever since and a correction of about -70%. But with the recent retest of an important horizontal structure and bullish confirmation, Nike is about to create a potential bottom.
📝Levels to watch:
$65, $80
🙏🏻#LONGTERMVISION
Philip - Swing Trader

Vine can reach new all time highs due to elon bringing it backVine can reach new all time highs due to elon bringing back the viral platform.
Vine has the chance to outshine every other meme coin this year.

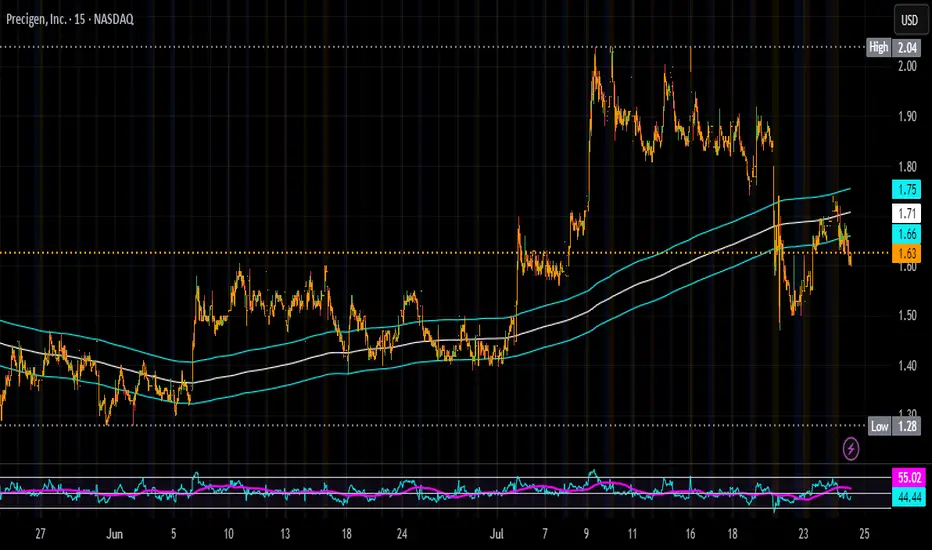
Buying More PGEN on all DipsThe market is overreacting to the NASDAQ:REPL news, and I think it’s a mistake to lump NASDAQ:PGEN in with it. Yes, PRGN-2012 is also a single-arm gene therapy trial, but it’s for an ultra-rare disease—not a broad indication like cancer. The FDA’s tougher stance seems to be focused on common diseases (like NASDAQ:REPL ’s melanoma drug), not niche, high-unmet-need therapies like Precigen’s.
Here’s why I’m loading up on this pullback:
PRGN-2012 has incredible data: 51% complete response rate, 86% reduction in surgeries (from 4 per year to zero). These patients suffer through painful, repeated procedures—this drug could be life-changing.
FDA loves it: Breakthrough Therapy, Orphan Drug, Fast Track, and Priority Review with a PDUFA date of August 27, 2025. If approved, it’ll be the first-ever treatment for RRP.
Commercial upside: Rare disease drugs have high margins, and there’s zero competition.
The sell-off is shortsighted. I’m treating this as a fire sale and buying more before the August 2025 catalyst. NASDAQ:PGEN is a high-conviction play for me.
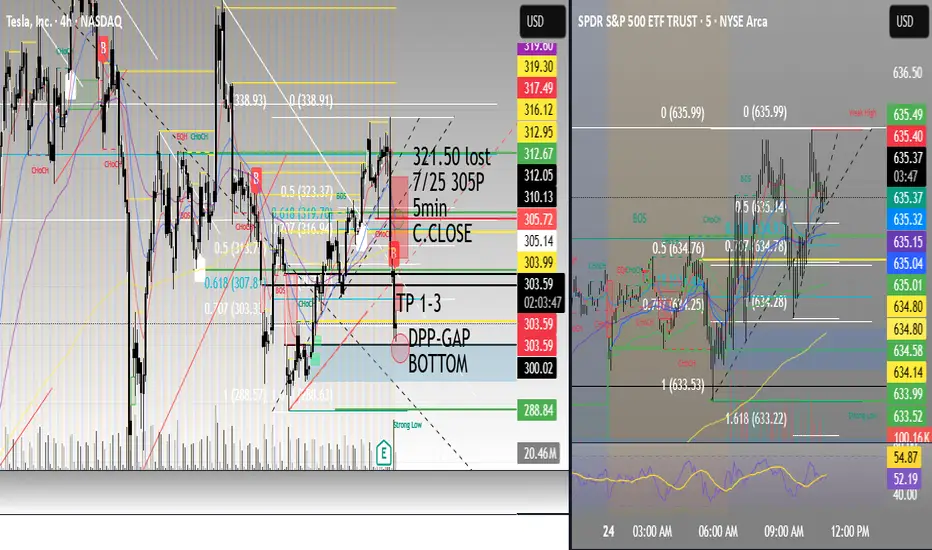
TSLA, revenue decline/textbook technical setup.TSLA, revenue decline/textbook technical setup.
Confluence of major levels, how to take a well defined short trade with puts.
Clean as it gets.
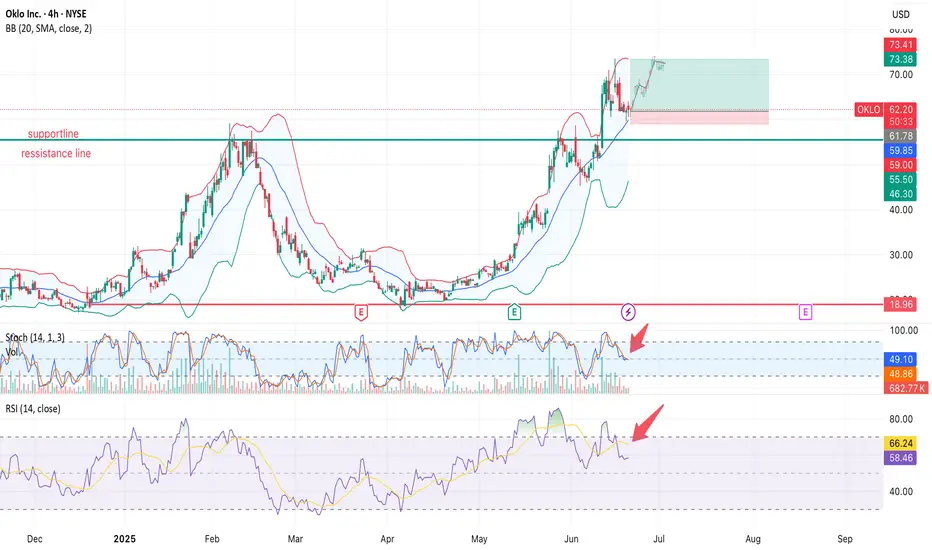
OKLO ($OKLO) — Consolidation After a Powerful Run: What’s Next?NYSE:OKLO After a +180% breakout earlier this year and a strong return above the $60–62 resistance zone, OKLO is now consolidating under $73.40. Let’s break it down 👇🔍 Technical Overview (4H chart)
• Breakout above key resistance ($59–62), which now acts as support.
• Price is consolidating in a bullish flag formation.
• Bollinger Bands are tightening — potential volatility ahead.
• Volume declining — market in a wait-and-see mode.
📉 Indicators:
• Stochastic Oscillator: curling down from 80+ zone — short-term exhaustion
• RSI: rolling over below 60 after peaking near 70 — momentum is fading
• Price Action: Still holding above support, but losing bullish strength📰 What drove the price to $55 (Feb 2025)?
• ✅ Wedbush sets $55 target, highlighting AI data center energy demand
• ✅ Q1 earnings: net loss narrowed to $0.07/share from $4.79/share
• ✅ Regulatory optimism: fast-track support for SMRs by U.S. government
📉 The following correction was largely technical (profit-taking after overextension).🚀 Why OKLO surged again to $73+ (June 2025)
• 🛡 $100M DoD contract for Aurora reactor on Eielson Air Force Base
• 💸 New capital round ($460M), backed by Bill Gates and Nvidia Ventures
• 📈 Wedbush upgrades target to $75, citing defense + AI synergy📐 What I’m Watching Now
Price remains above key support (~$61.8), but both RSI and Stoch are weakening. A breakdown below support may open the way for deeper correction — but volume will be the trigger.
📌 Break above $73.40 on strong volume could mark the next bullish leg
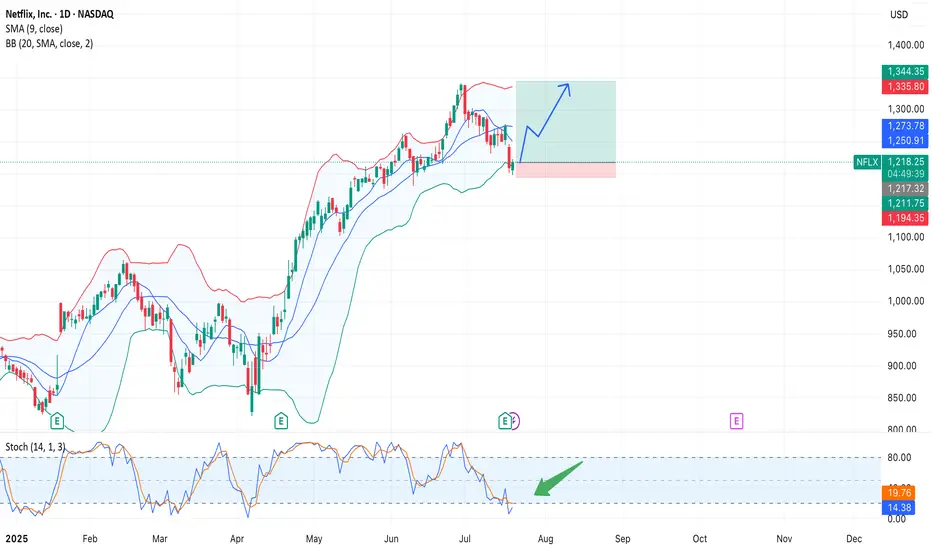
Netflix (NFLX) Long Setup – Bounce from Lower Bollinger Band $NASDAQ:NFLX. After pulling back from the $1350 area, Netflix stock is testing the lower Bollinger Band (BB 20/2σ), a level that previously acted as support.
At the same time, the Stochastic Oscillator (14,1,3) is in oversold territory and starting to curl upward, suggesting a potential bullish reversal.
Trade Setup:
• Entry: $1216 (current price)
• Target: $1283–$1300
• Stop Loss: $1194 (below BB lower band)
• Risk/Reward Ratio: 1:3+
Supporting Factors:
• Technical bounce from the lower Bollinger Band
• Price approaching SMA 9 (~$1250), potential breakout level
• Fundamental catalyst: Analysts at Baird and CICC raised their price targets to $1500 and $1350 respectively. Ad revenue is projected to quadruple by the end of 2025 due to stronger content engagement.
Risks:
• Q2 report met expectations, but weak forward guidance hurt sentiment
• A break below $1190 could lead to further downside pressure
HYPEUSDT - Analysis for Immediate Long EntryChart Analysis
Looking at the daily chart, the story is pretty clear. HYPE has been in a powerful uptrend since April. We saw it hit a recent high of around $49-$50. As expected after such a strong run, a pullback has started.
The price has now retraced to the $42.50 level. This is significant. This exact area was the peak of the previous rally in early July. Old resistance becoming new support is one of the most reliable patterns in trading. The chart shows the price is currently testing this level. The small green arrows (fractals) on the chart confirm these key swing points. This is our entry zone. The setup looks solid for a long position.
Sentiment Analysis (The "Why")
Time to check the news to see if it supports our technical view.
Positive News:
"Zircuit Launches 'Hyperliquid' to Simplify and Secure Cross-Chain DeFi Trading" (1 hour ago): This is fresh, positive news. New integrations and launches on the Hyperliquid platform suggest ecosystem growth and user adoption, which is fundamentally bullish for the HYPE token.
"Whale Deposits $3M USDC for 20x ETH Long" (10 hours ago): This shows that large, sophisticated traders ("whales") are actively using the platform for significant trades. High volume and large positions signal confidence in the platform's reliability and liquidity.
"Ethereum News: James Wynn Opens 25x Leveraged Position Worth 12 Million on Hyperliquid" (1 day ago): More evidence of heavy hitters using the platform. This kind of activity can attract more users and build a strong reputation.
Negative News (The "Noise"):
"Hype News: Why is HYPE's price down today?" (3 hours ago): This article is likely just explaining the natural price correction we're seeing on the chart. It's not necessarily bearish; it's just market dynamics. A pullback after a strong rally is healthy and expected. It doesn't change the underlying bullish structure.
Overall Sentiment : The sentiment is bullish. The price dip appears to be a technical retracement, while the news flow points to strong fundamentals and growing adoption of the Hyperliquid platform. This combination of a technical setup and positive sentiment gives me the confidence to proceed.
The Trade Plan
It's time to define the levels. We're going long with a market entry now, around $42.50.
Entry Reason: Entering a long position based on the price retracing to a key support level (previous resistance) in a clear uptrend, supported by positive news flow.
Stop Loss (SL): $38.50
Reason: A break below $39.00 would invalidate our trade idea. This level is clearly below the current support zone and below the swing low from mid-July. Placing the SL at $38.50 gives the trade enough room to breathe without risking a catastrophic loss if we're wrong.
Take Profit 1 (TP1): $49.50 (Moonbag Target)
Reason: This is just below the recent all-time high of ~$50. It's a logical first target where the price might face resistance. Hitting this level would be the first confirmation that the uptrend is resuming.
Action: At this point, we take initial profits and move the trailing stop to our entry price to make the rest of the trade risk-free.
Take Profit 2 (TP2): $58.00
Reason: This is a psychological and technical extension level. A common way to project a target after breaking an all-time high is using Fibonacci extensions or measured moves. A move to $58 would represent a significant new leg up.
Action: When TP2 is hit, we move the trailing stop up to the TP1 level ($49.50) to lock in more profit.
Take Profit 3 (TP3): $65.00
Reason: This represents the next major psychological number and a potential area for a medium-term top. It continues the measured move projection from the previous price swings.
Action: When TP3 is hit, we move the trailing stop up to the TP2 level ($58.00).
Take Profit 4 (TP4): $75.00 (Final Target)
Reason: This is our "blue sky" target. In a strong bull market, assets can run much further than expected. $75 is a major psychological milestone and a reasonable final target for this trade.
Action: Close all remaining positions.
Conclusion:
The plan is set. The HYPEUSDT trade offers a good risk-to-reward ratio based on a solid technical setup and bullish sentiment. We enter now and manage the trade according to the plan. Let's see how it plays out.

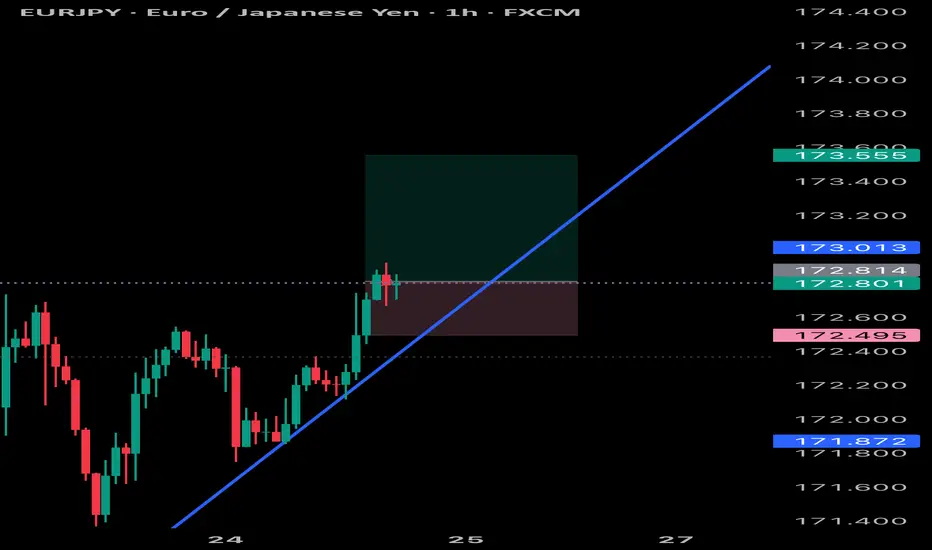
EUR/USDThe EUR/USD Is proving to show a weekly bearish reversal, but as you know within the weekly swing are smaller fractals that make the occasional (2H - 4H) hedge impulses. I have entered from the (1H - 2H) chart to the down side with a take profit of 1.01310 knowing that due to USA regulation I will not be able to hedge I will add lot size at the peak of every (4H) pull back
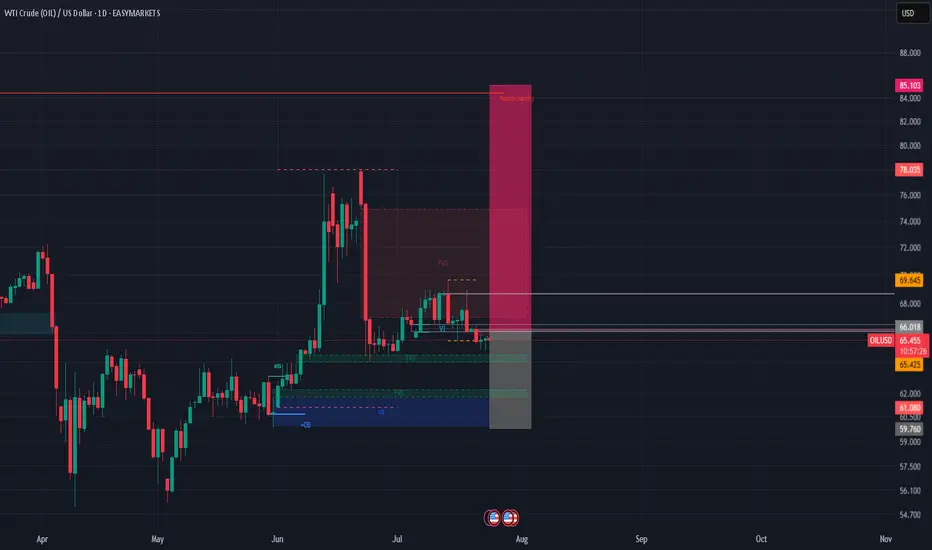
CRUDE OIL (LONG IDEA)🛢️ OILUSD (WTI Crude Oil) – LONG SETUP 🛢️
🚦 Bias: BULLISH (Long)
💰 Entry: Market @$65.408 (or buy dips)
🛑 Stop Loss:$60.00 (HTF protection)
🎯 Take Profits:
• TP1:$69.65
• TP2:$72.00
• TP3:$85.00 🚀 (HTF buy-side liquidity)
🔍 Why This Trade?
✨ Multi-Timeframe Confluence:
📈 Weekly: Bullish structure shift, liquidity sweep
🟩 Daily: Strong bounce from order block + FVG
⏰ 4H: BOS, FVG tap, higher lows = bullish flow
🔥 Fundamentals:
🏦 EIA: Big crude inventory drawdown
🌍 OPEC/IEA: Q3 demand rising
⚡ Geopolitics: Middle East/Red Sea risk premium
💵 Macro: USD weakness = oil tailwind
🧠 Sentiment:
🧑💻 Retail: Still net short
🏦 Managed money: Adding longs
🚀 Fuel for upside!
🛠️ Execution Plan:
💸 Buy now @$65.408 or scale in on dips $64.50–63.50)
🛡️ Stop Loss:$59.780 (HTF structure)
🎯 Targets:
TP1:$69.65
TP2:$72.00
TP3:$85.00 🚀
❌ Invalidation:
Weekly close <$60.00 = exit
⚡ Summary:
All signals GO! 🚦 Multi-timeframe bullish structure, strong demand, and fundamentals + sentiment all align for a high-conviction long. Risk defined at $60.00 for max protection. Targeting major buy-side liquidity at $85.00!
#OILUSD #CrudeOil #Long #SmartMoney #TradeSetup 🚀
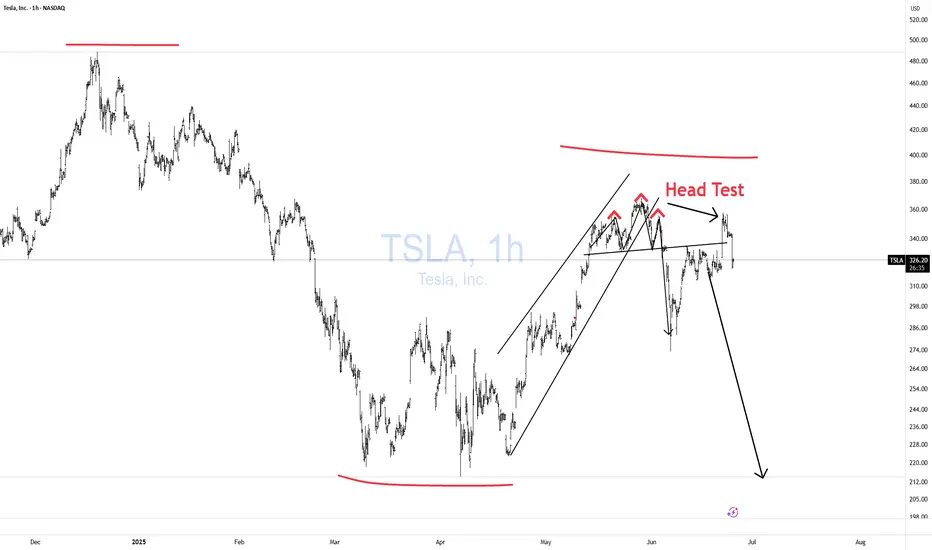
TSLA Honey Ticking Bull Trap! UPDATE 1This is an updated chart, as I keep being prompted to reach "My Target" by TV.
No matter how bad things get for Elona and TSLA, there are always people who are willing to pile in and buy at any price. The problem is the chart is showing lower highs, as TSLA no longer attracts the people needed to boost price, just like TSLA the brand. As a result, people keep getting honey ticked.
Don't Get HONEY TICKED!
As I always say, never EVER!! Invest in toxic people like Elona. They always blow themselves up in the end. It's in their nature!
Click Boost, Follow, subscribe, and let's reach 5,000 followers. ;)
ECB holds rates as expected, Euro steadyThe euro is showing limited movement on Thursday. In the North American session, EUR/USD is trading at 1.1763, down 0.03% on the day. Earlier, the euro climbed to a high of 1.1788, its highest level since July 7.
The European Central Bank's decision to maintain the key deposit rate at 2.0% was significant but not a surprise. With the hold, the ECB ended a streak of lowering rates at seven consecutive meetings. The ECB has been aggressive, chopping 250 basis points in just over a year.
The ECB statement said that inflation was falling in line with the Bank's forecasts and that future rate decisions would be data dependent. President Lagarde has said that the easing cycle is almost down, but the markets are expecting at least one more rate cut before the end of the year.
The European Union and the United States are locked in negotiations over tariffs, with hopes that an agreement can be reached, on the heels of the US-Japan deal earlier this week. US President Trump has threatened to hit the EU with 30% tariffs if a deal is not made by August 1, but there are signals that the sides will agree to 15% tariffs on European imports, as was the case in the US-Japan agreement.
If an agreement is reached, it will greatly reduce the uncertainty around tariffs and will make it easier for the ECB to lower rates and make more accurate forecasts for inflation and growth.
In the US, Services PMI rose to 55.2 in July, up from 52.9 in June and above the market estimate of 53.0. This pointed to strong expansion and marked the fastest pace of growth in seven months. Manufacturing headed the opposite direction, falling from 52.6 in June, a 37-month high, to 49.5. This was the first contraction since December, with new orders and employment falling.

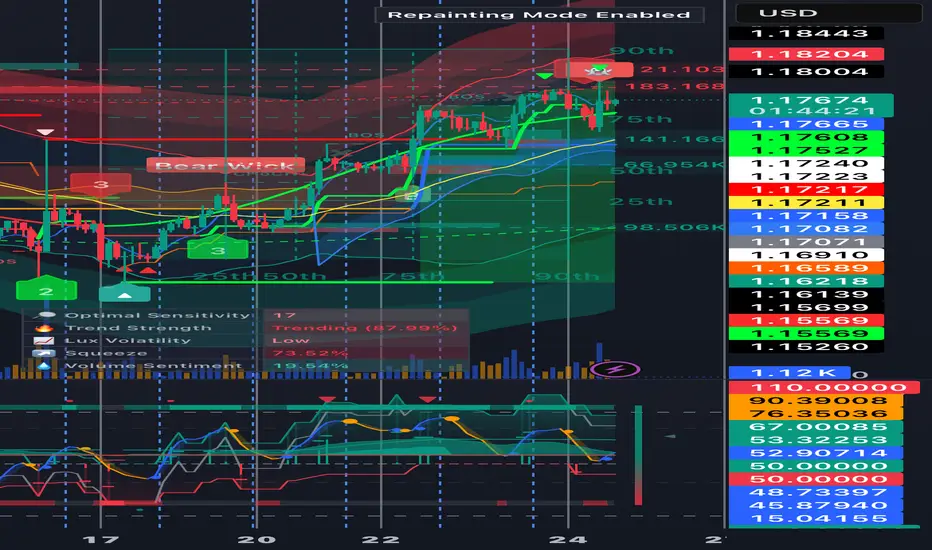
The combination of the Leo New Moon and the Gann Square support Astrologically, we have two important events, the first is the new moon in Leo, which will cause a new movement in the market and give new life to the market. The second is the opposition of the Sun and Pluto, which caused a power struggle between buyers and sellers and at some point there were several stop hunts, but now it seems that the price above 118 thousand is stabilizing and could start a new rally upwards.
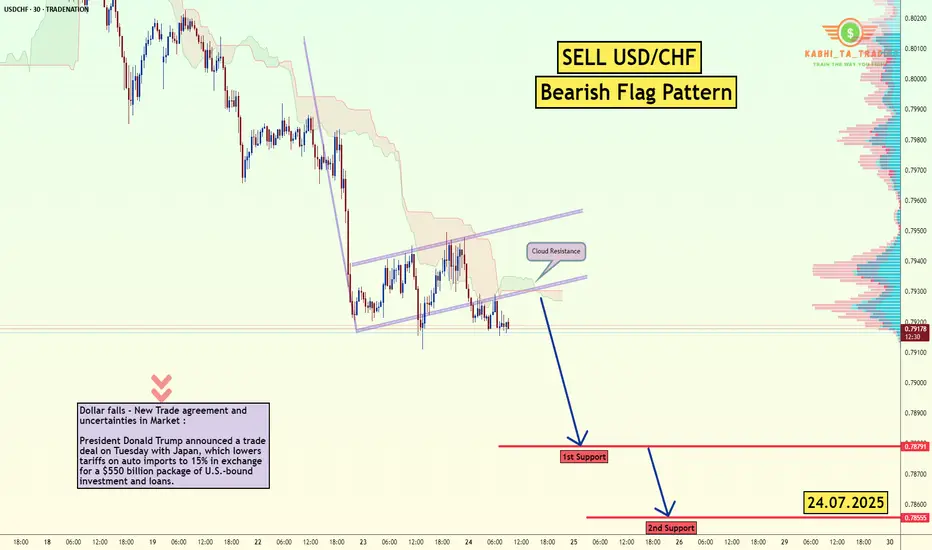
USD/CHF - Bearish Flag (24.07.2025)Fundamental Updates :
Dollar falls - New Trade agreement and uncertainties in Market :
President Donald Trump announced a trade deal on Tuesday with Japan, which lowers tariffs on auto imports to 15% in exchange for a $550 billion package of U.S.-bound investment and loans.
The USD/CHF Pair on the M30 timeframe presents a Potential Selling Opportunity due to a recent Formation of a Bearish Flag Pattern. This suggests a shift in momentum towards the downside in the coming hours.
Possible Short Trade:
Entry: Consider Entering A Short Position around Trendline Of The Pattern.
Target Levels:
1st Support – 0.7878
2nd Support – 0.7855
🎁 Please hit the like button and
🎁 Leave a comment to support for My Post !
Your likes and comments are incredibly motivating and will encourage me to share more analysis with you.
Best Regards, KABHI_TA_TRADING
Thank you.
Disclosure: I am part of Trade Nation's Influencer program and receive a monthly fee for using their TradingView charts in my analysis.
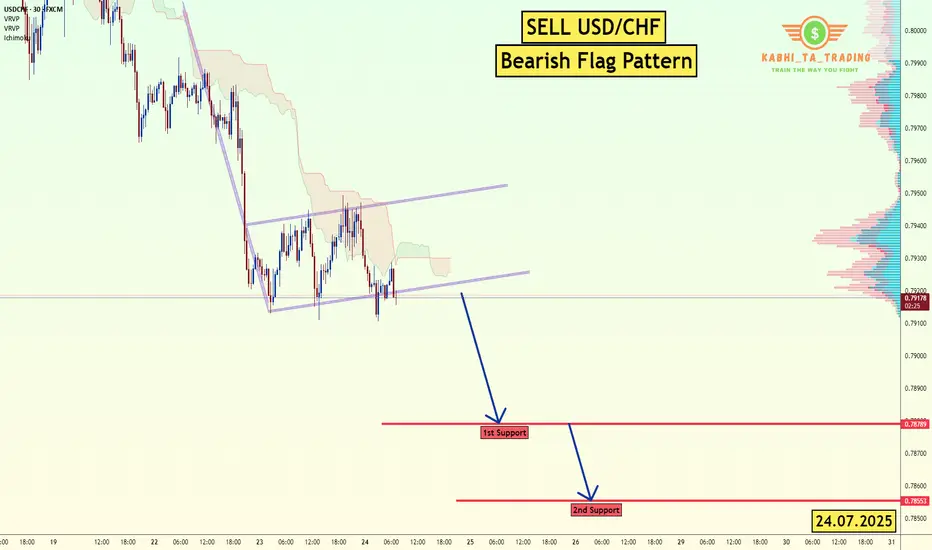
USD/CHF - Bearish Flag (24.07.2025)The USD/CHF Pair on the M30 timeframe presents a Potential Selling Opportunity due to a recent Formation of a Bearish Flag Pattern. This suggests a shift in momentum towards the downside in the coming hours.
Possible Short Trade:
Entry: Consider Entering A Short Position around Trendline Of The Pattern.
Target Levels:
1st Support – 0.7878
2nd Support – 0.7855
🎁 Please hit the like button and
🎁 Leave a comment to support for My Post !
Your likes and comments are incredibly motivating and will encourage me to share more analysis with you.
Best Regards, KABHI_TA_TRADING
Thank you.
Disclosure: I am part of Trade Nation's Influencer program and receive a monthly fee for using their TradingView charts in my analysis.
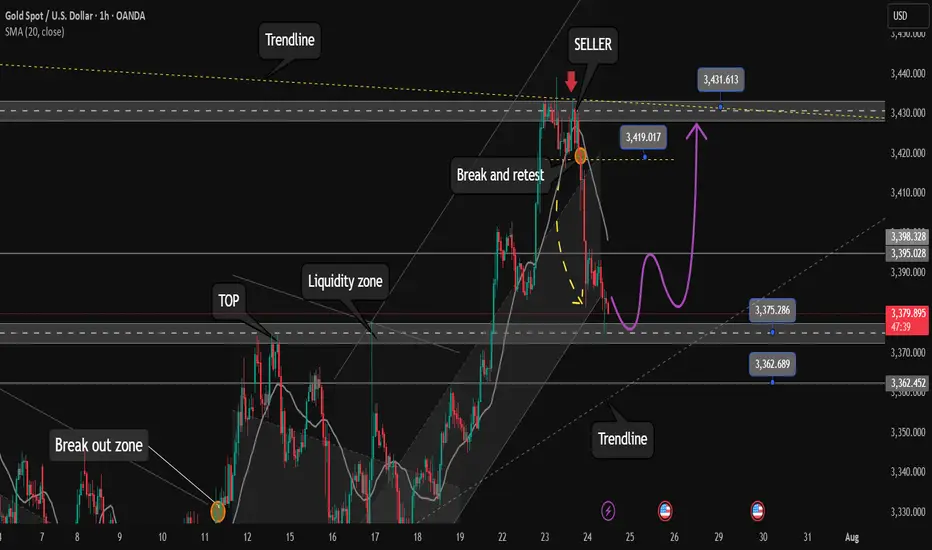
Some investors take profits. Opportunity to buy gold to 3500?✏️ OANDA:XAUUSD price correction of 50 appeared yesterday. This is obvious to happen in a sustainable uptrend. Today's strategy will look for liquidity sweeps to support to BUY to ATH 3500. Gold's current border zone is limited by the upper and lower trendlines. Be careful not to trade against the trend when breaking the trend zone.
📉 Key Levels
Support: 3375 -3363
Resistance: 3418-3431-3490
Buy trigger: Buyers react at 3375
Buy zone: 3363
Target: 3430; level higher at 3490
Leave your comments on the idea. I am happy to read your views.