Xrp - The final bullish breakout!💰Xrp ( CRYPTO:XRPUSD ) will create new all time highs:
🔎Analysis summary:
After a consolidation of an incredible seven years, Xrp is finally about to create new all time highs. With this monthly candle of +40%, bulls are totally taking over control, which means that an altcoin season is likely to happen. And the major winner will simply be our lovely coin of Xrp.
📝Levels to watch:
$3.0
🙏🏻#LONGTERMVISION
SwingTraderPhil
Fundamental Analysis

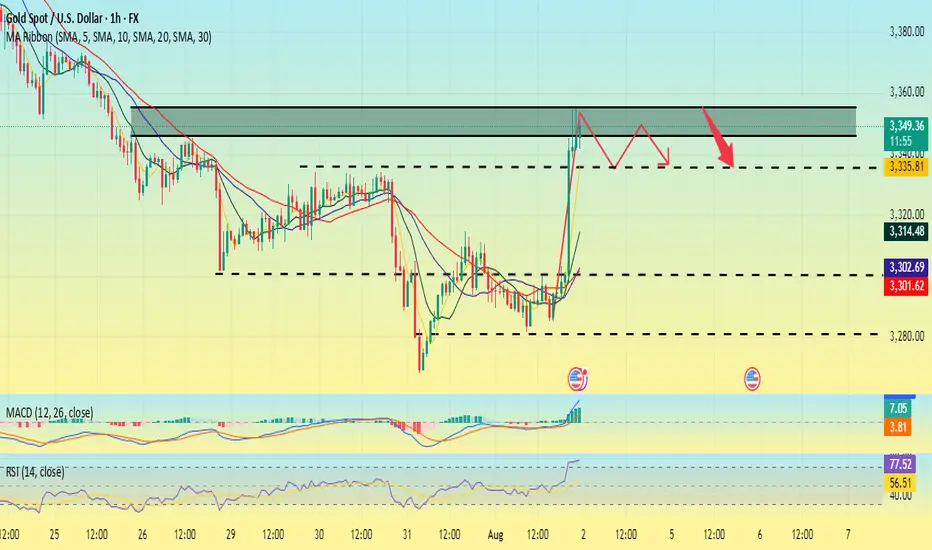
Is the uptrend complete? Will there be a pullback?On the last trading day of this week, gold prices soared, rising nearly $56, driven by the non-farm payroll data. The rally began at 3300 and peaked near 3356. The price has now retreated slightly, fluctuating around 3345.
The current uptrend has repeatedly tested the resistance level near 3355 but has failed to break through. The RSI indicator hovered around 76.8, indicating a gradual flattening of the upward trend. The 3355 high is likely the end of this uptrend.
As this is the last day of a major data week, Quaid believes the current uptrend is complete. Consider a light short position around 3350-3355. The current low has yet to be confirmed, and the pullback is likely to end around 3335.
However, we cannot rule out the possibility that the price will remain within the upward channel with slight fluctuations on the last trading day of the week.
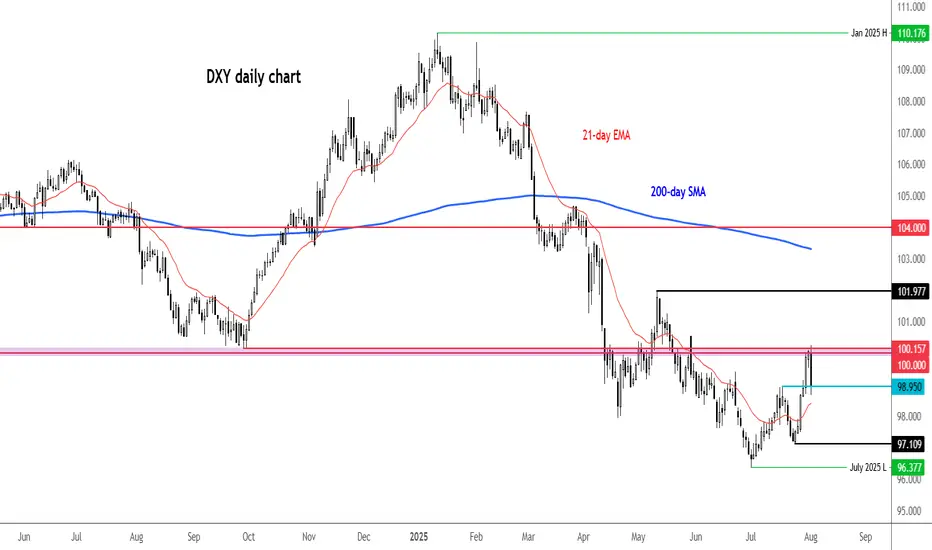
What now for the dollar after a poor NFP report?It is difficult not to link the bad US data to the impact of tariffs. Indeed, it certainly looks that way, especially given that the slowdown in jobs started in early Q2 when reciprocal tariffs were announced. Companies expecting margins to be squeezed by higher duties probably thought twice about hiring workers in order to keep costs down. So, the US labour market has been losing steam fast, undoubtedly due to tariff concerns. Unless the data surprises on the upside soon, the Fed may have no choice but to cut—and cut again. Against this backdrop, the recovery in the dollar is going to a long bumpy road.
We noted the area around 100.00 to be resistance in the previous update, and that level has held, thanks to the weak jobs report (and ISM survey that was released later). The DXY was testing potential support around 98.95 at the time of writing. Will it be able to bounce there? Break that on a closing basis and next week could bring more technical dollar selling.
By Fawad Razaqzada, market analyst with FOREX.com
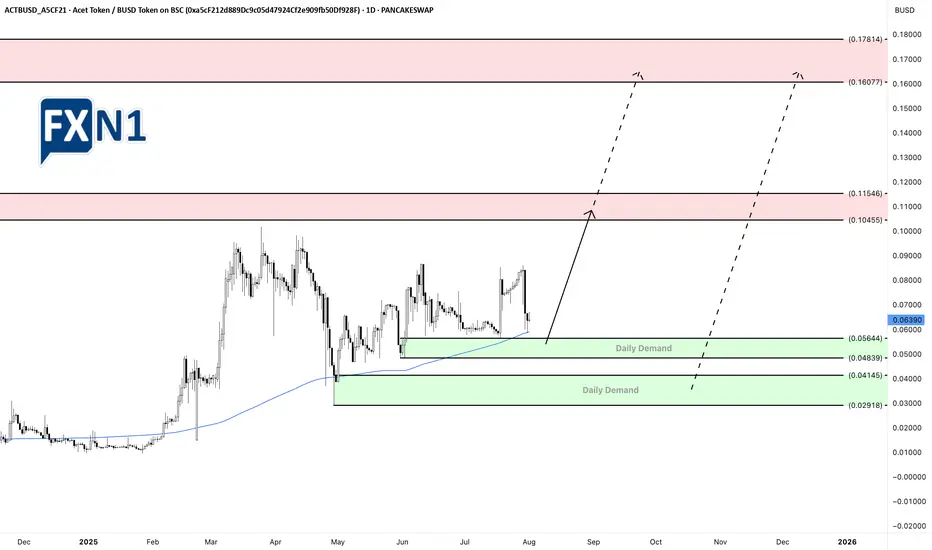
Acet Token’s Price Analysis: Levels and Future PotentialsThe Acet Token (ACT) is currently nearing a critical daily demand zone at 0.05644, suggesting a potential opportunity for a bullish move or a strategic entry at a discounted rate. Additionally, there is another fresh daily demand level at 0.04145, which could present an even more attractive entry point for those willing to buy at a lower price. Looking ahead, the token might retest higher levels around 0.10445, which stands as our primary target for future gains.
Acet (ACT) stands out in the crowded cryptocurrency field by pioneering the "Initial Zero Supply" model, aimed at tackling issues related to token oversupply. Developed by Thai trader and entrepreneur Acme Worawat, Acet is more than just a digital asset—it represents a movement towards integrating cryptocurrencies into larger economic systems. Built on Binance Smart Chain (BSC) and compliant with the BEP-20 standard, Acet employs a Zero Initial Supply strategy, where tokens are generated through Liquidity Mining. This process involves users staking assets in designated pools, with smart contracts ensuring transparent, secure, and efficient token issuance.
✅ Please share your thoughts about ACT in the comments section below and HIT LIKE if you appreciate my analysis. Don't forget to FOLLOW ME; you will help us a lot with this small contribution.
Silver under pressure!Silver prices dropped sharply following a sudden plunge of over 20% in U.S. copper futures, triggered by a surprise decision from the Trump administration to cancel import tariffs on refined copper. This move caused turmoil in the markets and impacted related assets such as silver.
From a technical perspective, silver is trading in a general downtrend on the 4-hour chart, forming lower lows and lower highs, maintaining a bearish structure.
If the price rises to the 37.034 level, it is likely to reverse downward to continue the bearish trend, targeting the 36.45 and 35.60 levels in the medium to long term.
However, if the price climbs above 37.26 and closes a 4-hour candle above that level, the bearish scenario would be invalidated, and this breakout could signal a trend reversal from bearish to bullish.

BTCUSD – Bullish Recovery Setup Forming Near Trendline Support🧠 Market Structure & Technical Breakdown
The BTCUSD 4H chart showcases a well-formed descending triangle or falling wedge structure with clearly respected major and minor descending trendlines. Currently, price action is testing a dynamic support zone, highlighted in green, which has been a strong reaction area in the past.
This area aligns with a bullish accumulation zone, from which buyers have previously stepped in to initiate impulsive moves. Given the confluence of diagonal support and horizontal price reactions, we may be on the verge of a bullish breakout opportunity.
📍 Key Zones & Trendlines
✅ Green Support Channel (Demand Zone): Acting as a key pivot for multiple recent rejections, this area (~114,000–113,000) is now being revisited again, offering potential buy interest.
📉 Minor Trendline: A short-term descending resistance around 120,000—likely the first barrier in case of a bounce.
📉 Major Trendline: A more extended dynamic resistance line connecting swing highs, currently intersecting near the 124,000 region.
🔄 Potential Price Scenarios
Primary Bullish Setup (MMC Plan):
Price bounces off the green demand zone.
Breaks above the minor trendline (~120K).
Pullback retest to confirm breakout.
Continuation toward the major breakout level (~124K and beyond).
Invalidation / Bearish Case:
A clean breakdown below 113,000 with strong bearish momentum would negate this setup, likely targeting the psychological support near 110,000.
🧠 MMC Mindset: Trade with Patience & Confluence
This is a classic accumulation-to-breakout scenario. Smart traders wait for confirmation—especially as BTC often exhibits false breakdowns before a major move. Monitor candle behavior, volume, and reaction to the minor trendline.
Let the market show signs of strength (like bullish engulfing, pin bars, or a breakout-retest) before committing to the upside. Avoid FOMO; the key is discipline and precision entry at structural break points.
✅ Trade Plan Summary:
Watch zone: 113,000–114,500 for bullish price action
Breakout level: Minor trendline (~120,000)
Target zone: 123,500–124,000 (Major resistance)
Stop-loss idea: Below 112,800 (Invalidation of structure)

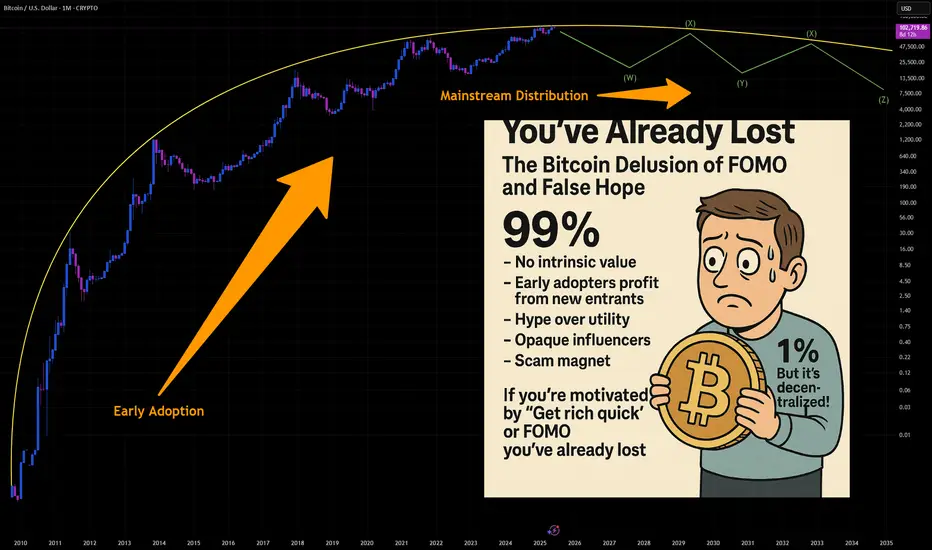
You've Already Lost: The Bitcoin Delusion of FOMO and False HopeLet’s get one thing straight: if you’re staring at Bitcoin, squinting past the red flags, and convincing yourself it’s not a Ponzi scheme because of that one shiny feature that screams “legit,” you’re not investing—you’re auditioning for the role of “next victim.” And if your motivation is the fear of missing out (FOMO) or the fantasy of getting rich quick, well... congratulations. You’ve already lost.
The 99%: Red Flags Waving Like It’s a Parade
Let’s talk about the indicators—the ones that make Bitcoin look suspiciously like a Ponzi scheme. No, it’s not technically one, but the resemblance is uncanny:
- No intrinsic value: Bitcoin isn’t backed by assets, cash flow, or a government. It’s worth what the next person is willing to pay. That’s not investing. That’s speculative hot potato.
- Early adopters profit from new entrants: The people who got in early? They’re cashing out while newcomers buy in at inflated prices. That’s the classic Ponzi dynamic: old money out, new money in.
- Hype over utility: Bitcoin’s actual use as a currency is minimal. It’s slow, expensive to transact, and volatile. But hey, who needs functionality when you’ve got memes and moon emojis?
- Opaque influencers: From anonymous creators (hello, Satoshi) to crypto bros promising Lambos, the ecosystem thrives on charisma, not accountability.
- Scam magnet: Bitcoin has been the currency of choice for over 1,700 Ponzi schemes and scams, according to a University of New Mexico study cs.unm.edu . That’s not a coincidence. That’s a pattern.
The 1%: The “But It’s Decentralized!” Defense
Ah yes, the one redeeming quality that Bitcoin evangelists cling to like a life raft: decentralization. No central authority! No government control! It’s the financial revolution!
Except… decentralization doesn’t magically make something a good investment. It just means no one’s in charge when things go wrong. And when the market crashes (again), you can’t call customer service. You can tweet into the void, though.
FOMO: The Real Engine Behind the Madness
Let’s be honest. Most people aren’t buying Bitcoin because they believe in the tech. They’re buying because they saw someone on TikTok turn $500 into a Tesla. FOMO is the fuel, and social media is the match.
Bitcoin’s meteoric rises are often driven by hype cycles, not fundamentals. Tesla buys in? Price spikes. El Salvador adopts it? Price spikes. Your cousin’s dog walker says it’s going to $1 million? Price spikes. Then it crashes. Rinse, repeat.
This isn’t investing. It’s gambling with a tech-savvy twist.
The Punchline: You’ve Already Lost
If you’re ignoring the overwhelming signs of speculative mania and clinging to the one feature that makes you feel better about your decision, you’re not ahead of the curve—you’re the mark. And if your motivation is “I don’t want to miss out,” you already have. You’ve missed out on rational thinking, due diligence, and the ability to distinguish between innovation and illusion.
Bitcoin might not be a Ponzi scheme in the legal sense. But if it walks like one, talks like one, and makes early adopters rich at the expense of latecomers… maybe it’s time to stop pretending it’s something else.
INDEX:BTCUSD NYSE:CRCL NASDAQ:HOOD TVC:DXY NASDAQ:MSTR TVC:SILVER TVC:GOLD NASDAQ:TSLA NASDAQ:COIN NASDAQ:MARA
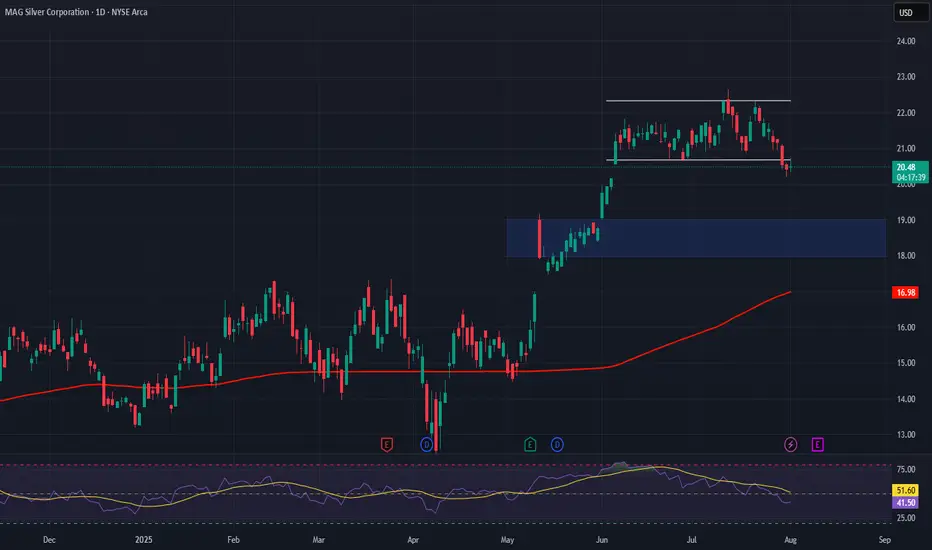
MAG Silver – A Pure-Play Winner in the Precious Metals RallyCompany Snapshot:
AMEX:MAG Silver is uniquely positioned as a high-beta play on silver and gold, with nearly all revenue tied to precious metals exposure—making it a standout in the current macro-driven metals bull run.
Key Catalysts:
High Leverage to Silver 🌐
With almost all income derived from silver and gold sales, MAG offers direct upside as investors flock to safe-haven assets amid inflation, rate uncertainty, and geopolitical risk.
Juanicipio Growth Engine ⛏️
Operated by top-tier partner Fresnillo, the Juanicipio project continues to scale efficiently, tapping into new high-grade zones that will further boost output and margins.
Financial Strength 💰
A debt-light balance sheet and healthy cash reserves give MAG financial flexibility, minimizing dilution risk and providing insulation during volatile market cycles.
Investment Outlook:
Bullish Entry Zone: Above $18.00–$19.00
Upside Target: $28.00–$29.00, driven by silver tailwinds, project scalability, and financial discipline.
🥇 MAG Silver stands out as a low-risk, high-reward name for investors seeking direct exposure to silver’s breakout.
#SilverStocks #Gold #MAGSilver #SafeHaven #PreciousMetals #Juanicipio #Fresnillo #CommodityRally #HardAssets #MiningStocks #InflationHedge #Geopolitics #MetalBulls
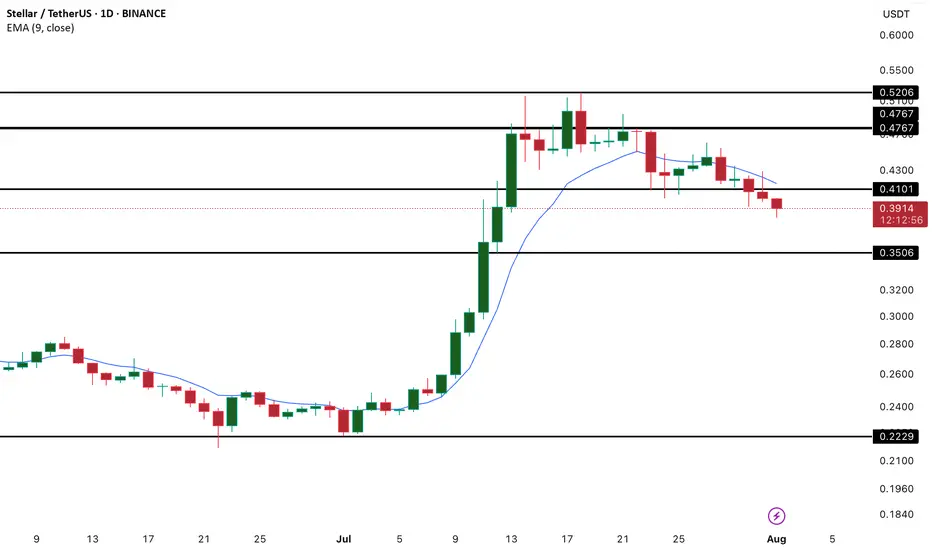
XLM/USD Analysis – Bearish Momentum Builds Below 20-Day EMA
XLM has taken a notable hit, with recent price action showing a sharp drop that has dragged the token below its 20-day Exponential Moving Average (EMA). Currently sitting at $0.40, the 20-day EMA now acts as a dynamic resistance level, capping potential upside in the short term.
This development signals a clear shift in short-term sentiment. The 20-day EMA, which reflects average pricing over the last 20 sessions with an emphasis on recent moves, typically supports bullish outlooks when the price remains above it. However, XLM's break below this level suggests growing sell-side pressure and a loss of bullish control.
With momentum weakening and bearish signals intensifying, traders may want to exercise caution, especially if the price fails to reclaim the EMA in the near term. Further downside could follow if buyers don't step in to reverse the trend.
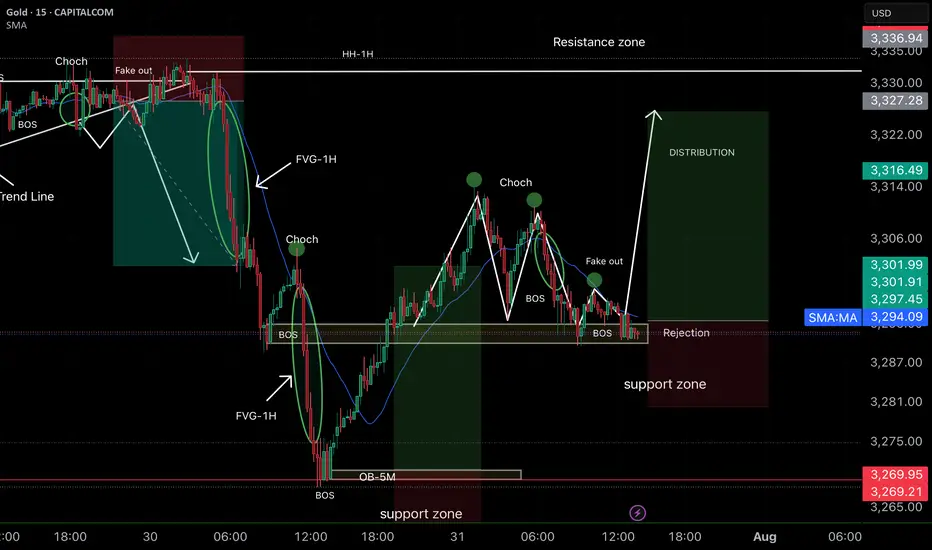
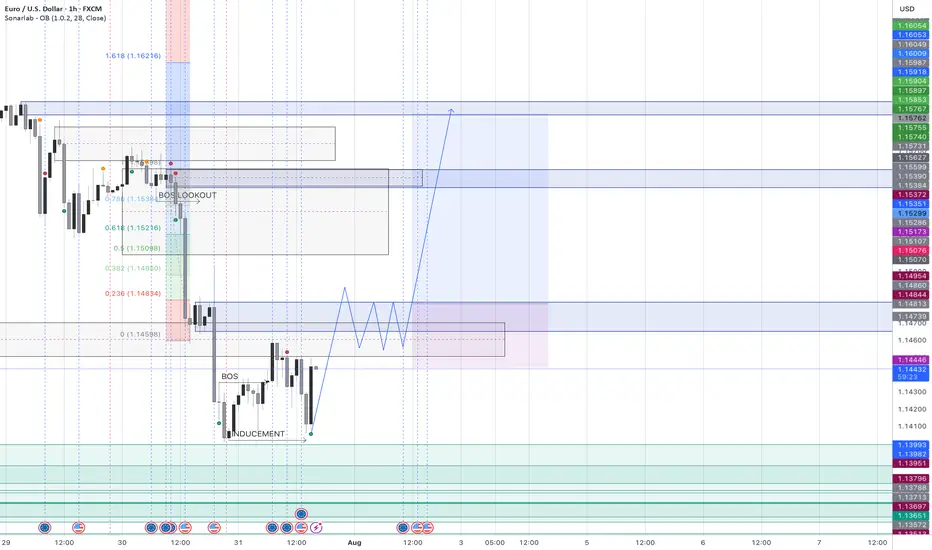
Smart Money Concepts (SMC) ✅ Analysis strengths:
• Correct identification of BOS (Break of Structure) and CHoCH, which indicate a change in direction.
• The support zone is marked and respected with rejection, reinforcing the probability of a rebound.
• The projection toward the distribution zone and HH of 1H is consistent, as there are inefficiencies (FVG) pending mitigation.
• The previous fake out clears liquidity and creates room for strong bullish momentum.
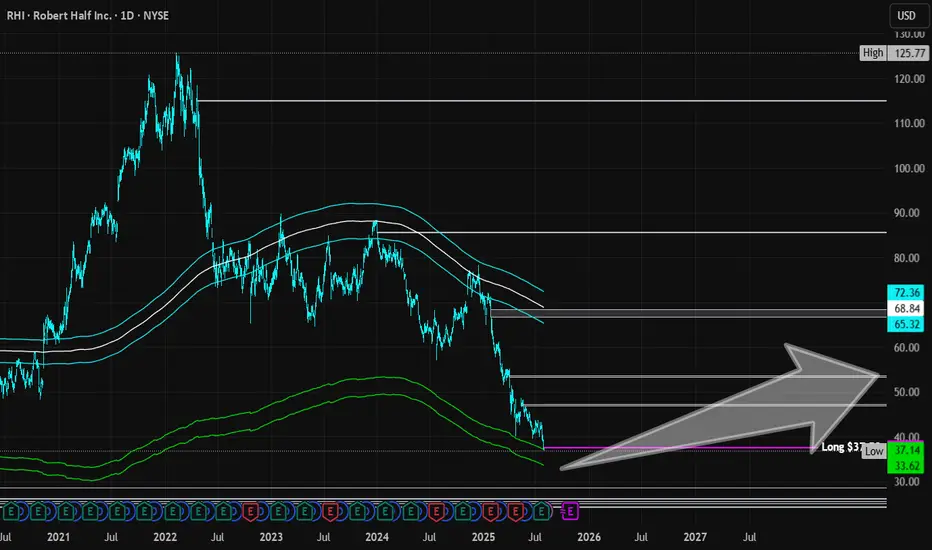
Robert Half | RHI | Long at $37.58Robert Half NYSE:RHI is a company that provides talent solutions and business consulting services in the US and internationally. It's a cyclical stock. Currently, the price has entered my "crash" simple moving average zone ($37-$33) and has historical bounced from this area. This doesn't mean the "major crash" area won't be reached ($26-$21 or below), but the company has been around since 1948 and survived many hurdles along the way.
Earnings are forecast to grow 8% annually and it has a 6.3% dividend. P/E = 21x and financially healthy (low debt-to-equity: .2x, low bankruptcy risk/Altmans Z Score: 5; and enough cash to pay current bills/quick ratio: 1.6).
Regardless of bottom predictions, I think there is a high chance the stock may reach $33 before a slight bounce. If the market flips for a bit, that "major crash" area ($20s) may be hit.
So, a starter position for NYSE:RHI has been created at $37.58 with additional entries near $33 and $25-$26.
Targets into 2028:
$46.00 (+22.4%)
$53.00 (+41.0%)

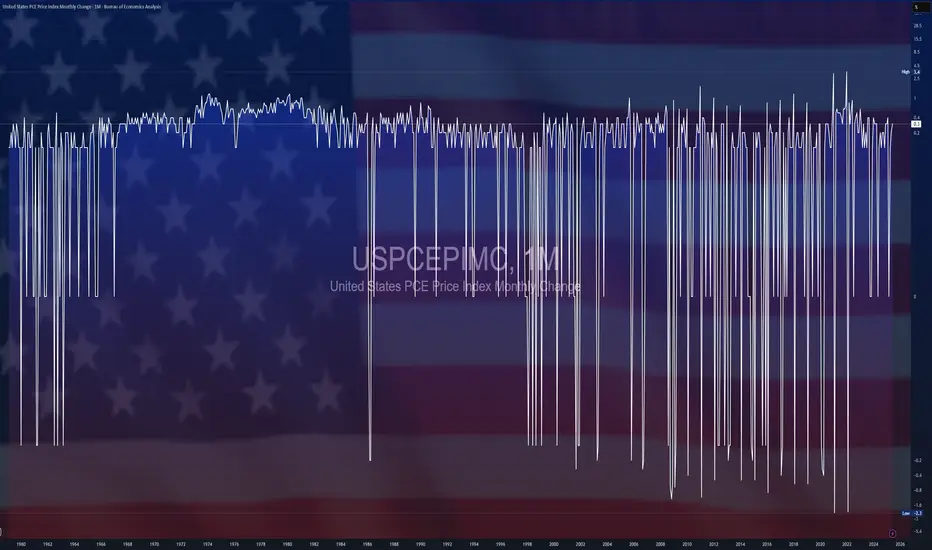
$USPCEPIMC -U.S PCE Prices Rise (June/2025)ECONOMICS:USPCEPIMC
June/2025
source: U.S. Bureau of Economic Analysis
- The US PCE price index rose by 0.3% mom in June, the largest increase in four months, and in line with expectations, led by prices for goods.
The core PCE index also went up 0.3%, aligning with forecasts.
However, both the headline and core annual inflation rates topped forecasts, reaching 2.6% and 2.8%, respectively.
Meanwhile, both personal income and spending edged up 0.3%.
RDDT Earnings Setup (2025-07-31)
### 🔥 RDDT Earnings Setup (2025-07-31)
📈 **Bullish Bias | Confidence: 75%**
🎯 Target: \$165+ | 🔒 Resistance: \$155.58
---
### 📊 FUNDAMENTALS
* 📈 **Revenue Growth (TTM): +61.5%**
* 💰 **Gross Margin**: 90.8%
* ⚠️ **Op Margin**: 1.0% (Thin runway)
* 💥 EPS Surprise Avg: **+191% (5/5 beat streak!)**
* 📉 EPS Growth Est: **-86.6%** → low bar = potential upside
**🧠 Fundamental Score: 7/10**
---
### 🧠 OPTIONS FLOW
* 🔵 **\$172.00C** building OI
* 💸 IV Rank \~0.75 (Move priced in!)
* 🧲 Bullish call activity > puts
* 🛡️ Put skew = hedged upside
**📊 Options Score: 7/10**
---
### 📈 TECHNICAL SETUP
* ✅ Above 20DMA
* 🔥 RSI: 62.2 = strength but not overbought
* 📦 Accumulation spike
* 🔐 Resistance: \$155.58
* 🧲 Break = squeeze setup
**📉 Technical Score: 8/10**
---
### 🌍 MACRO BACKDROP
* 🌐 Digital ad sector = support
* 🚨 Regulatory overhang = minor risk
* 🧬 Growth stock rotation helps RDDT
**🌐 Macro Score: 7/10**
---
### 🎯 TRADE IDEA
**💥 RDDT \$172.00C** (Aug 1 Exp)
* 💵 Entry: \$6.15
* 🎯 PT: \$18.45
* 🛑 SL: \$3.08
* 📈 Risk/Reward: \~3:1
* ⏱ Exit: 1–2 hrs post-earnings
* ⚖️ Sizing: 1 contract = \~\$615 risk
---
### ✅ SUMMARY
🧬 Strong rev growth + historical beat streak
🎯 Technical breakout setup + bullish flow
🚀 Potential squeeze toward **\$165+**
📣 Tag: #RDDT #EarningsPlay #OptionsFlow #RedditIPO #SwingTrade #TradingViewViral #EarningsSeason #TechStocks #CallOptions

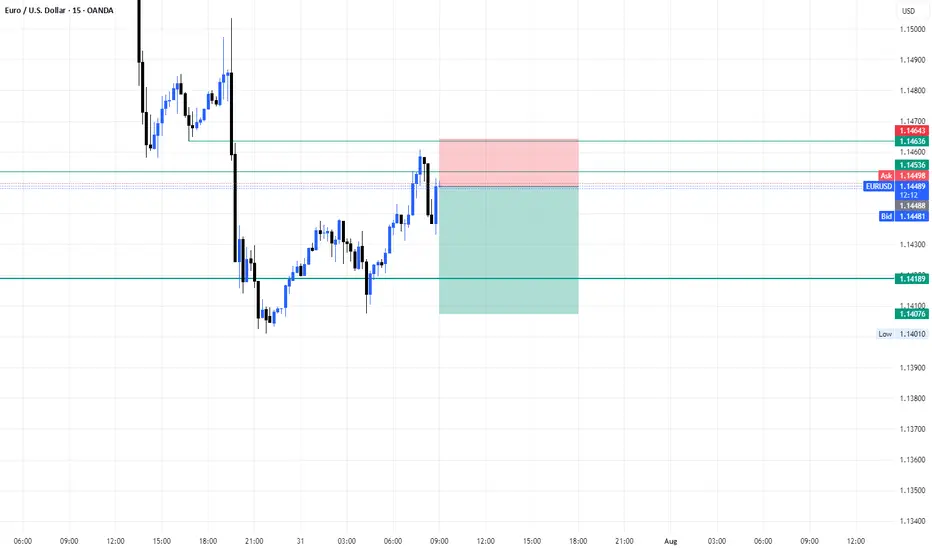
On the look out for a break above 1.14829 to confirm BullishHi Friends - Here is my own bias. Not a financial advise.
1. Buying intent spotted after the break of structure on the 1h time frame at 1.14381 BOS
2. Price retraced back to the liquidity that drove price back up on July 10th at 1.14005
3. We are looking out for price to close above 1.14805 and seek liquidity to move to the up side.
4. Possible consolidation between 1.14024 and 1.14858
Violation of the setup above will lead to a movement to the downside.
See you on the profitable end.
The Surge!
EURusd short position 31/07/2025English : According to our analysis, we anticipate a bearish scenario.
Morocan Darija : kanchofo d'apres l'analyse dyalna antsanaw hboot
ATENTION : I only share my ideas, not signals
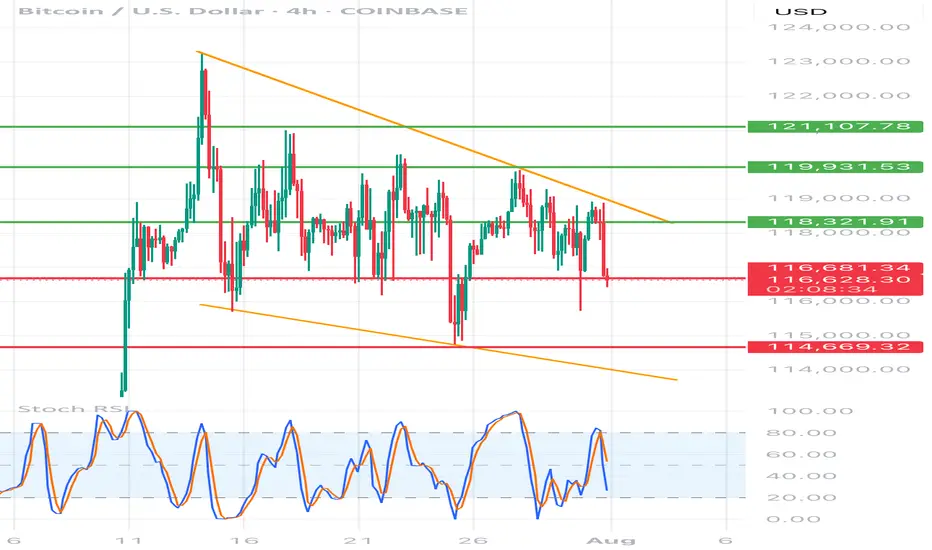
BTC/USD 4h chart🔸 Formation: Triangle descending (descending)
• Upper trend line (orange) - inheritance, connects lower and lower peaks.
• Lower support line (red) - approx. 116,700 USD - key support, tested many times.
🔻 Support
USD 116,700
Tested several times, currently threatened
🔻 Another support
USD 114,669
Target level when struck with a triangle
🔼 Resistance
USD 118,321
The nearest resistance - the former level of support
🔼 Resistance
USD 119,931
Local peak
🔼 Strong resistance
USD 121,107
Upper level of structure
📉 STOCHASTIC RSI (lower indicator)
• Line cutting and a decrease in the purchase area (> 80) towards the center.
• No extreme sales signal, but the trend begins to be negative.
⸻
📌 Applications and possible scenarios:
🔻 Bearish script (more technically likely):
• If BTC breaks below USD 116,700 with a 4H candle closure, possible:
• a decrease around USD 114,669 (lower limit of the triangle)
• Even lower - around 113,500-112,000 USD with an increased volume
🔼 Bullly script (less likely but possible):
• needed quick breaking above USD 118,300 and maintaining above this level
• Then the goal will be USD 119,931, and then possible traffic up to USD 121.107
⸻
📍 Summary:
• We see classic triangle descending-pro-draft formation.
• Support 116,700 USD very close to breaking - if it falls, down movement can be dynamic.
• Stochastic RSI coincides with the deterioration of the moment.
• The inheritance scenario seems dominant, unless there is a strong demand and over 118,300 USD.
7/31/25 - $weav - Just watching tn7/31/25 :: VROCKSTAR :: NYSE:WEAV
Just watching tn
- this tape has enough issues where $10 or $15 or $25 bn companies can't catch a needed bid for fcf yields and growth far in excess of what fiat IOU's yield
- so i already have my "favorite" $500 mm c'mon let'sgoco called NASDAQ:GAMB and liquidity and size seem to matter right now
- which (see private notes on chart) is why i am not going to complicate my life w/ this one tonight. but probably a dip buy esp if there's some sort of growth hiccup and i'd have time to investigate
- all in, this seems like a cool niche software co that hasn't really turned the corner on opex inflection to get toward DD ebitda mgns, but where if there remains progress as we've seen over the last year, it will be a matter of time
- tough to value this in a typical context
- so i'd say so far i like rev growth and sales flex on opex line, "therefore" R&D seems to be producing
- you all know rule of thumb, but in this tape let's put a heftier discount rate on 40 mm annualized budget of 20% (a defensibly conservative bar) and that's 40/.2 = 200 mm.. stock at 500 mm cap and you know i like to 2x that r&D budget, which says anything below 20% is a pretty easy dip buy for me (ex structural issues which i'd need to investigate). anything 15%... let's see. shallow 10%.. pass and look later. and if it's up... it just remains on the eternal watchlist.
be well
V

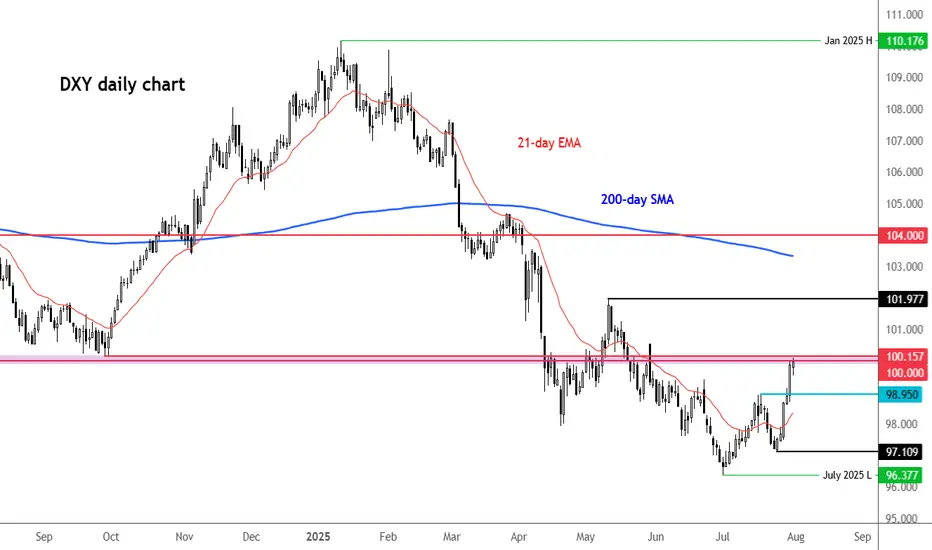
DXY testing 100.00 resistanceThe US dollar index has risen to rest a key resistance area around the 100.00 level. Previously a key support and resistance zone, what happens here could determine the near-term technical direction for the US dollar.
Key support below this zone is at 98.95, marking a prior resistance. Given the short-term bullish price structure, I would expect this level to hold if the greenback were to ease back from here.
If the bullish momentum gathers pace, then 101.00 could be the next stop, followed by the recent high of 101.97.
From a macro point of view, resilient economic data and persistent core inflation concerns continue to support the Federal Reserve’s cautious policy approach. Today’s core PCE inflation reading came in slightly above forecast, at 2.8% year-over-year versus the expected 2.7%. In addition, jobless claims were better than anticipated, registering 218,000 compared to the 224,000 forecast. The Q2 Employment Cost Index also surprised to the upside, rising 0.9% quarter-on-quarter.
These figures follow yesterday’s stronger-than-expected GDP report and a solid ADP private payrolls release, further underscoring the strength of the U.S. economy.
Attention now turns to Friday’s nonfarm payrolls report, which could have a meaningful impact on rate expectations. Fed Chair Jerome Powell has emphasized the importance of the unemployment rate as a key metric, so any upside surprise could reinforce the Fed’s current position.
However, expectations are not very high for the non-farm payrolls report. Current forecasts suggest an increase of 106,000 jobs, with average weekly earnings rising 0.3% month-over-month, and the unemployment rate edging up to 4.2%. Yet, the scarcity of strong leading indicators this month adds a layer of uncertainty to the outlook.
By Fawad Razaqzada, market analyst with FOREX.com
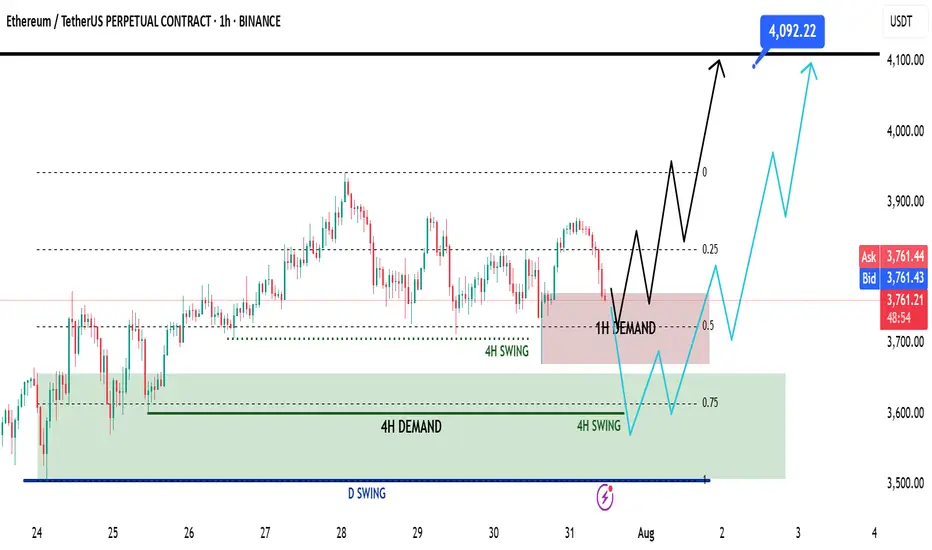
Ethereum Mid Week Update - Swing Long Idea📈 Market Context:
ETH remains in a healthy bullish structure. Despite the recent retracement, price action is still supported by strong demand zones on higher timeframes. No change in the overall sentiment from earlier this week.
🧾 Weekly Recap:
• Price rejected from the Fibonacci 0.5 EQ level — a discounted zone in my model.
• While doing so, it also ran 4H swing liquidity.
• After taking liquidity, ETH formed a 1H demand zone — a sign to look for lower timeframe confirmations for long setups.
📌 Technical Outlook:
→ Price has already tapped into the 1H demand zone.
→ From here, we have two possible scenarios:
Black scenario (ideal):
• Wait for 15M bullish break of structure (BOS).
• Enter after confirmation for long setups from 1H demand.
Blue scenario (deeper retrace):
• If no bounce from 1H demand, expect price to dip toward 0.75 Fib level (max discount).
• Watch for another liquidity run & 1H–4H demand formation.
🎯 Setup Trigger:
✅ 15M bullish BOS inside 1H or 4H demand zones
→ This would be the entry confirmation trigger for longs.
📋 Trade Management:
• Stoploss: Below the swing low of the 15M BOS
• Target: 4090$
💬 Like, follow, and drop a comment if this outlook helped — and stay tuned for more setups each week!
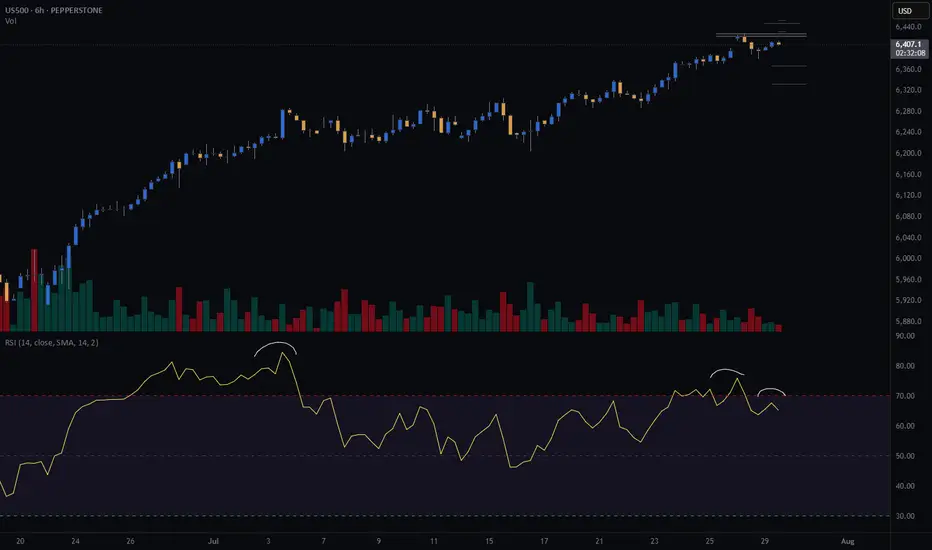
S&P500 (CASH500) SHORT - Double top H6Risk/reward = 3.7
Entry price = 6432.6
Stop loss price = 6 454.1
Take profit level 1 (50%) = 6367.7
Take profit level 2 (50%) = 6332.6
Still need confirmation from some variables before entering the trade
Berkshire Hathaway looks appealing in todays market conditionsWith most markets at all time highs it is becoming increasingly difficult to find good opportunities for buying. I have decided to allocate about 9% of my portfolio to Berkshire Hathaway as a sort of hedge against some of my other positions. I like to have a diverse exposure to the markets and with Berkshire Hathaway being a conglomerate it is a perfect stock for someone like me to invest in. The stock seems to be doing the opposite of the us500 so far this year hence why I call it a hedge. According to my simple technical analysis there is a probability for the stock to make a reversal after spending some time going down.
The company has already donated plenty of shares which probably has something to do with it going down, which presents a unique opportunity to invest in it since there is nothing fundamentally wrong with the company. With that being said they have also said they probably wont engage in share buy backs until next year at least so it could be a falling knife type situation. However I am confident in the company and feel like it is a great stock to have in my portfolio for the long term.
The range of the intrinsic value according to the discounted cash flow model is between $400-$1000 with a 5 year exit. Assuming a 7.4% discount rate the intrinsic valuation for the stock is $575 presenting a unique opportunity for a 20% upside. The stock is certainly undervalued but like I said it could be a falling knife in the worst case scenario. Calculating the intrinsic value is highly speculative and complex, but it gives me increased confidence in my decision to push the buy button. I hope you found my analysis useful, drop a comment if you want to talk more about the stock or whatever.

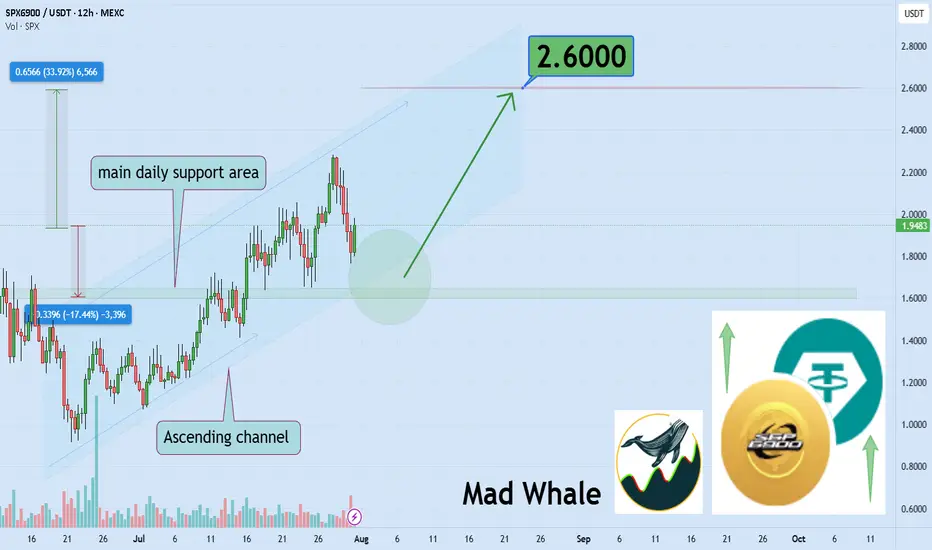
SPX6900 Bulls Eyeing 33% Surge Toward Explosive $2.60 TargetHello✌
Let’s analyze SPX6900’s upcoming price potential 📈.
MEXC:SPXUSDT has maintained strong bullish momentum in recent weeks, supported by a stream of positive fundamentals 📈. The price is currently holding within an ascending channel and resting near daily support. If this level holds, a 33% upside toward the $2.60 target could follow 🚀
✨We put love into every post!
Your support inspires us 💛 Drop a comment we’d love to hear from you! Thanks , Mad Whale