Trading Divergences With Wedges in ForexTrading Divergences With Wedges in Forex
Divergence trading in forex is a powerful technique for analysing market movements, as is observing rising and falling wedges. This article explores the synergy between divergence trading and wedges in forex, offering insights into how traders can leverage these signals. From the basics to advanced strategies, learn how you could utilise this approach effectively, potentially enhancing your trading skills in the dynamic forex market.
Understanding Divergences
In forex trading, the concept of divergence plays a pivotal role in identifying potential market shifts. A divergence in forex, meaning a situation where price action and a technical indicator like the Relative Strength Index (RSI) or Moving Average Convergence Divergence (MACD) move in opposite directions, often signals a weakening trend. This discrepancy is a valuable tool in divergence chart trading, as it may indicate a possible reversal or continuation of the current trend.
There are two primary types of divergence in forex—regular and hidden. Regular divergence occurs when the price makes higher highs or lower lows while the indicator does the opposite, often signalling a reversal. Hidden divergence, on the other hand, happens when the price makes lower highs or higher lows while the indicator shows higher highs or lower lows, typically suggesting a continuation of the current trend.
Trading Rising and Falling Wedges
Rising and falling wedges are significant patterns in forex trading, often signalling potential trend reversals. A rising wedge, formed by converging upward trendlines, often indicates a bearish reversal if it appears in an uptrend. Conversely, a falling wedge, characterised by converging downward trendlines, typically reflects a bullish reversal if it occurs in a downtrend.
Traders often look for a breakout from these patterns as a signal to enter trades. For rising wedges, a downward breakout can be seen as a sell signal, while an upward breakout from a falling wedge is often interpreted as a buy signal. When combined with divergences, this chart pattern can add confirmation and precede strong movements.
Best Practices for Trading Divergences
Trading divergence patterns in forex requires a keen eye for detail and a disciplined, holistic approach. Here are key practices for effective trading:
- Comprehensive Analysis: Before trading on divergence and wedges, be sure to analyse overall market conditions.
- Selecting the Right Indicator: Choose a forex divergence indicator that suits your trading style. Common choices include RSI, MACD, and Stochastic.
- Confirmation Is Key: It’s best to watch for additional confirmation from price action or other technical tools before entering a trade.
- Risk Management: Traders always set stop-loss orders to manage risk effectively. Divergence trading isn't foolproof; protecting your capital is crucial.
- Patience in Entry and Exit: Be patient as the divergence develops and confirm with your chosen indicators before entering or exiting a trade.
Strategy 1: RSI and Wedge Divergence
Traders focus on regular divergence patterns when the RSI is above 70 (overbought) or below 30 (oversold), combined with a rising or falling wedge pattern. The strategy hinges on identifying highs or lows within these RSI extremes. It's not crucial if the RSI remains consistently overbought or oversold, or if it fluctuates in and out of these zones.
Entry
- Traders may observe a regular divergence where both the price highs/lows and RSI readings are above 70 or below 30.
- After the formation of a lower high (in an overbought zone) or a higher low (in an oversold zone) in the RSI, traders typically watch as the RSI crosses back below 70 or above 30. This is accompanied by a breakout from a rising or falling wedge, acting as a potential signal to enter.
Stop Loss
- Stop losses might be set just beyond the high or low of the wedge.
Take Profit
- Profit targets may be established at suitable support/resistance levels.
- Another potential approach is to exit when the RSI crosses back into the opposite overbought/oversold territory.
Strategy 2: MACD and Wedge Divergence
Regarded as one of the best divergence trading strategies, MACD divergence focuses on the discrepancy between price action and the MACD histogram. The strategy is particularly potent when combined with a rising or falling wedge pattern in price.
Entry
- Traders typically observe for the MACD histogram to diverge from the price. This divergence manifests as the price reaching new highs or lows while the MACD histogram fails to do the same.
- The strategy involves waiting for the MACD signal line to cross over the MACD line in the direction of the anticipated reversal. This crossover should coincide with a breakout from the rising or falling wedge.
- After these conditions are met, traders may consider entering a trade in anticipation of a trend reversal.
Stop Loss
- Stop losses may be set beyond the high or low of the wedge, which may help traders manage risk by identifying a clear exit point if the anticipated reversal does not materialise.
Take Profit
- Profit targets might be established at nearby support or resistance levels, allowing traders to capitalise on the expected move while managing potential downside.
Strategy 3: Stochastic and Wedge Divergence
Stochastic divergence is a key technique for divergence day trading in forex, especially useful for identifying potential trend reversals. This strategy typically employs the Stochastic Oscillator with settings of 14, 3, 3.
Entry
- Traders may look for divergence scenarios where the Stochastic readings are above 80 or below 20, mirroring the RSI approach.
- This divergence is observed in conjunction with price action, forming a rising or falling wedge.
- Entry may be considered following a breakout from the wedge, which signals a potential shift in market direction.
Stop Loss
- Setting stop losses just beyond the high or low of the wedge might be an effective approach.
Take Profit
- Profit targets may be set at key support/resistance levels.
The Bottom Line
Divergence trading, coupled with the analysis of rising and falling wedges, offers a comprehensive approach to navigating the forex market. By integrating the discussed strategies with sound risk management and market analysis, traders may potentially enhance their ability to make informed decisions in the dynamic world of forex.
This article represents the opinion of the Companies operating under the FXOpen brand only. It is not to be construed as an offer, solicitation, or recommendation with respect to products and services provided by the Companies operating under the FXOpen brand, nor is it to be considered financial advice.
Fundamental Analysis

Trading Idea XAUUSD 🎯 Trade Ideas Based on Structure
1. Long Reversal Play (Buy)
📍 Entry: If price retests the support zone around 3,356–3,366 and shows bullish confirmation (e.g. bullish engulfing, pin bar)
🎯 Target: 3,390–3,402 (resistance zone)
🛡️ Stop Loss: Just below 3,355
💡 Why? Buying into support with confirmation aligns with the projected rebound idea
2. Sell into Resistance
📍 Entry: If price rallies to 3,390–3,402 and stalls with weak candles or bearish divergence
🎯 Target: Back to support zone (~3,366 or lower)
🛡️ Stop Loss: Above 3,405
💡 Why? Fading into resistance follows the broader trend while using the shaded zone for timing
3. Breakout Trade (Buy)
📍 Trigger: If price breaks cleanly above 3,402 and closes with strong momentum
🎯 Target: Look toward next resistance (~3,410+)
🛡️ Stop Loss: Below breakout candle (~3,390)
💡 Why? Signals a trend shift or strong bullish move against the recent downtrend
🧠 Smart Trading Tips
Let the candles lead the decision—watch for confirmation before jumping in
Stick to the higher probability zones and avoid overtrading in the middle
Use volume or RSI to filter false breakouts or weak entries
XAUUSD
XAUUSD Updated in H1 :
The gold signal is marked on the chart based on the latest price changes and the supply and demand in the market. These points include the entry point, stop loss, and take profit
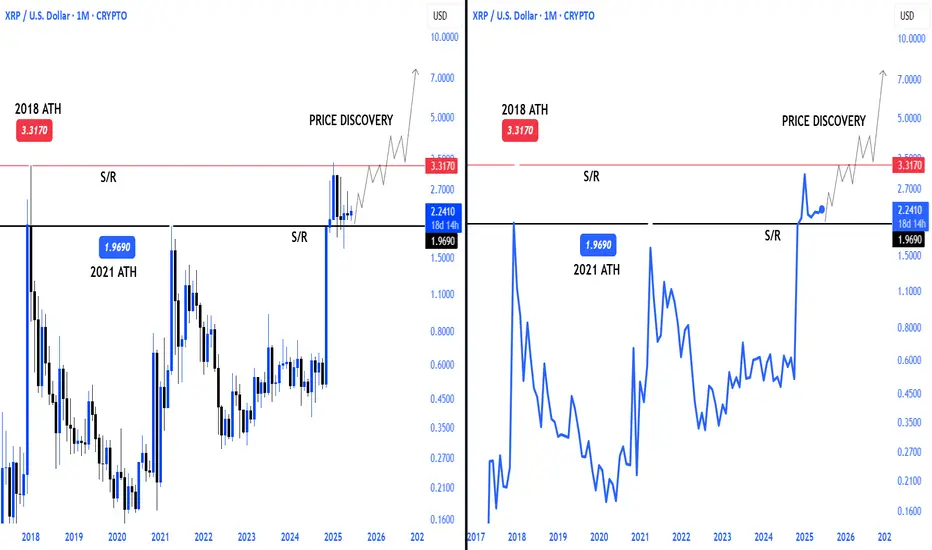
XRP CRYPTOCAP:XRP price discovery will be there sooner or later
2021 I think the current accumulation process on the ath price will be the trigger for an upward movement
Comprehensive Analysis: SHORT Signal on XRPUSDT1. News Analysis (Market Sentiment)
The news actually reflects a strongly positive sentiment for XRP’s long-term fundamentals:
"Brazil's VERT Debuts Tokenized Credit Platform on XRP Ledger With $130M Issuance" : This is a very bullish piece of news. It highlights real-world adoption of the XRP Ledger (XRPL) for high-value transactions.
"VERT Launches Blockchain Platform on XRPL for $130M Deal" : This is the same news reported by a different source, confirming the significance of this adoption.
Bridging the Analysis:
Here lies the crucial difference between investors and traders. As long-term investors, this kind of news would motivate us to buy and hold XRP. But as day traders, we understand the common market behavior of “Buy the Rumor, Sell the News.”
The massive price rally before this announcement might indicate the market already anticipated this news. Now that the news is official, early buyers may begin taking profits, triggering selling pressure.
Sentiment Conclusion:
While the news is fundamentally positive, it could strengthen the case for a SHORT position in the short term. This “sell on good news” reaction is a common phenomenon in trading.
2. Technical Analysis (Chart Structure)
The daily chart of XRPUSDT supports a SHORT position even more convincingly:
Climactic Top Rejection : A sharp price rally ends with a long upper wick candle around the $3.60 area. This is a classic sign of buyer exhaustion and aggressive seller entry.
Short-Term Bearish Structure : A large red candle formed after the top, signaling that sellers have taken control. The current price is trading well below that top, confirming the rejection was valid.
Room for Correction : Below the current price, there’s a clear “gap” or market inefficiency. The first logical target for a correction is around $2.80 - $2.90, where the 50 EMA meets the upper edge of the Fair Value Gap (green box). This gives us a clean profit target.
Combined Conclusion:
Yes, based on a combination of “Sell the News” sentiment and clear bearish technical structure, the argument for a SHORT position on XRPUSDT is very valid. We are going against the positive headlines, but following price action signals.
Trading Plan: SHORT Operation on XRPUSDT
Position: SHORT
Asset: XRPUSDT (Perpetual Contract)
Current Status: ENTRY
Entry Reason:
We’re entering based on short-term bearish momentum after a strong rejection from the supply zone, expecting the price to fill the inefficiency below.
Entry Type: Market Order
Why: The bearish move is in progress. We want to catch it now before the price drops further and skips our limit order. We'll execute at the current market price (~$3.01).
Stop Loss (SL): $3.62
Why: Placed slightly above the previous swing high. If price breaks this level, our SHORT thesis is invalid, and we exit to prevent further losses.
Take Profit (TP) Targets & Risk/Reward:
We'll scale out profits in phases to lock in gains.
TP1: $2.85
Why: Confluence of 50 EMA and top of Fair Value Gap
Risk/Reward: ~1:2.8 (Risking $0.61 to gain $1.75 — very healthy ratio)
TP2: $2.55
Why: Mid-point of the Fair Value Gap — a common magnet for price
TP3: $2.25
Why: Full gap fill + retest of prior support/resistance area
TP4: $1.85
Why: Ambitious target — filling the second, deeper Fair Value Gap. Possible in a panic-driven selloff.
Position Management:
Once TP1 is hit:
Move SL to Entry ($3.01) to secure a risk-free trade on the remaining position.
We’ll continue to monitor the price and adjust the trailing stop loss as each TP level is reached.

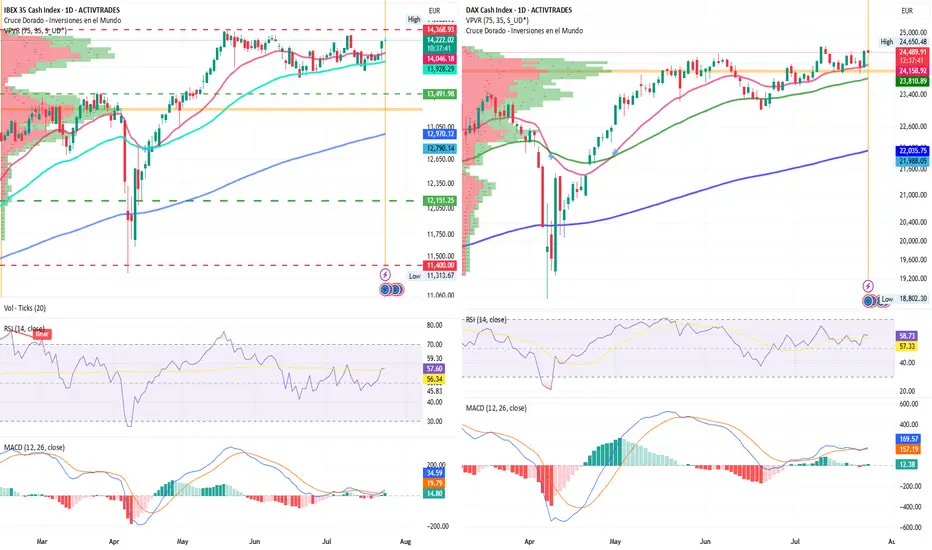
IBEX 35 Leads European Gains, DAX Enters Price Discovery ModeIBEX 35 lider of european bullish advances in the tariff agreements
By Ion Jauregui – Analyst at ActivTrades
European markets kick off the day with strong gains, driven by renewed optimism over trade negotiations between the United States and China. In this context, IBEX 35 futures surge by 1.52% to 14,273 points, positioning the index as one of the top performers in Europe. Meanwhile, Germany’s DAX 40 also rises 1.34% to 24,635 points.
News of potential tariff agreements, combined with growing expectations of a more accommodative stance from the European Central Bank (ECB), are pushing major European indices higher. The French CAC 40 climbs 1.56%, while the EuroStoxx 50 gains 1.33%, reflecting renewed risk appetite across the board.
Global Context: Asian Rebound and Moderate Commodities Euphoria
The upbeat tone isn’t limited to Europe. In Asia, major indices closed in the green, and the Australian dollar hit an eight-month high, reflecting investor optimism around global trade and corporate earnings. Oil prices are also rising, supported by a larger-than-expected drop in U.S. crude inventories and expectations of stronger global demand.
All Eyes on the ECB
Today’s highlight is the ECB meeting, where a decision on interest rates will be announced. While no major surprises are expected, investors will be watching closely for clues on the timing of future rate cuts—especially in light of recent inflation and activity data.
Additional key data scheduled for release today:
Unemployment and PPI in Spain
Composite PMIs for Germany, France, the Eurozone, and the U.S.
U.S. housing data and jobless claims
Corporate Outlook: IBEX Boosted by Strong Earnings
Several IBEX 35 companies are in the spotlight due to positive developments:
Banco Sabadell targets a 16% return on equity by 2027, supported by a €6.3 billion shareholder payout plan.
Indra nearly doubles profits, fueled by operational gains and revaluation of its stake in TESS.
ACS acquires Segade to strengthen its position in the data center sector.
Telefónica is in talks with AXA to join its fiber joint venture with Vodafone.
Santander makes a €1 billion bid for Mercedes’ leasing division.
Technical Analysis – IBEX 35: Key Zone at 14,300 Points
The IBEX 35 shows a clear structure of higher lows since the beginning of the month. Breaking above the 14,200-point level, an intermediate resistance, reinforces its short-term bullish outlook. The index is now approaching the 14,300–14,350 zone, which has acted as a ceiling since May.
This is a pivotal area; a failure to break through could form a triple top pattern, potentially triggering a correction toward support at 13,698 or even lower toward the control area near 13,491. A consolidation above 14,350, however, could set the stage for a new upward leg toward 14,500 points, provided the ECB maintains a dovish tone.
Momentum indicators support the move, although they are nearing overbought levels. RSI stands at 57.89%, while the MACD remains positive and climbing above the histogram.
Technical Analysis – DAX 40: Eyeing a Break Above 24,700
The DAX 40 is also benefiting from global bullish momentum. After consolidating above 24,300, a breakout above the 24,650 resistance could trigger a move toward the 24,700–24,800 zone, pushing the index beyond its all-time highs recorded in June.
A daily close above 24,800 would place the German index firmly in price discovery mode, with the next psychological target at 25,000 points. The RSI remains strong at 58.84%, with no immediate signs of exhaustion, while the MACD confirms the bullish signal from last week, expanding well above the histogram—though momentum appears moderate.
Conclusion
Progress in trade negotiations and expectations of a dovish ECB are setting the stage for a bullish session in European markets. The IBEX 35 leads the rally, supported by strong corporate results and technical strength, while the DAX 40 continues its upward trend, with potential for new all-time highs. Today’s ECB decision could be a turning point if it confirms the accommodative stance the market is anticipating.
*******************************************************************************************
The information provided does not constitute investment research. The material has not been prepared in accordance with the legal requirements designed to promote the independence of investment research and such should be considered a marketing communication.
All information has been prepared by ActivTrades ("AT"). The information does not contain a record of AT's prices, or an offer of or solicitation for a transaction in any financial instrument. No representation or warranty is given as to the accuracy or completeness of this information.
Any material provided does not have regard to the specific investment objective and financial situation of any person who may receive it. Past performance and forecasting are not a synonym of a reliable indicator of future performance. AT provides an execution-only service. Consequently, any person acting on the information provided does so at their own risk. Political risk is unpredictable. Central bank actions can vary. Platform tools do not guarantee success.
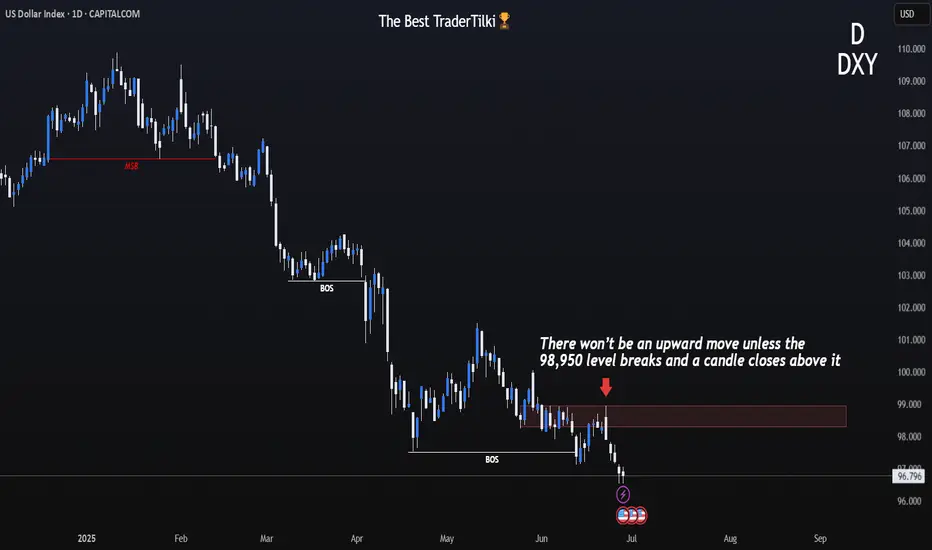
DXY 1D – Tipping Point: News or Price Action?Hey Guys,
The DXY index is currently moving within a downtrend. This trend is unlikely to reverse unless it breaks above the 98.950 level.
Sure, key fundamental data could shift the trend, but without those news catalysts, a reversal at this point doesn’t seem realistic.
Don’t forget—98.950 is a critical threshold for the DXY.
I meticulously prepare these analyses for you, and I sincerely appreciate your support through likes. Every like from you is my biggest motivation to continue sharing my analyses.
I’m truly grateful for each of you—love to all my followers💙💙💙
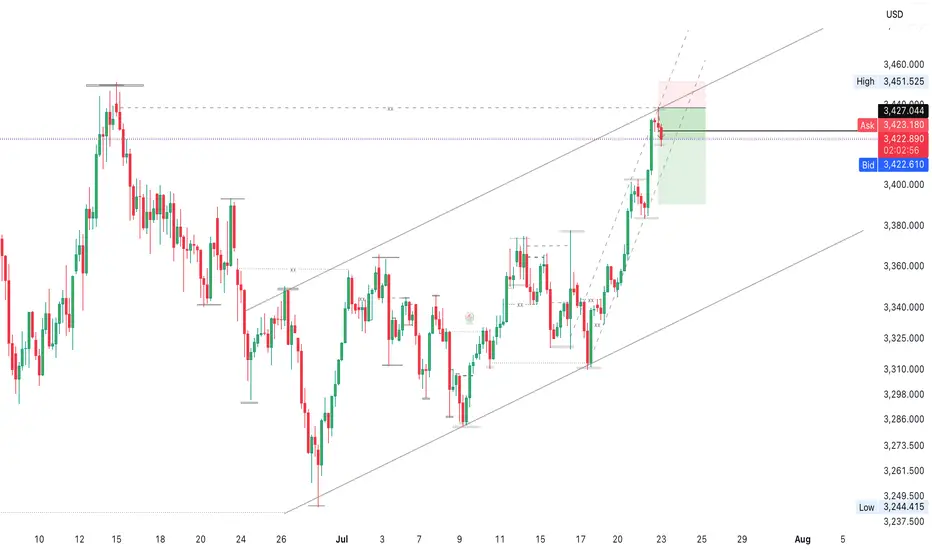
Gold Market Completes Bullish Wedge at 3439Gold market lures to 3439, completing the bullish wedge formation as anticipated.
A retracement is now setting in, with price action expected to sweep through 3391—a key zone that may determine the next leg of the trend.
Watch closely for confirmation at this level for a potential bullish continuation or deeper correction. follow for more insight , comment and boost idea
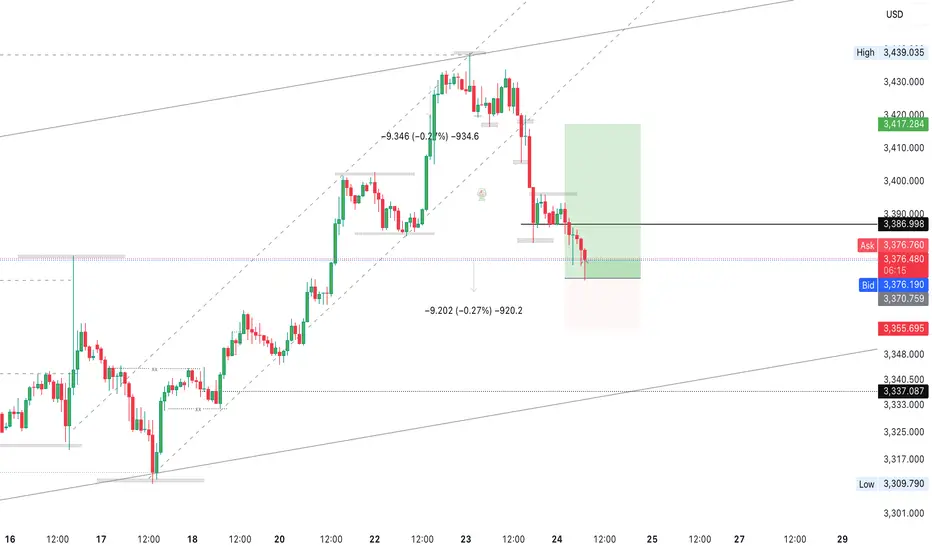
Gold Market Shorts to 3370's, Eyes Pullback to 3400'sGold market initiates a short move down to 3370's, reacting to short-term resistance.
A pullback stance is now forming, targeting a potential retracement back through to the 3400's, follow for more insights , comment and boost idea
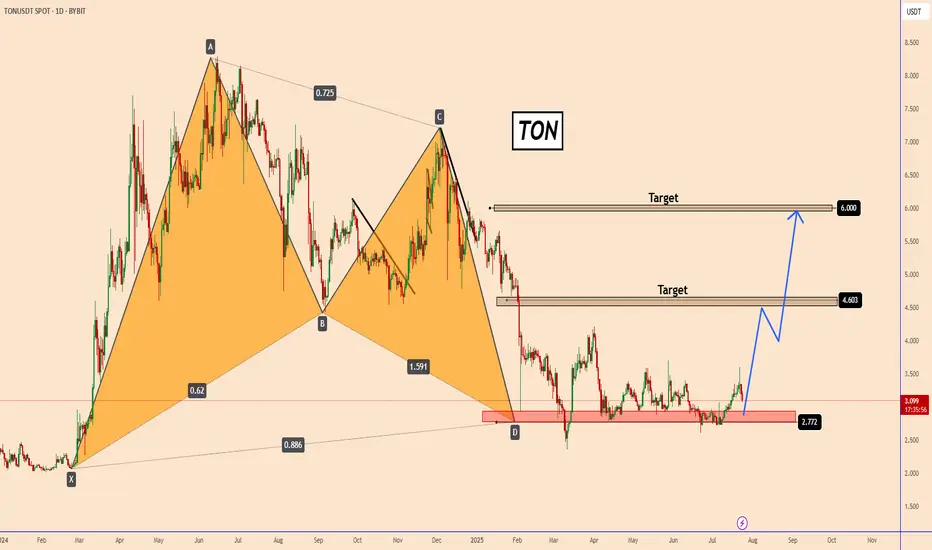
TON: The Bullish harmonic pattern could push TON back upTON: The Bullish harmonic pattern could push TON back up
On the Daily Chart, TON completed a strong harmonic upward move near 2.7500.
The price has been holding in this area since early February 2025.
It looks like this was the end and the price is rallying before making another upward move.
I am looking for two targets.
The first is near 4.60 which also corresponds to a strong structure area and the second is near 6 where the price spent a long time around this area.
You may find more details in the chart!
Thank you and Good Luck!
PS: Please support with a like or comment if you find this analysis useful for your trading day
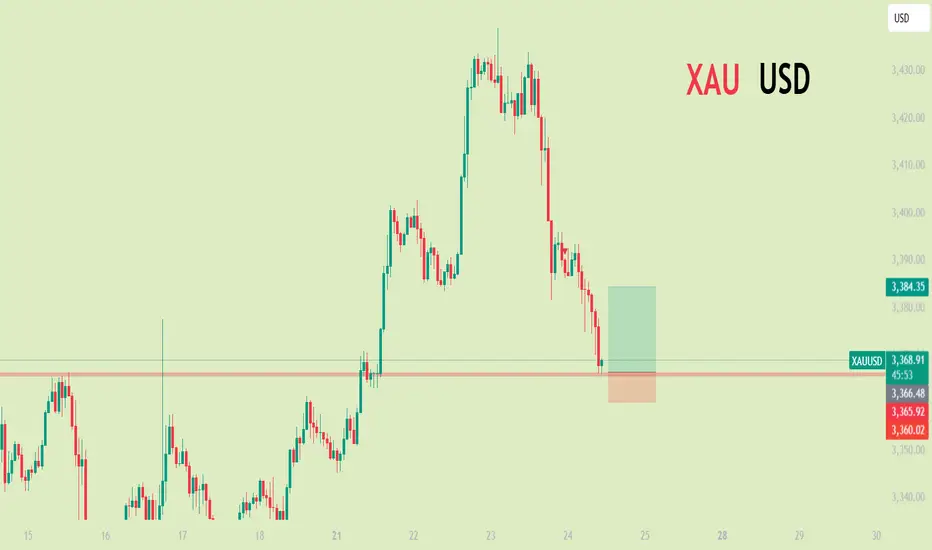
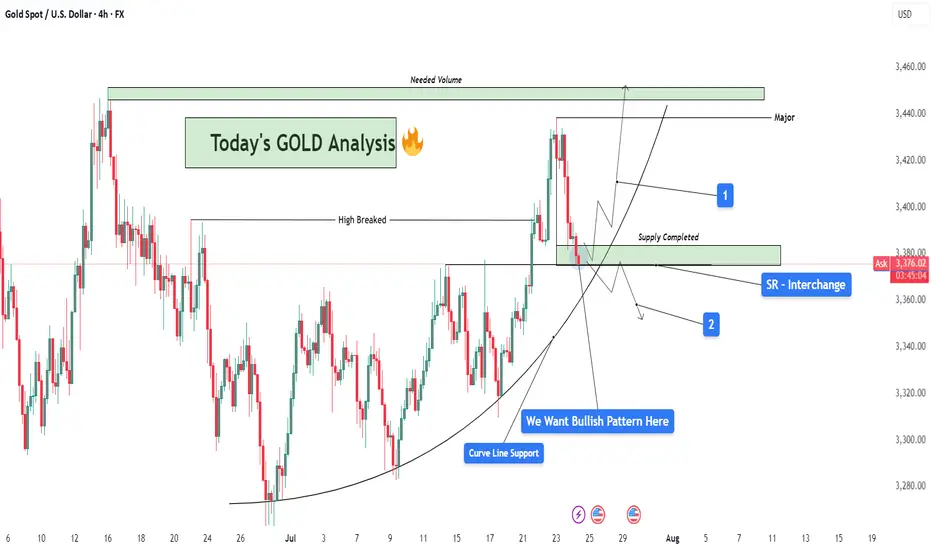
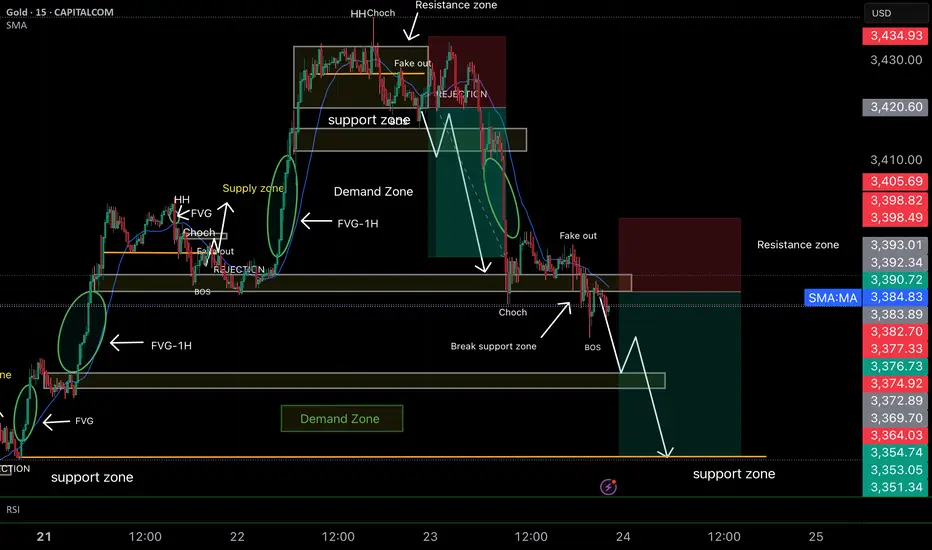
GOLD Analysis : SR Interchange , Reversal Zone + High Break🧠 Market Context & Structural Overview:
Gold has been trading within a clearly defined bullish structure after forming a rounded base pattern in early July, indicating accumulation by smart money. The market recently broke through a key horizontal resistance (previous swing high), marking a potential bullish continuation phase. However, we are now witnessing a pullback — a healthy corrective phase — that is currently testing multiple high-probability confluences.
🧱 Key Technical Zones Explained:
🔹 1. SR Interchange Zone – High Probability Reversal Area:
This area (roughly between $3,360 and $3,380) acted as previous resistance (supply) and has now flipped into support.
This is a textbook Support-Resistance Interchange (SR Flip) — a concept where prior resistance becomes new support.
Traders often look for entries here, especially when it aligns with other technical factors.
🔹 2. Curve Line Support – Dynamic Buyer Strength Indicator:
A curved trendline, often referred to as a parabolic support, has been respecting price structure for over two weeks.
Price is now sitting exactly on this support, signaling potential for another impulsive bullish leg if momentum builds.
🔹 3. Supply Zone Completed – Correction Phase Active:
The supply zone above (approx. $3,420–$3,440) has already been tapped and respected by the market.
This “completed” supply may now act as resistance unless broken with strong volume — we now watch how price reacts at the current pullback zone.
📊 What the Candles Are Telling Us:
The latest candles show some hesitation from sellers — wick rejections and smaller body candles hint at buyer interest at this level. However, confirmation is crucial. We want to see a bullish reversal pattern such as:
Bullish engulfing
Morning star
Pin bar (hammer)
Break and retest of minor resistance inside the SR zone
🔮 Scenarios to Watch:
✅ Scenario 1 – Bullish Continuation (Ideal Setup):
If a bullish reversal forms at this support zone:
Expect a potential rally back to the $3,420–$3,440 resistance area.
If this zone breaks with high volume, price could target the major supply zone near $3,465+, where we’ll need “Needed Volume” for a decisive break.
⚠️ Scenario 2 – Bearish Breakdown (Alternative View):
If the curve support and SR zone fail to hold:
Expect a drop towards $3,345 – $3,320 — where next structural support lies.
This would suggest a deeper retracement or range formation before bulls can regroup.
🧩 Strategy & Psychology:
“We want bullish pattern here.”
You’ve highlighted the importance of not entering impulsively. This is about trading with confirmation, not prediction. Waiting for a valid bullish pattern reduces risk and increases probability.
This is where smart traders win — waiting patiently for confirmation at a zone of confluence.
🧠 Learning Mindset – Why This Zone Matters:
Combines horizontal support, curved trendline, and broken structure retest.
This zone is the battleground between bulls and bears — whoever wins here will likely control short-term momentum.
Newer traders can study this as a classic example of multi-confluence trading, which combines price action, market structure, and dynamic trendlines.
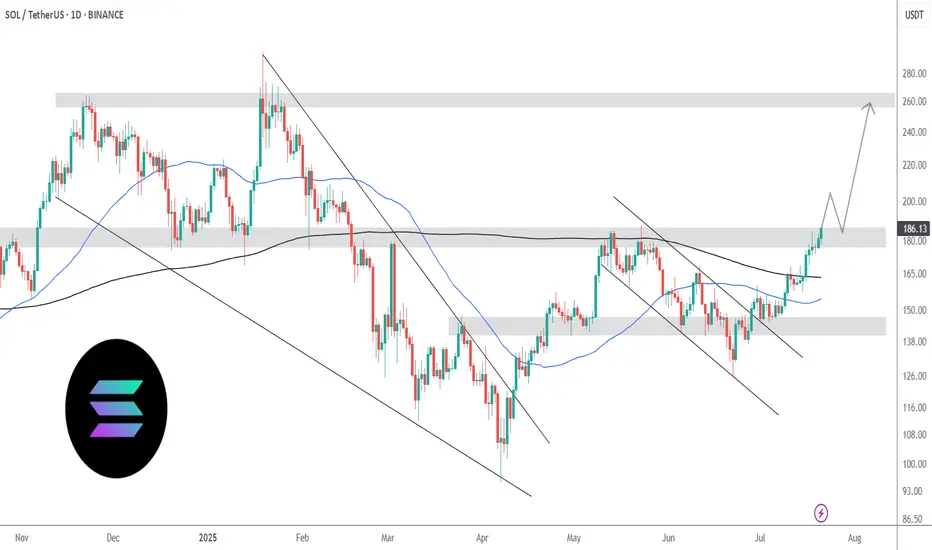
Solana is undervalued | New ATH coming very soon | $250++Solana is slowly but surely grinding up, following the altcoin king ETH. ETH is already near its 2024 highs of $4000. If SOL were to be in the same position as ETH in terms of price, we should be around $250.
In technical terms, SOL is showing huge bullish strength at the $180 resistance. In the last attempt in breaking above this level, it faced multiple rejections and consolidated before ultimately backing down. This time, there is little to no resistance.
The REX-Osprey SOL staking ETF continues to garner inflows, having only one outflow day since the launch date 2nd July. That's nearly $100 million net inflows and 11 inflow days out of 12 trading days. Imagine the demand the spot SOL ETF by big players such as VanEck, Grayscale and Fidelity will have once approved.
BTC dominance is breaking below 60%. Capital is flowing from BTC into ETH, and once ETH hits $4000, a good amount will flow from ETH to SOL as people look for better potential gains.
GBPJPY outlook: Potential Sell Setup FormingPrice action has recently broken out of a sustained uptrend and completed a retest of the former trendline support, now acting as resistance. This behavior suggests a potential bearish setup is developing.
📉 Entry Level: ~198.700
🛑 Stop Loss: 199.200
🎯 Take Profit Targets:
• TP1: 196.515
• TP2: 194.521
We’re now watching for confirmation to enter short, anticipating a move toward the stated profit targets should momentum continue to shift in favor of the bears.

SMC Strengths of the Analysis
• ✔️ Clear bearish structure (ChoCH + BOS + fake out)
• ✔️ Mitigation target (1H FVG not yet closed)
• ✔️ SL well protected outside the manipulation zone
• ✔️ Logical entry right where the imbalance begins
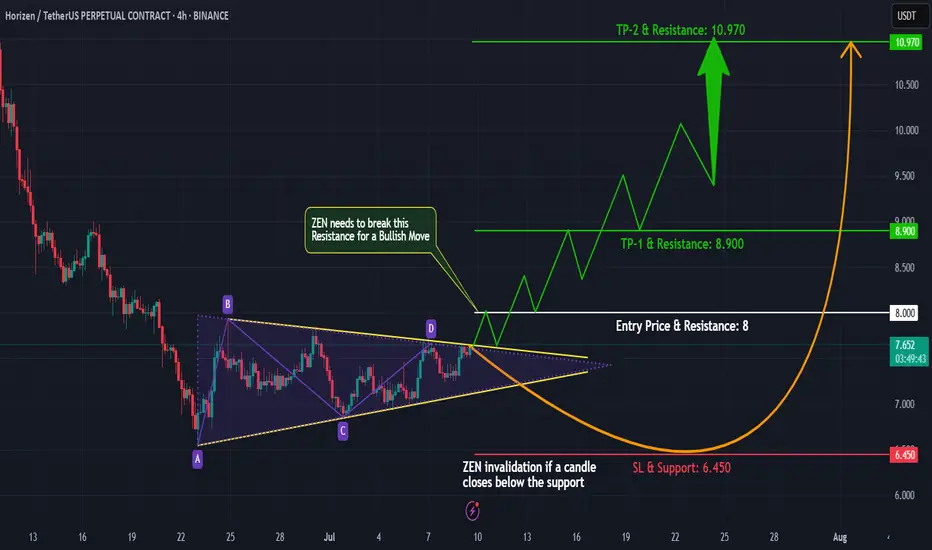
ZENUSDT | Triangle Breakout Setup Brewing!#ZEN is currently consolidating in a symmetrical triangle pattern on the 4-hour timeframe, following a strong bearish move. The price action has shifted to a sideways range, signaling a potential trend reversal or continuation setup in the making.
What to Watch:
We’re closely monitoring a bullish breakout from the triangle or resistance zone.
A confirmed breakout with a successful retest will trigger our long entry.
As always, proper risk management is key – wait for confirmation before entering.
Trade Plan:
✅ Wait for breakout above resistance
✅ Look for volume confirmation
✅ Enter on retest with a tight stop-loss
✅ Target recent highs for a solid R:R setup
What’s your take on #ZEN? Do you see a breakout coming or more chop ahead? Drop your thoughts in the comments!
Follow me for more real-time crypto setups and chart breakdowns!
#ZEN #CryptoTrading #PriceAction #TrianglePattern #BreakoutTrade #TechnicalAnalysis #ZENUSDT #Altcoins #TradingSetup #CryptoTA #BullishBreakout #SwingTrade #4hrChart #TradingViewIdeas
CHINA: Catch-Up Potential Remains AttractiveAs the U.S. stock market trades at all-time highs and has returned to its valuation levels of late 2021 (before the 2022 bear market), it may be wise to look at the Chinese stock market as a way to diversify your portfolio.
Regarding the analysis and potential of the S&P 500 Index, I encourage you to read my latest forward-looking study by clicking on the image below. Don’t forget to subscribe to our Swissquote account to be notified every morning when our new daily market analysis is published.
Let’s now turn back to the Chinese stock market. I believe Chinese equities still offer medium to long-term upside potential, both technically and fundamentally.
1) Strong catch-up potential from a fundamental valuation perspective
The Chinese stock market presents an interesting diversification opportunity from a valuation standpoint, with a Shiller PE ratio (CAPE) of 15 compared to 36 for the S&P 500.
Chinese equities are significantly cheaper than U.S. equities and also benefit from an ultra-accommodative monetary policy from the People's Bank of China and an expansionary fiscal policy by the Chinese government. These are key fundamental factors that support strong upside potential for Chinese equities.
2) From a technical standpoint, the ATH is the natural target for Chinese indices
Focusing on the technical analysis of the Shenzhen Composite Index (weekly chart), the setup is clear: a trading range between support at 7,500 points and resistance at 16,000 points. The market has recently built a bullish reversal pattern at the lower bound, making the upper range the natural technical target.
3) Yuan strengthening in Forex is a positive signal for Chinese equities
Finally, one more factor supports Chinese equities from a diversification angle: currency effect. The Yuan Renminbi is technically strengthening, and the USD/CNY pair has just rejected long-term resistance. As a result, international investors could benefit from a stronger CNY in the coming months.
DISCLAIMER:
This content is intended for individuals who are familiar with financial markets and instruments and is for information purposes only. The presented idea (including market commentary, market data and observations) is not a work product of any research department of Swissquote or its affiliates. This material is intended to highlight market action and does not constitute investment, legal or tax advice. If you are a retail investor or lack experience in trading complex financial products, it is advisable to seek professional advice from licensed advisor before making any financial decisions.
This content is not intended to manipulate the market or encourage any specific financial behavior.
Swissquote makes no representation or warranty as to the quality, completeness, accuracy, comprehensiveness or non-infringement of such content. The views expressed are those of the consultant and are provided for educational purposes only. Any information provided relating to a product or market should not be construed as recommending an investment strategy or transaction. Past performance is not a guarantee of future results.
Swissquote and its employees and representatives shall in no event be held liable for any damages or losses arising directly or indirectly from decisions made on the basis of this content.
The use of any third-party brands or trademarks is for information only and does not imply endorsement by Swissquote, or that the trademark owner has authorised Swissquote to promote its products or services.
Swissquote is the marketing brand for the activities of Swissquote Bank Ltd (Switzerland) regulated by FINMA, Swissquote Capital Markets Limited regulated by CySEC (Cyprus), Swissquote Bank Europe SA (Luxembourg) regulated by the CSSF, Swissquote Ltd (UK) regulated by the FCA, Swissquote Financial Services (Malta) Ltd regulated by the Malta Financial Services Authority, Swissquote MEA Ltd. (UAE) regulated by the Dubai Financial Services Authority, Swissquote Pte Ltd (Singapore) regulated by the Monetary Authority of Singapore, Swissquote Asia Limited (Hong Kong) licensed by the Hong Kong Securities and Futures Commission (SFC) and Swissquote South Africa (Pty) Ltd supervised by the FSCA.
Products and services of Swissquote are only intended for those permitted to receive them under local law.
All investments carry a degree of risk. The risk of loss in trading or holding financial instruments can be substantial. The value of financial instruments, including but not limited to stocks, bonds, cryptocurrencies, and other assets, can fluctuate both upwards and downwards. There is a significant risk of financial loss when buying, selling, holding, staking, or investing in these instruments. SQBE makes no recommendations regarding any specific investment, transaction, or the use of any particular investment strategy.
CFDs are complex instruments and come with a high risk of losing money rapidly due to leverage. The vast majority of retail client accounts suffer capital losses when trading in CFDs. You should consider whether you understand how CFDs work and whether you can afford to take the high risk of losing your money.
Digital Assets are unregulated in most countries and consumer protection rules may not apply. As highly volatile speculative investments, Digital Assets are not suitable for investors without a high-risk tolerance. Make sure you understand each Digital Asset before you trade.
Cryptocurrencies are not considered legal tender in some jurisdictions and are subject to regulatory uncertainties.
The use of Internet-based systems can involve high risks, including, but not limited to, fraud, cyber-attacks, network and communication failures, as well as identity theft and phishing attacks related to crypto-assets.

ARTY Can Easily Achieve +900% Profits - (ARTY/USDT)ARTY/USDT Can Easily Achieve +900% Profits
🔸About Artyfact:
Revolutionary AI Gaming Technologies
AI is rapidly changing the world and the gaming industry is no exception here. Artyfact setting a new standard for AI within the gaming industry, implementing innovative AI technologies that revolutionize not only the gaming experience, but also the game development process: - AI NPCs - AI content generation - AI cheat detection - AI Testing - AI Player-Experience Modeling - AI Data Analysis
🔸Technical Analysis:
If we look at the left side of the chart, the accumulated price formed a rising wedge pattern, later rising from 0.3670 to 1.8300. This was a price move of almost +400%.
Currently, the price is forming another rising wedge pattern. If it makes the same upward move as before, then AMEX:ARTY should rise near 1.5900 by almost +935%.
I am looking at 3 targets:
The first target is in the first area of the structure near $1,100, but this is a small target.
The second target is optimal in my opinion and should easily reach 1.5900 if history repeats itself.
The third target I am looking at is near 2.1500 considering that the fundamental outlook is also supporting its rise.
I am currently already buying.
Please manage the risk properly on every trade you take, as it is essential in trading.
🔸Details we need to know:
Investors have already locked in their profits from 3 years of staking, and now the selling pressure is over.
Recently, Artyfact launched the first Play-and-Win mode which will attract hundreds of thousands of new players. This will significantly increase the demand for AMEX:ARTY and increase its price, because players will be able to purchase game NFTs for just $ARTY.
You may find more details in the chart!
Thank you and Good Luck!
PS: Please support with a like or comment if you find this analysis useful for your trading day

Apple battles resistance area – Can Earnings Turn It Around?Shares in Apple Inc. (symbol ‘AAPL’) gained back a large percentage of the losses incurred at the beginning of the second quarter. The company’s earnings report for the fiscal quarter ending June 2025 is set to be released on Thursday, 31st of July, after market close. The consensus EPS is $1,42 compared to $1,40 of the same quarter last year.
2025 is a hard year for the company so far since it lost more than 17% of its share value. The recent minor bullish rally might give some hope for a positive overall result at the end of the year, but the price needs to rise above $260 to be considered a positive year, and the company is still far from this number. Also, the financial image of the company is not looking great with the current ratio at 0.82 as of 31 March 2025. This means that the company is not liquid enough to cover the short-term liabilities with the current assets at hand. The payout ratio (percentage of the total earnings of the company paid out as dividends) is at 15,74% indicating that the company is looking forward to keeping most of its earnings for economic growth/strength, which is a good sign for the overall performance of the company.
On the technical side, the price is testing the resistance area between the upper band of the Bollinger bands and the 50% of the weekly Fibonacci retracement level. The level of $212 is also an inside resistance area of price reaction in early May and early July, making it a strong technical resistance level. The Bollinger bands are quite expande,d showing that there is volatility to support big moves. The Stochastic oscillator is near the extreme overbought level, but it's not in there just yet. On the other hand, the moving averages are still validating an overall bearish trend in the market.

Microsoft hits record highs days before earnings dayMicrosoft Corporation (symbol ‘MSFT’) share price reached a new all-time high on July 17 at $511.70 while on July 18 it even reached $514.64 intraday. The company’s earnings report for the fiscal quarter ending June 2025 is expected to be released on Wednesday, July 30th, after market close. The consensus EPS is $3.35 against $2.95 of the same quarter last year.
Microsoft is still holding its higher market cap compared to its main competitor, Apple, with $3.75 trillion against $3.02 trillion. Recently, Microsoft’s web-based platform “SharePoint” was hijacked, with Microsoft quickly reacting with patches to resolve the issue. As of today, there was no significant effect on the share price, but as the story unfolds, we might see some market reaction.
Technical analysis shows that the price has found sufficient support on the lower band of the Bollinger bands in early April and has since entered a rather aggressive bullish rally until the day of this report being written. As a result of the bullish rally, the Stochastic oscillator has been pushed to extreme overbought levels and has recently corrected to neutral levels, hinting that the price could move in either direction in the near short term. On the other hand, the moving averages are still validating an overall bullish trend in the market while the Bollinger bands are quite contracted, showing that volatility has dried up, and it might take some time to witness any significant moves.

Gold peaked in the short term. Welcome a new trend?The previous rising structure of gold was broken, especially yesterday's rapid decline broke through the previous support of 3385. Although it rebounded slightly, it was difficult to change the adjustment. Yesterday's high point of the US market was at 3396-98 US dollars. Today, the adjustment trend continued. The dividing point between long and short is 3395 US dollars today. Before the price reaches here, do not consider long.
Many traders are confused. Why are there longs one day and shorts the next day? In fact, this is the characteristic of the volatile market. Breaking the key position cannot last. No matter what you think about the market, you must pay attention to the current shape changes. In the volatile market, you should consider the market of the day more, not the long-term direction.
From the 1-hour chart, the gold price rebounded near 3390 and shorted, and the profit range is 3370-3350.
The backup strategy is to break through 3400 and go long, and pay attention to 3415-3425 on the upside.
In other words, look for opportunities to short on a rebound below 3400 today, and adjust your thinking after breaking through the key resistance.

EURUSD ahead of the ECBYesterday, EURUSD continued its bullish movement, reaching 1,1780.
Today, the ECB will announce its decision on interest rates.
The news is scheduled for 1:15 PM, followed by a press conference 30 minutes later.
Expect possible sharp and misleading price movements — reduce your risk and avoid rushing into new positions!
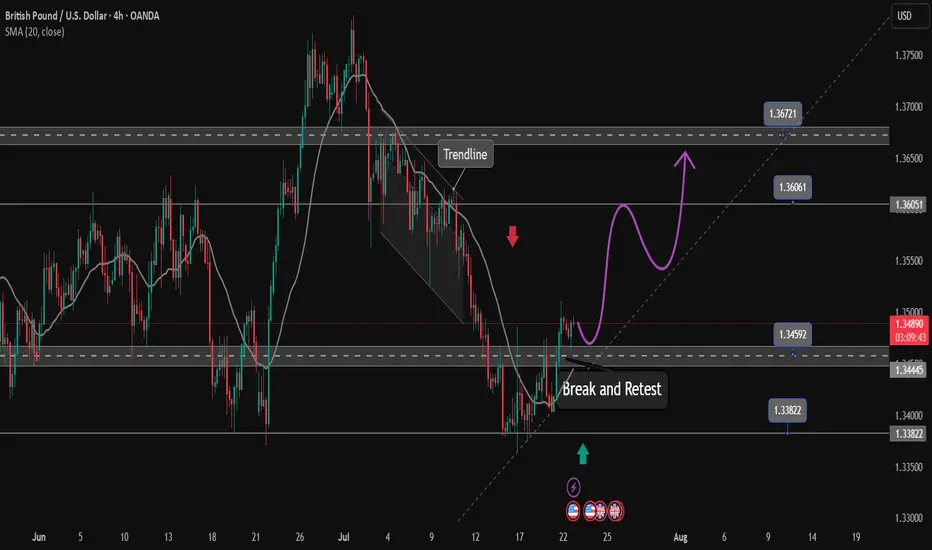
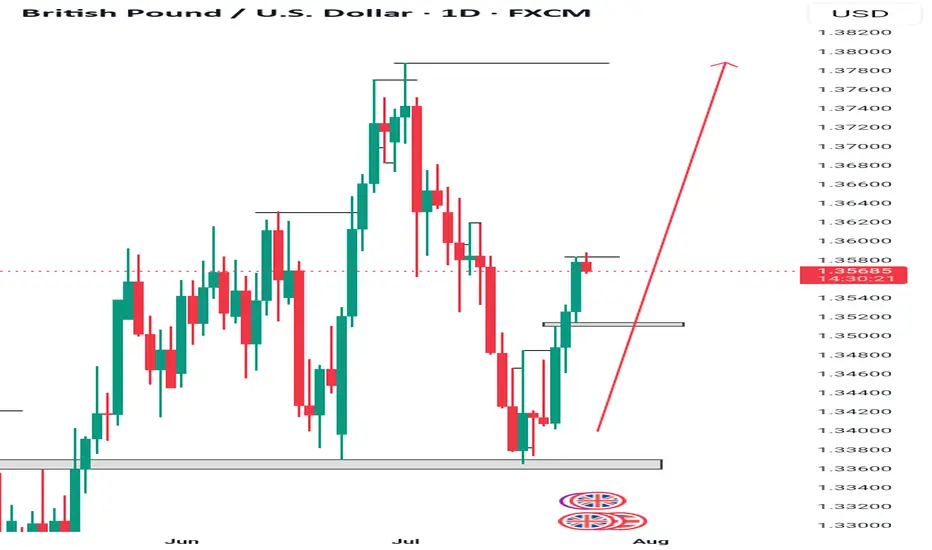
The bearish wave recovery ends and a new bullish wave begins✏️ OANDA:GBPUSD After a long downtrend that touched the important support zone of 1.138 GBPUSD has recovered to the upside. The h4 candle has just closed above the accumulation zone of 1.345 to continue the upward momentum towards the peak of 1.367. The price line also created a trendline supporting the main uptrend of the pair, and the price line can follow the uptrend to the Target.
📉 Key Levels
Support: 1.345 - 1.338
Resistance: 1.360-1.367
Buy Trigger: Rejects above 1.345
Buy zone: 1.348-1.345
Target 1.367
Leave your comments on the idea. I am happy to read your views.