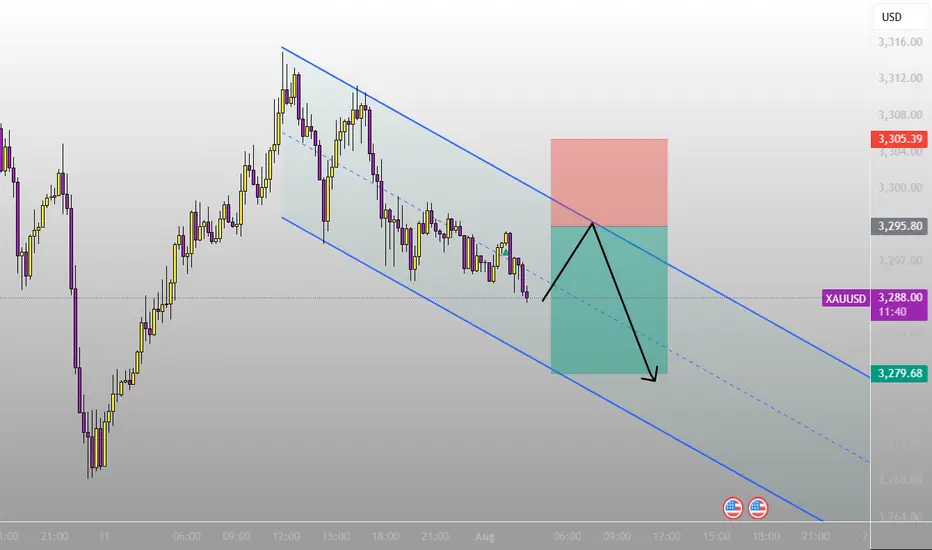
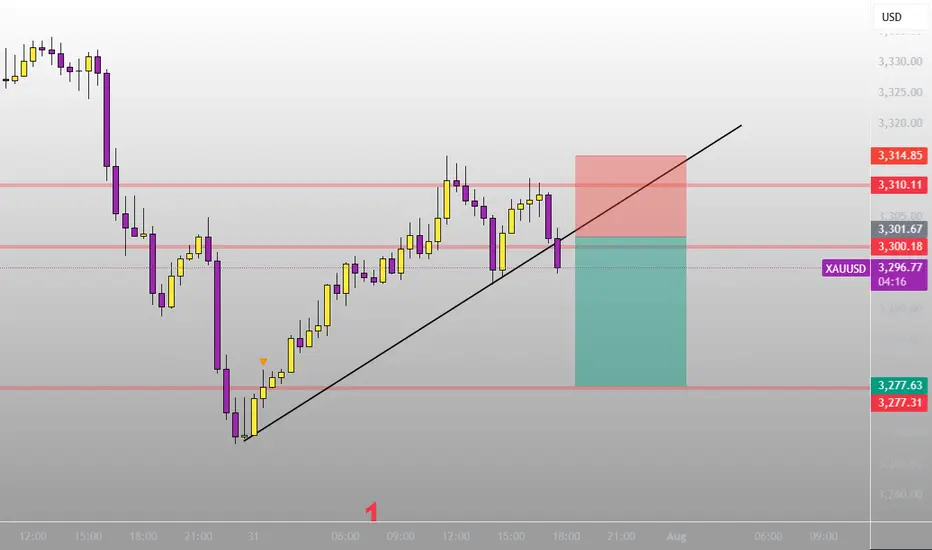
XAUUSD
XAUUSD Updated in 5M :
The gold signal is marked on the chart based on the latest price changes and the supply and demand in the market. These points include the entry point, stop loss, and take profit
Fundamental Analysis
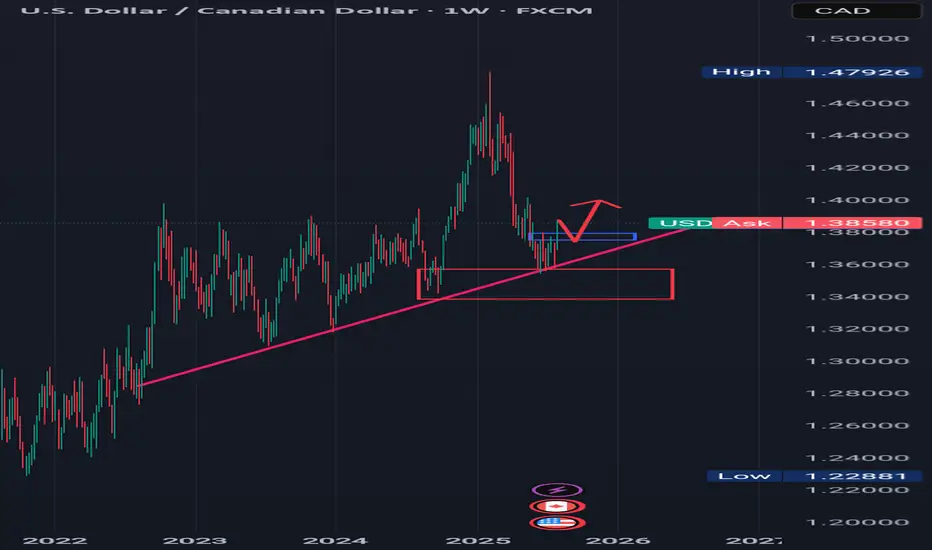
TREND REVERSAL CONFIRMATION Looking at the weekly timeframe for USDCAD, we can see that price action has respected a rising trendline and also reacted to a weekly bullish order block.
The Sell momentum for USDCAD has come to an end, so now we saw price action accumulating around the rising trend line and bullish order block.
Now there's a minor resistance which is indicated with a small blue rectangle in which price action has broken to the upside, I'm expecting price to complete an impulse correction leg or retrace to the blue rectangle or minor resistance and then from there continue to the upside.
........,...,.............................................
Please share your thoughts on this analysis, do you think the downward trend is over.
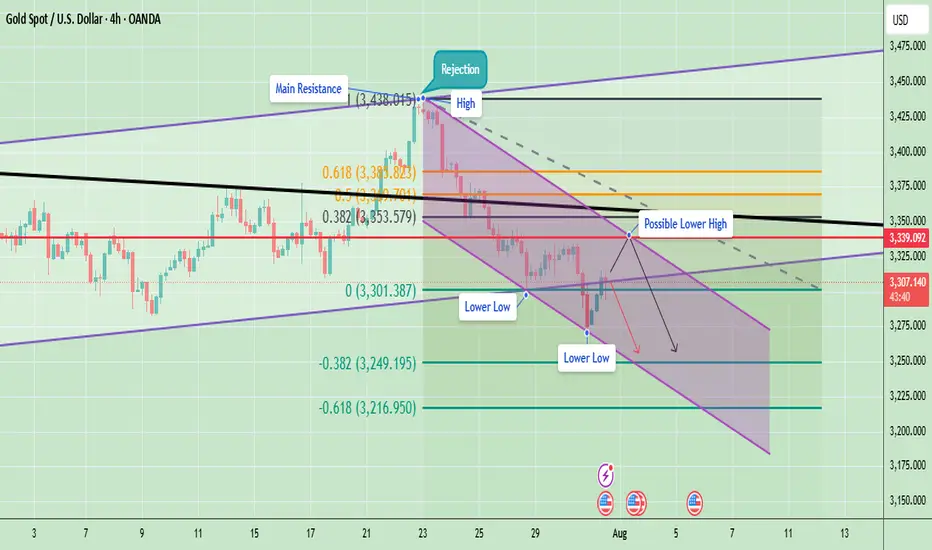
Gold Struggles at Resistance – Indicates Lower Lows AheadGold has been in a clear downtrend after facing a strong rejection around the 3,438 level (main resistance zone). Price is currently moving within a descending channel, confirming the formation of lower highs and lower lows – a classic bearish market structure.
Currently, Gold is trading near 3,306, facing resistance at 3,339 (marked as a possible lower high). If price fails to break above this level and sustain, there is a strong probability of continuation towards 3,249 and even 3,216.
Key Technical Highlights
- Immediate Resistance: 3,339 – 3,353
- Support Levels: 3,301 (short-term), 3,249, and 3,216
A rejection near 3,339 can lead to another leg down targeting 3,249 and 3,216. However, a strong breakout above 3,339–3,353 could temporarily shift momentum towards 3,394.
Note
Please risk management in trading is a Key so use your money accordingly. If you like the idea then please like and boost. Thank you and Good Luck!
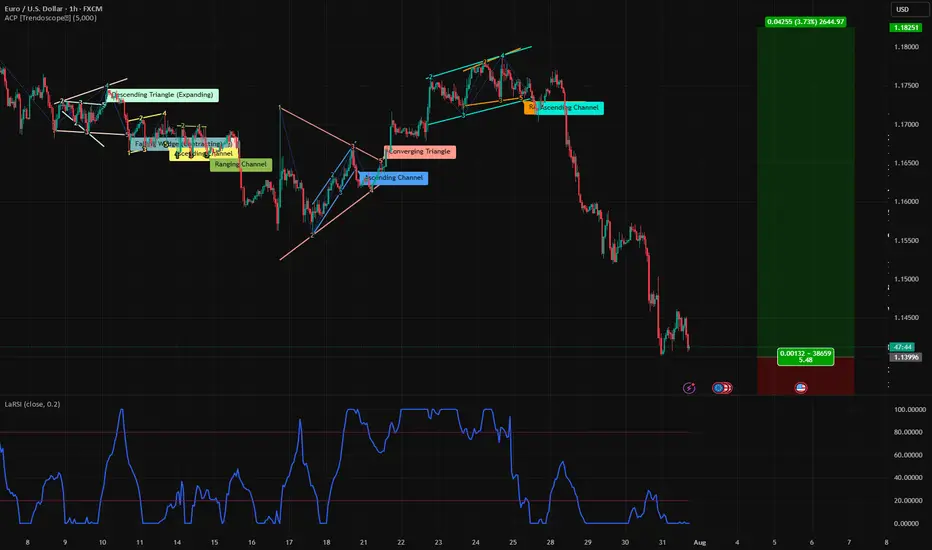
My opinion on the euro to dollarI think the trend is bearish in the medium term, although we may have an upward correction first, so you can wait to enter when shorting.
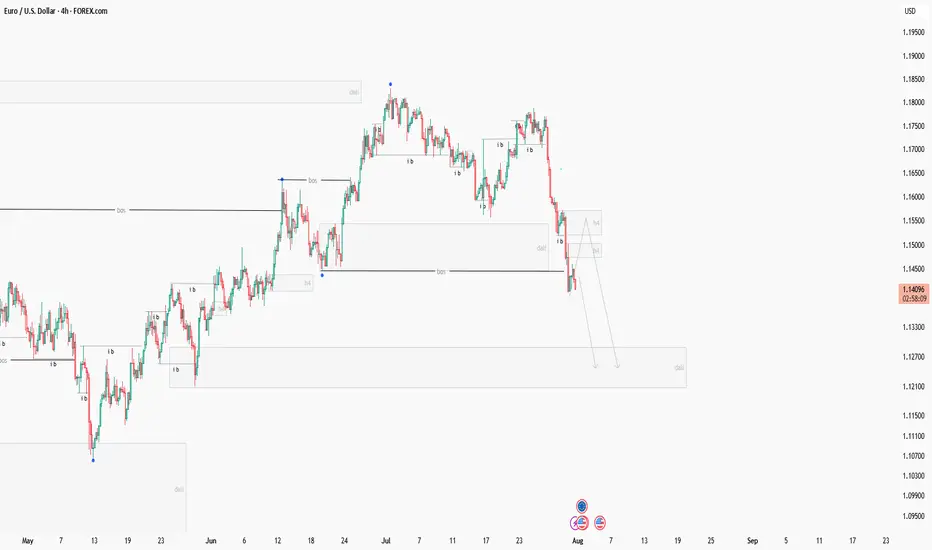
EURUSD targeting 1.10 after breaking key supportEURUSD has finally broken below the key 1.15 level, triggering a move lower in line with earlier expectations. The drop follows the US imposing fresh tariffs on European goods, a move that traditionally strengthens the currency of the tariff-imposing nation.
Supporting the dollar further, the latest ADP and GDP reports came in stronger than forecast, while the Fed remains hawkish despite pressure from President Trump to cut rates. Inflation is expected to rise as tariffs take effect, giving the Fed reason to stay firm.
Technically, EURUSD may still bounce short term but the overall bias is lower. As long as it stays below 1.1653, the bearish case holds. Target zones include 1.10 or even 1.0950, offering a risk-reward ratio close to 3 to 1.
This content is not directed to residents of the EU or UK. Any opinions, news, research, analyses, prices or other information contained on this website is provided as general market commentary and does not constitute investment advice. ThinkMarkets will not accept liability for any loss or damage including, without limitation, to any loss of profit which may arise directly or indirectly from use of or reliance on such information

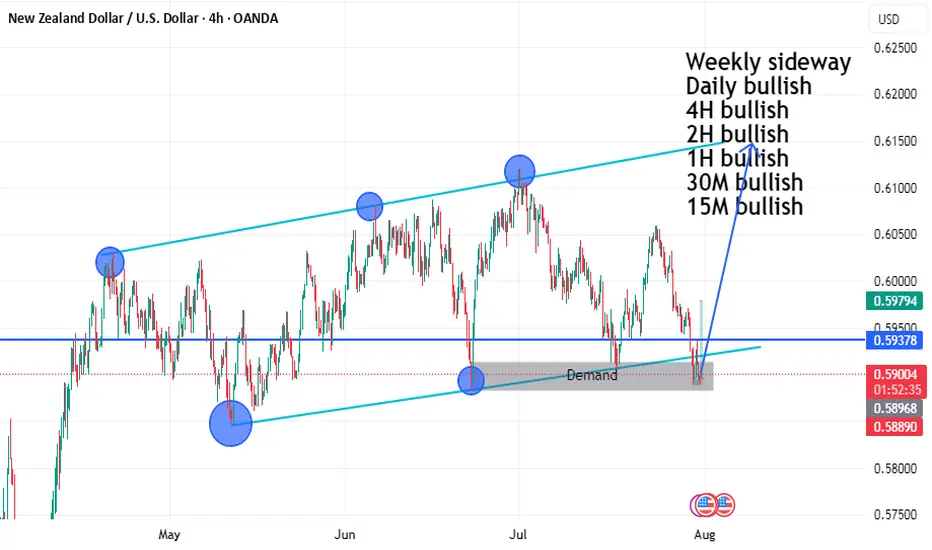
NZDUSD BUY SETUP LOOOOOOOONGHELLO
we have demand and ascending channel 4h
and low time frame the price make engulfing candle on 30m 15m on support zone
and can't make lower low so i will buy it
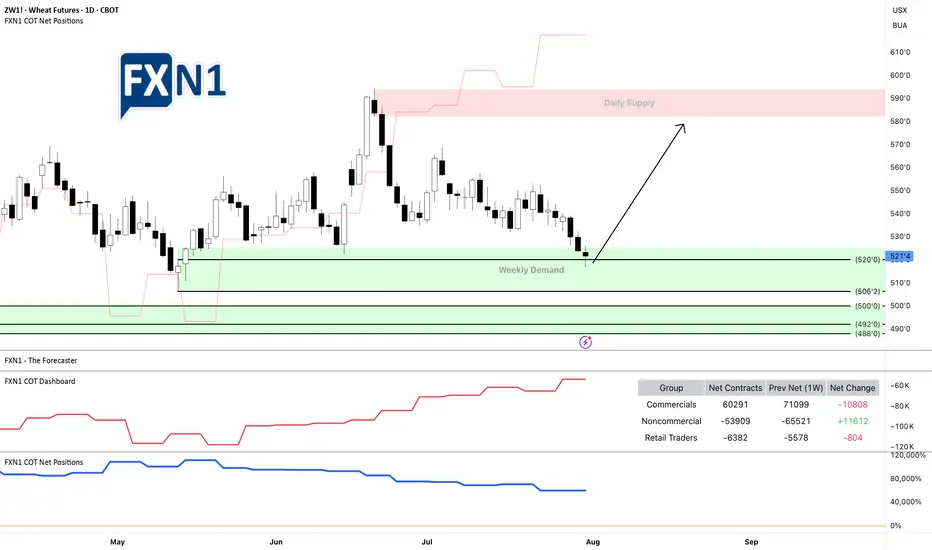
Is Wheat ZW1 Ready for a Long Trade? Key Demand Area InsightsThe futures of Wheat ZW1! are reaching a weekly demand zone, where we observe non-commercials going long and retail traders holding short positions. This could present a potential setup for a long trade. Note: There is another demand area below, but the positions of commercials are less clear compared to non-commercials and retail traders.
Always manage your risk carefully if you agree with my analysis, and be sure to develop your own trading plan.
✅ Please share your thoughts about ZW1! in the comments section below and HIT LIKE if you appreciate my analysis. Don't forget to FOLLOW ME; you will help us a lot with this small contribution.
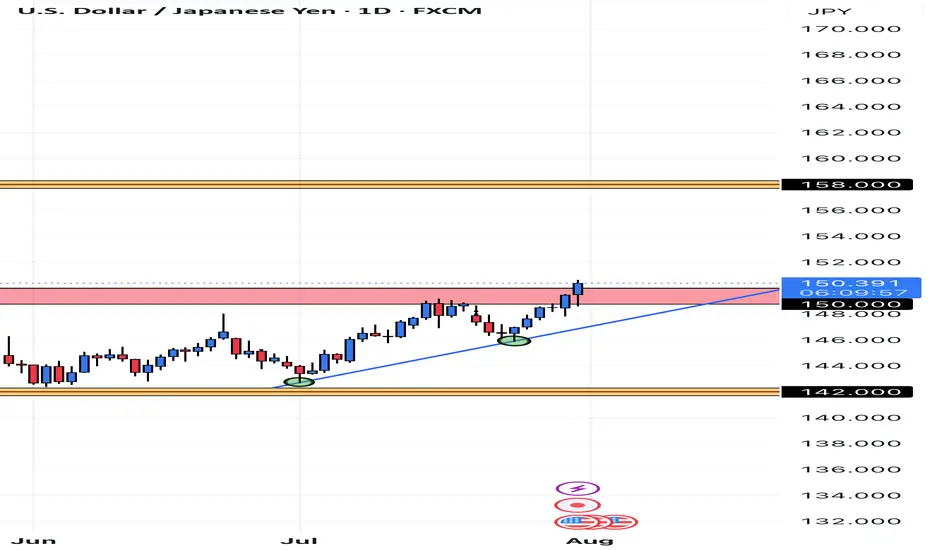
USDJPY HEADING UPThe daily time frame is showing potential bullish movement, seemingly forming structure after daily consolidation. Price bounced off of support and formed a higher low, a third retest of the bullish trend line will further validate this.
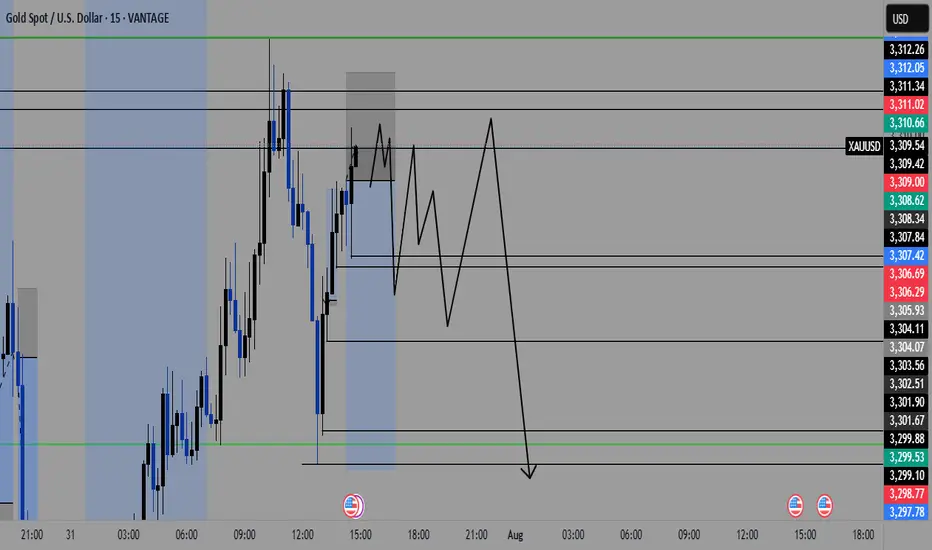
XAUUSD
XAUUSD Updated in 15M :
The gold signal is marked on the chart based on the latest price changes and the supply and demand in the market. These points include the entry point, stop loss, and take profit.
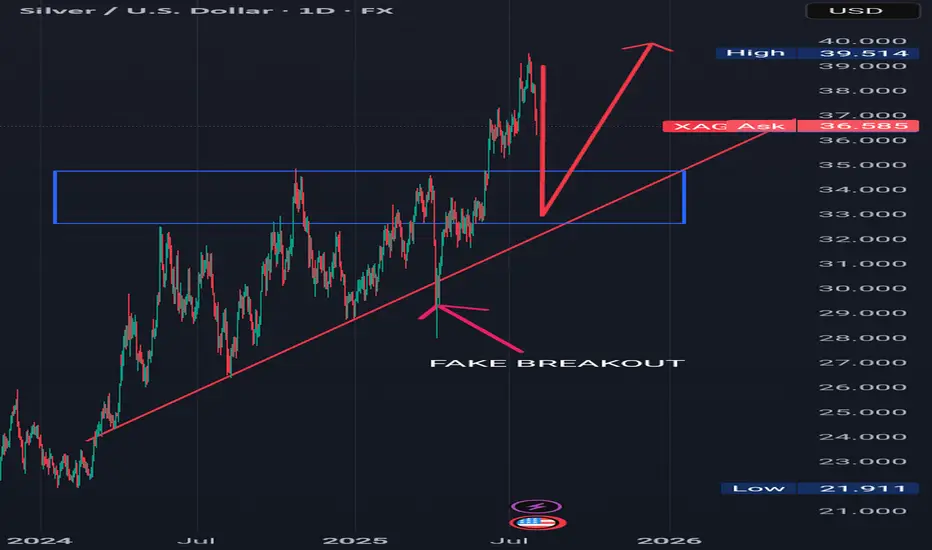
BUY AFTER THE PULLBACK Analyzing the daily time frame of silver, we can see that silver is in a bullish uptrend.
The price of silver is respecting a rising trend line which is acting as support in the past, only for some few times in the past did it exhibit a fake breakout which is indicated with an arrow.
I see the price of silver from its current price actions selling to our required point of interest and looking for buy liquidity to buy at our confluence which is both previous resistance which was broken to the upside which I indicated with a blue rectangle and a rising trend line.
Please look for buys at the previous broken resistance which is indicated with a blue rectangle in confluence with a rising trendline.
.............,...........................................
Please kindly share your thoughts on silver
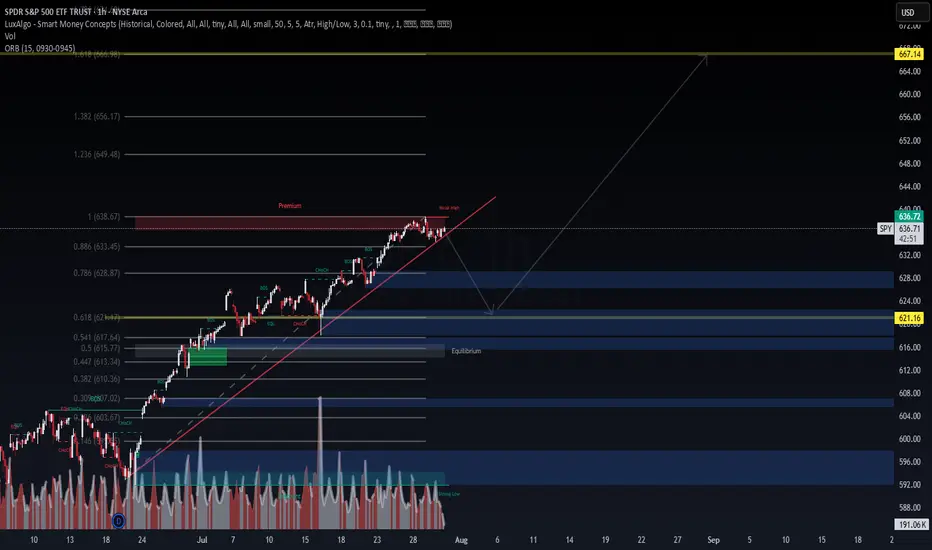
$SPY – FOMC Risk Window: AI Predicts Downside Drift📅 Forecast Window: July 30 – August 30, 2025
📡 Powered by VolanX Protocol v3.0 | WaverVanir DSS
🏛️ MACRO SETUP – JULY 31 FOMC:
🏦 Fed Funds Rate: 5.50% (expected hold)
🧊 Inflation: Cooling but sticky (CPI ~3.2%, PCE ~2.6%)
💼 Labor Market: Slowing but not collapsing
📈 CME FedWatch: 91% odds of no hike, but tone may be hawkish
🧠 Key Risk: Liquidity compression or prolonged pause = risk-off conditions
🧠 VOLANX PROTOCOL FORECAST (30-Day):
🔸 Current Price: $636.29
🔹 AI Target: $627.46 (−1.4%)
🟠 Signal: HOLD
🧮 Direction Accuracy: 85.5%
⚠️ Model Confidence: −2.049 (bearish drift)
📊 Volatility Forecast: Low (~1.36%) = slow bleed conditions
📉 WAVERVANIR DSS SIGNAL:
🔸 Sentiment Score: 78
🔻 15D Forecast: $630.49 (−0.8%)
🔻 30D Forecast: $616.68 (−2.9%)
📉 Bias: Mild Bearish
🛑 Signal: Hedge exposure, reduce risk, do not chase longs
🔥 OPTIONS FLOW SNAPSHOT:
🚨 $1.53M Call Sweep (645C, Aug 8) = Speculative breakout bet
📉 Multiple Put Sweeps (633–634P, Aug 4) = Institutional hedging
🟢 Mid-dated 638C/645C flows (Aug 15–22) show straddle-the-news positioning
📐 TECHNICAL ZONES TO WATCH:
📉 Support Levels:
$627 = Fib + VolanX AI Target
$616 = DSS Forecast + liquidity pivot
📈 Resistance Levels:
$639 → Gap close
$645 → Major breakout trigger (options magnet)
🕯️ Structure: Distribution bias → No clear momentum unless Fed surprises dovish
🎯 STRATEGIC OUTLOOK:
Scenario Probability SPY Reaction
🟡 Hawkish Hold 65% Pullback toward $627
⚪ Neutral Hold 25% Choppy → $639 max
🟢 Dovish Surprise 10% Spike to $645+
📌 VolanX Protocol Guidance:
"This is a defense window. AI models and options flow both suggest uncertainty, not conviction. Trim longs, hedge risk, and wait for post-FOMC confirmation."
#SPY #VolanX #WaverVanir #FOMC #MacroForecast #OptionsFlow #DSS #SMC #LiquidityTraps #SmartMoney #TradingSignals #AITrading #FederalReserve #TechEarnings #RiskWindow #HawkishFed #FedHold #MacroAI
Trade Bias: I’m looking to buy EURUSD, but only on confirmationFading Fear, Not Chasing Highs 💡💶
This isn’t about momentum. It’s about patience. EURUSD has been under pressure, but I’m not selling panic — I’m watching for a buy signal to fade the current selloff. With dollar fundamentals shifting, this pullback could be setting up opportunity — not continuation.
📈 Trade Bias: I’m looking to buy EURUSD, but only on confirmation the sell pressure is cooling.
Here’s the fundamental picture:
✅ US growth is slowing; Q1 GDP contracted slightly
📉 Dollar bears are at a 4-year high, signaling sentiment exhaustion
🔁 ECB paused cuts, holding steady at 2.15% — EUR fundamentals are stabilizing
💬 US tariffs could push inflation up, but squeeze household demand
⚠️ I’m not expecting new highs — just a relief move once the selling slows
The dollar is caught in a tug-of-war: economic data remains decent, but traders don’t buy it. Sentiment is skewed — hedge funds are heavily short USD, not because the economy is collapsing, but due to fiscal worries, policy confusion, and long-term structural cracks. This creates space for countertrend moves.
The euro isn’t roaring either — but it's no longer cutting rates, and confidence is picking up. A recent uptrend has cooled, and the pair is now consolidating. If we see signs of selling exhaustion, I’ll be watching for an entry.
I’m not buying blindly. I’m waiting for the fear to burn out. Would you fade this dip too — or are you staying out? 👇
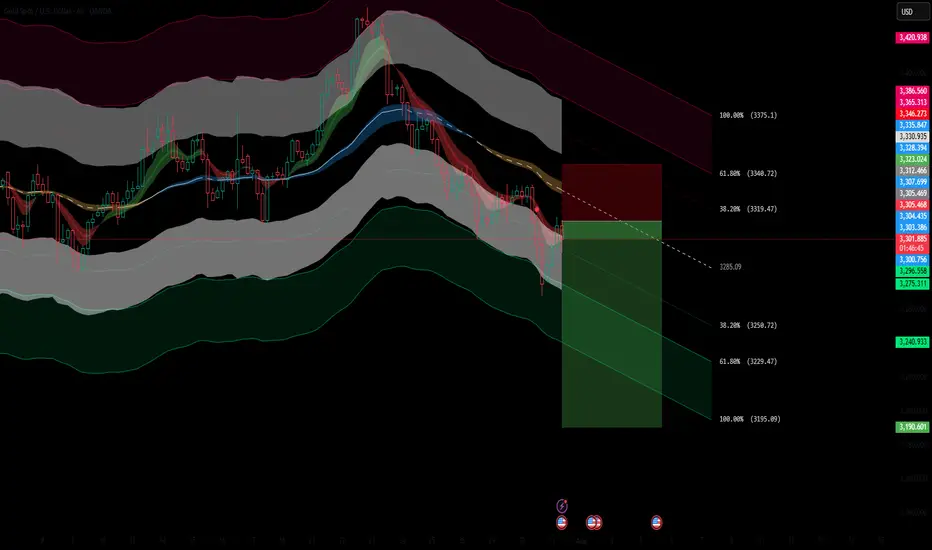
XAUUSD 4H AnalysisGold is currently in a clear downtrend after failing to hold above the mid-channel. Price is retracing into a potential short zone with confluence from the moving average bands.
Fibonacci Retracement: Price is reacting near the 38.2% level (3,318).
Downside Fibonacci Targets:
1️⃣ 3,249.36 (38.2%)
2️⃣ 3,228.11 (61.8%)
3️⃣ 3,193.73 (100%)
As long as the price stays below the red resistance zone, the bearish momentum is likely to continue toward the lower Fibonacci targets. A break above 3,339 would invalidate the short setup.
$TOTAKEKE – Dark Cheems Building Momentum? Meme Bull Run SetupOverview
Totakeke (aka Dark Cheems) is positioning itself as the “brother coin” to the well-known meme Cheems on BSC. It’s been quietly gaining attention. It has been tweeted by PancakeSwap, Trust Wallet, Four Meme, and even interactions from CZ on X! HOLY SHIII! With meme coins leading this market cycle, Totakeke’s early-stage market cap of $6.2M puts it in prime territory for explosive moves if narrative momentum holds.
Initial discovery pump around July 25–26 → price surged to 0.025 before sharp retrace.
Current -75% pullback into accumulation zone (0.0058–0.007) matches classic meme cycle setups (PEPE, BONK patterns).
Liquidity at $408K = thin books; big buys/sells swing price 20%+ easily.
Key Levels
Accumulation Zone: 0.0058–0.007
Breakout Trigger: 0.009–0.01 (close above signals next wave)
Previous ATH: 0.025 (first upside target)
Meme Extension Target: 0.04–0.05 (6–8x potential if bull run continues)
Narrative Catalyst
Strong ties to BSC meme culture (Cheems brother narrative).
Engagement by top ecosystem accounts (PancakeSwap, Trust Wallet, CZ).
Community buzz forming → potential for “viral rotation” if meme bull run expands.
Play Idea (Meme Bull Logic)
Accumulate quietly in base range; position size small due to volatility.
No tight stop-loss: meme coins wick hard; manage risk via exposure, not micro stops. aka nut up or shut up
Upside targets: 0.01 / 0.025 / 0.04 (scale out as narrative develops).
Lose 0.0058? Next support ~0.0045 (still viable base in meme context).
Totakeke fits the early-stage meme cycle template.. strong narrative tie-ins, early ecosystem attention, and chart structure that mirrors successful meme plays pre-run. If meme momentum continues across BSC, this could be one to watch for multi-x potential.
Not financial advice. Meme coins are extremely volatile... play size and timing matter more than tight TA.

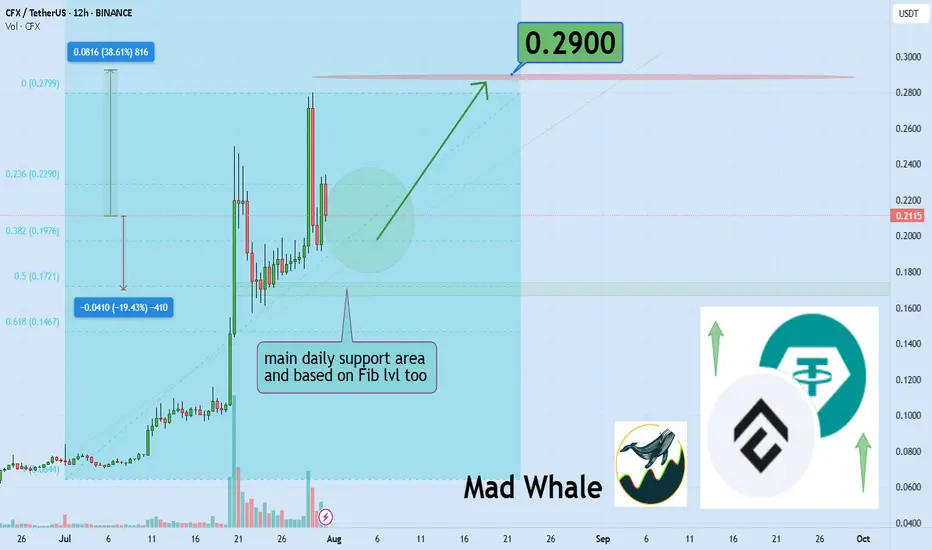
CFX Bulls Eyeing 38% Surge Toward Explosive 0.29 TargetHello✌
Let’s analyze Conflux’s upcoming price potential 📈.
BINANCE:CFXUSDT has shown solid bullish momentum recently, supported by a series of positive fundamental catalysts 📈. Price is now approaching a daily support zone that also aligns with a key Fibonacci retracement level. If this level holds, I’m expecting a potential move of around 38% to the upside, with a mid-term target near 0.29 . Watching closely for price action confirmation around support before considering entry 🚀.
✨We put love into every post!
Your support inspires us 💛 Drop a comment we’d love to hear from you! Thanks , Mad Whale
Bitcoin Intraday Analysis 31-Jul-25Quick analysis on bitcoin, the main area of interest i will be monitoring are 110,500, 115k, 120K. Keeping in mind that we still have important economic data tomorrow (US Employment Data).
Disclaimer: easyMarkets Account on TradingView allows you to combine easyMarkets industry leading conditions, regulated trading and tight fixed spreads with TradingView's powerful social network for traders, advanced charting and analytics. Access no slippage on limit orders, tight fixed spreads, negative balance protection, no hidden fees or commission, and seamless integration.
Any opinions, news, research, analyses, prices, other information, or links to third-party sites contained on this website are provided on an "as-is" basis, are intended only to be informative, is not an advice nor a recommendation, nor research, or a record of our trading prices, or an offer of, or solicitation for a transaction in any financial instrument and thus should not be treated as such. The information provided does not involve any specific investment objectives, financial situation and needs of any specific person who may receive it. Please be aware, that past performance is not a reliable indicator of future performance and/or results. Past Performance or Forward-looking scenarios based upon the reasonable beliefs of the third-party provider are not a guarantee of future performance. Actual results may differ materially from those anticipated in forward-looking or past performance statements. easyMarkets makes no representation or warranty and assumes no liability as to the accuracy or completeness of the information provided, nor any loss arising from any investment based on a recommendation, forecast or any information supplied by any third-party.

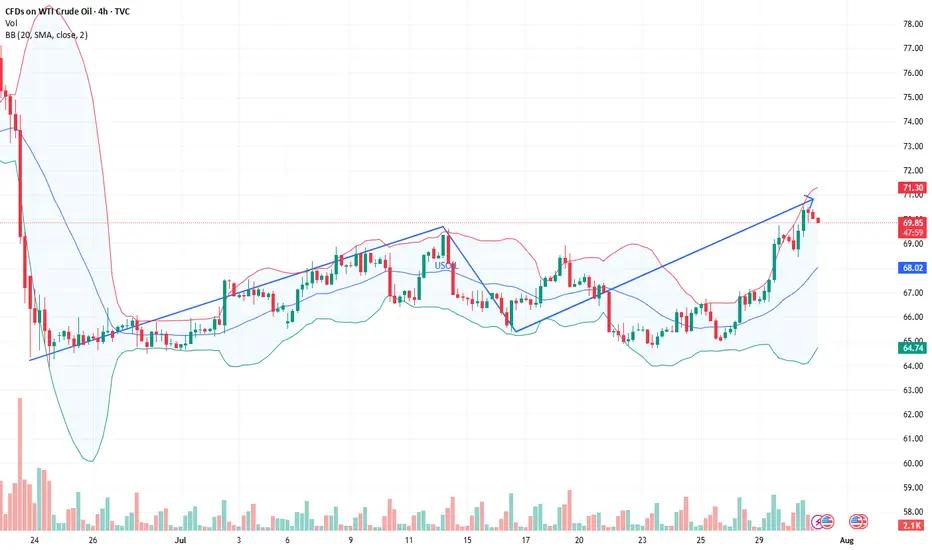
Is the surge in crude oil bulls here a comeback?The news-driven support for crude oil's recent rally is almost exhausted, so we'll continue to adopt a buy-low-sell-high strategy today, using a small stop-loss to maximize profits.
Short at $71.20, with a stop-loss at $71.70 and a take-profit at $69.20. (For aggressive shorting, try shorting at $70.95).
The above strategy is Charlie's personal opinion and is for reference only. If you follow suit, please be cautious and use a stop-loss to protect your position. TVC:USOIL FOREXCOM:USOIL TRADU:USOIL TRADU:USOIL
GBPUSD BEARISH POTENTIAL The daily time frame for GBPUSD is showing me that price has formed a head & shoulders pattern, breaking through the former support now resistance level. Price is currently sinking to my 1.31000 mid level, once the level is reached it will either breakthrough or bounce off of it to retrace and continue to build bearish structure.

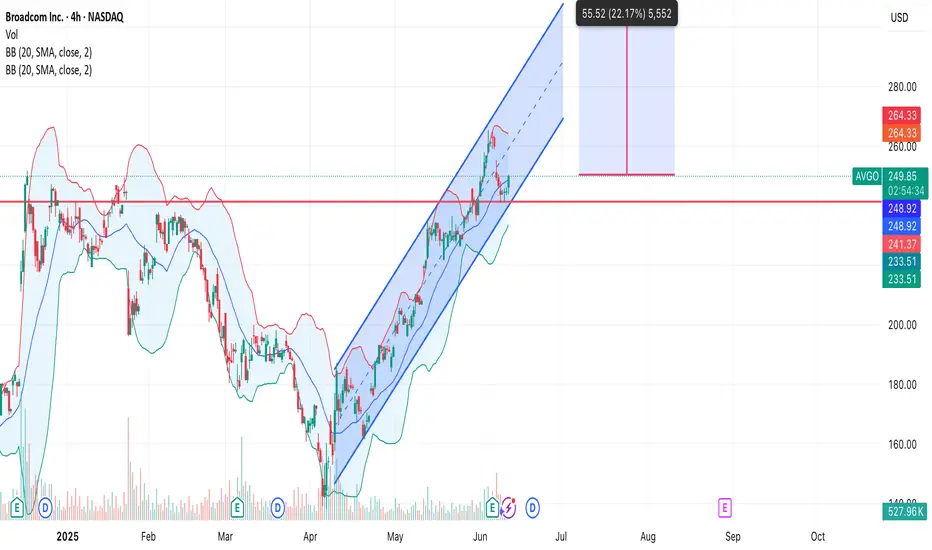
AVGO ( Broadcom.Inc ) NASDAQ:AVGO - Continuation of movement within the ascending channel + potential for a breakout to new historical highs. 🔍 Rationale:
• After a strong correction in the first quarter of 2025, the price formed a reversal and has been moving in a clear ascending channel since the beginning of May.
• The channel support and resistance are clearly being worked out, the price is steadily bouncing off the lower border.
• Bollinger Bands show a narrowing - momentum is possible.
• Trading volume is stable, there are no signs of a strong sell-off.
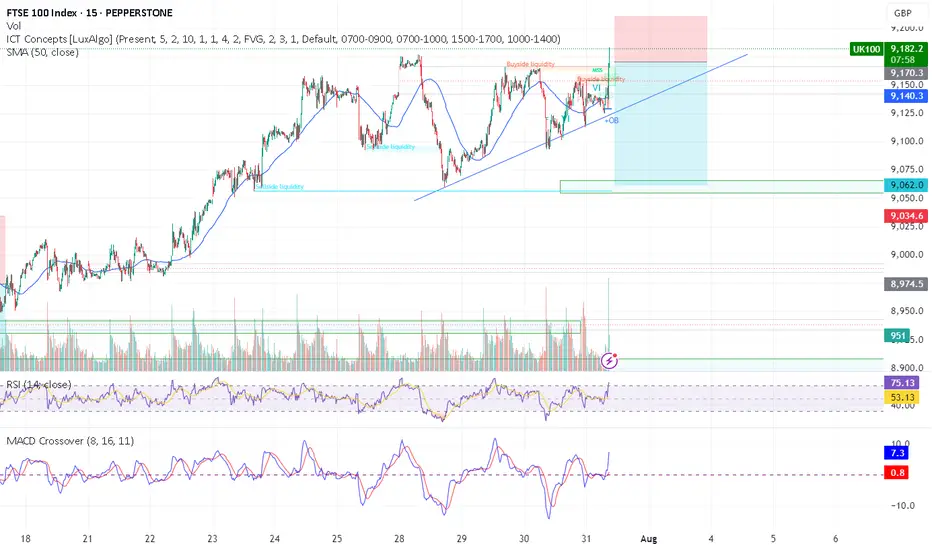
UK100 - TIME TO DESTRUCTION UK TO HELLTeam, UK100 market is tank,
the economy is SH*T, not in a great shape
unemployment rising, crime increasing, jobless
inflation is out of control, but the market has not recognised the effect.
TIME TO PUT AN END TO THIS ERA - short range at 9175-9186
STOP LOSS AT 9225
EASY target 1 at 9152-42 - take 50% profit and bring stop loss to BE
Target 2 at 9128-9112
GOOD LUCK
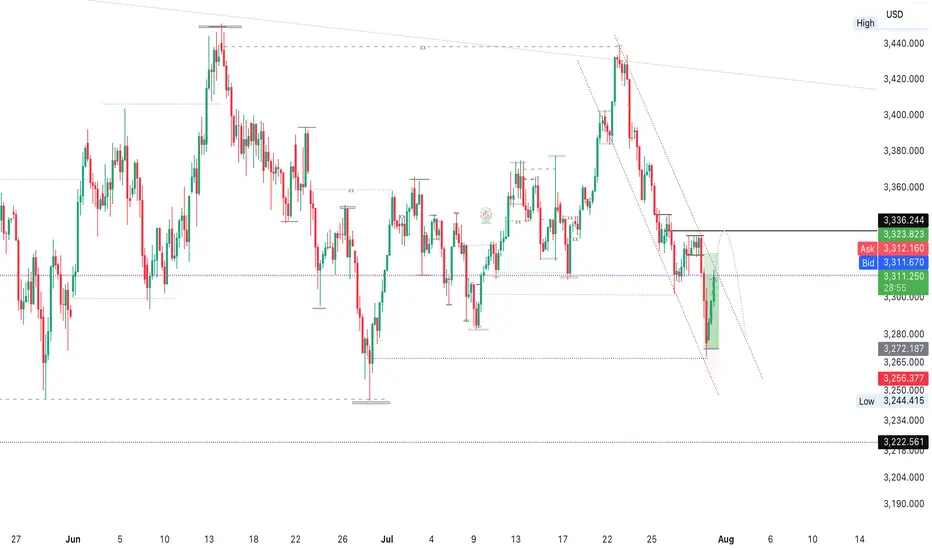
Gold Market Eyes Daily Demand Zones at 3270–3315Gold market aligns with daily candle formation, seeking to mitigate substantial demand zones between 3270 and 3315. This area may provide the necessary liquidity for a potential bullish reaction, pending confirmation. follow for more insights , comment and boost idea
Gold fluctuates. Is the decline halted?Information Summary:
Despite diminished market expectations for a September US rate cut, gold rebounded from a one-month low hit the previous session on Thursday, boosting its safe-haven appeal as newly announced US tariffs sparked new trade uncertainty.
So far, gold has risen 1.15%, hovering around $3,310, a gain of nearly $40 today. On Wednesday, gold prices hit their lowest point since June 30th: $3,267.79.
Market Analysis:
On the 4-hour chart, prices remain below the middle Bollinger Band, with a descending trendline defining the current bearish momentum. Prices rebounded after hitting this month's low on Wednesday. In the short term, watch for price rejection signals near the trendline. Upward pressure currently lies between $3,315 and $3,325, while support lies between $3,280 and $3,270.
Currently, prices are fluctuating upward. Quaid believes the bullish trend may continue. If the current resistance level is broken, it could reach the 3335 high before Wednesday's decline.
Trading strategy:
Go long near 3300, stop loss at 3290, profit range 3320-3330.

Gold is faking a bullish trapWe are gonna go down to the 3294 level before we see a bounce up. The 3294 level is gonna show up as a strong support to push trough the 3345 area.