KIMLUN - DMI and RSI shows BULLISH SIGNAL KIMLUN - CURRENT PRICE : RM1.31
KIMLUN is in an uptrend for medium term as the price is making higher high and higher low. Supported by positive readings in technical oscillators such as DMI (+DI is above -DI) and RSI (above 50), it increases the bullish scenario. At current price trading near SMA 20, there is possibility for price reach upper band in bollinger bands indicator. Nearest support will be RM1.24 (-5.34%) and 1st target will be RM1.41 (+7.63%).
ENTRY PRICE : RM1.30 - RM1.31
TARGET : RM1.41 and RM1.47
SUPPORT : RM1.24
Notes : On the fundamental side, KIMLUN shows a strong recovery in earnings. For FY2022, company was loss RM7.2 million. Then the company rebounded with a profit of RM7.1 million in FY2023. For FY2024, company registered strong performance of profit RM50.3 million.
Fundamental Analysis

$UNH BEARISH SETUP – WEEK OF AUG 1
🔻 **\ NYSE:UNH BEARISH SETUP – WEEK OF AUG 1** 🔻
**UnitedHealth Group (UNH)** is showing classic breakdown signs. Here’s what the data says:
📉 **RSI Breakdown**
• Daily RSI: **20.6**
• Weekly RSI: **19.3**
→ Deeply oversold + no bounce = 🚨 momentum flush risk
📊 **Volume Surge**
• Weekly Volume: **145M** (1.9x avg)
→ Heavy **institutional selling**, NOT dip buying
🧠 **Options Insight**
• Call/Put Ratio: **1.17** = Slight bullish noise
• But... Expiry Gamma is 🚨HIGH = IV Crush incoming
• VIX: **20.7** = Volatility tailwinds intact
💣 **TRADE IDEA (PUT PLAY)**
• Direction: **BUY PUTS**
• Strike: **\$230**
• Expiry: **08/08/2025**
• Entry: **Monday Open**
• Target Premium: **\$0.10**
• 🎯 PT: \$0.30 | 🛑 SL: \$0.03
• Confidence: **70%**
📌 **Narrative**:
Oversold + High Volume Dump + No support bounce = Perfect storm for continuation dump. This is a high gamma play, time-sensitive, low-cost lotto setup. Risk small. Aim big.
---
💥 **Watchlist Tag**: ` NYSE:UNH AMEX:SPY AMEX:XLV `
🧠 **Strategy Tag**: #OversoldFlush #PutPlay #0DTETrap
🚀 Follow for more weekly earnings & options breakdowns!

08/1/25 Trade Journal, and ES_F Stock Market analysis EOD accountability report: +440
Sleep: 6 hours
Overall health: Good
VX Algo System Signals from (9:30am to 2pm)
— 9:30 AM Market Structure flipped bearish on VX Algo X3!
— 10:12 AM VXAlgo ES X1 Buy signal
— 10:20 AM VXAlgo NQ X1 Buy Signal
—12:30 PM Market Structure flipped bullish on VX Algo X3!
— 1:00 PM Market Structure flipped bearish on VX Algo X3!
— 1:50 PM VXAlgo ES X1 Buy signal,
— 3:00 PM Market Structure flipped bullish on VX Algo X3!**
What’s are some news or takeaway from today? and What major news or event impacted the market today?
Market range expanded a lot today, we dropped over 100 points today and sometimes i forget to adjust my bracket orders to go for 10 -15 points take profits when the volatility is so high. But overall, it was a good day, I knew to be patient as market was wild and sometimes you want to just snipe a few trades and call it a day before you get caught on the wrong side.
The great thing about big moves is that it will eventually hit a major level and it will react really well, you just have to wait for it.
a great question is will the market recover? Or is going back down to April prices?
News
*STOCKS TUMBLE TO END THE WEEK, VIX SPIKES AS SOFT JOBS DATA STOKE ECONOMIC JITTERS
What are the critical support levels to watch?
--> Above 6330= Bullish, Under 6310= Bearish

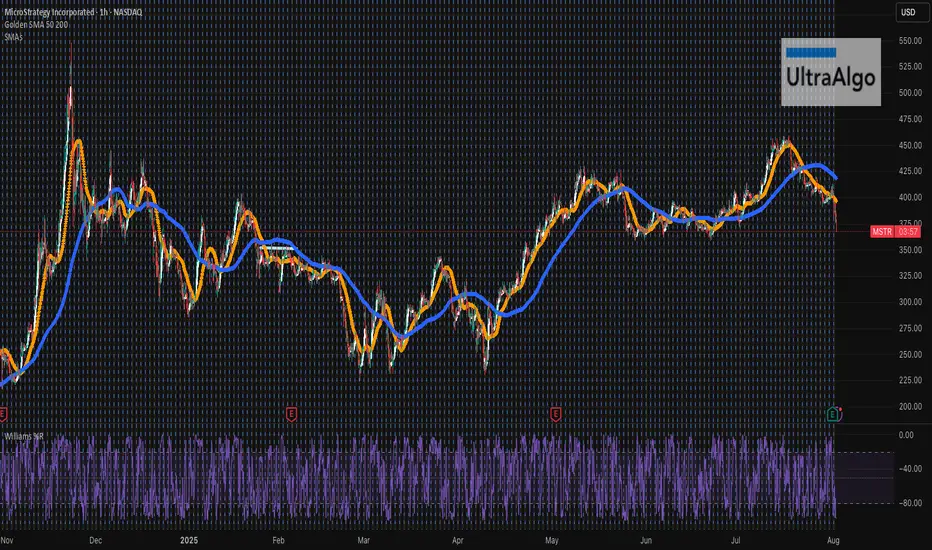
MSTR....Free FallingMSTR looks like it is nosediving straight down. When one is bullish on BTC, it is important to also understand that volatility is a big part of the game - a very costly game with many losers! BTC has past several key TAs and we only just started - crossing $300 is in the horizon. Always do your own due diligence, and received ultrabear signal earlier to exit, and cut your losses soon.
CVX Earnings Trade Setup — August 1, 2025
## 🚨 CVX Earnings Trade Setup — August 1, 2025 🚨
🔍 **Chevron (CVX) Earnings Analysis | High Conviction Call Play**
### 🧠 Model Consensus (Multi-LLM Blend)
* 📉 **Revenue Trend:** -1.0% TTM growth, margin pressure from falling oil
* 📈 **Analyst EPS Expectation:** \$11.04 with 26.2% YoY growth est.
* ⚠️ **Miss Rate:** 50% EPS beats w/ average surprise -2.2%
* 💬 **Consensus Sentiment:** ⚖️ *Moderate Bullish (Confidence: 60%)*
---
### 🔥 Options Heatmap
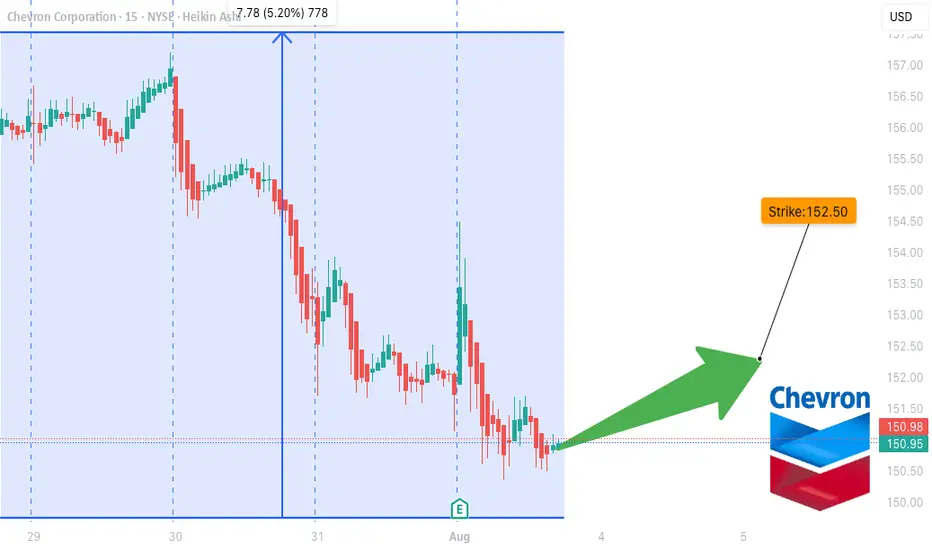
* 🟢 **Most Active Call:** \$152.50 strike, 🔥 ask volume at 152
* 🔺 **IV Rank:** 63% → *Moderate move expected*
* 🧊 **Put/Call Skew:** Defensive bias with light bullish divergence
* 🕵️♂️ **Dark Pool:** Mild accumulation hints by institutions
---
### 📉 Technical Breakdown
* 🔹 Near 50/200 MA — Neutral Pre-Earnings Drift
* 🔸 Support: \$150 | Resistance: \$155
* 🔻 Volume: 0.53x avg → *Weak conviction*
---
## 🎯 TRADE SETUP
🛠️ **Strategy:** Long Call (Pre-Earnings Entry)
💰 **Strike:** \$152.50
📅 **Expiry:** 2025-08-01
💸 **Entry Price:** \$3.70
🧠 **Profit Target:** \$11.10+ (200–300%)
🛑 **Stop Loss:** \$1.85
📊 **Risk/Reward:** \~2.5:1
🕓 **Exit Timing:** 1–2 hrs post-earnings (to avoid IV crush)
---
### 🧪 Earnings Catalyst Trade
Chevron’s setup shows a **classic low-volume/high-upside IV play**. Risk tightly managed with a defined stop, but room for explosive move if earnings surprise to upside.
---
📦 **Trade JSON Snapshot:**
```json
{
"instrument": "CVX",
"direction": "call",
"strike": 152.50,
"expiry": "2025-08-01",
"confidence": 60,
"profit_target": 11.10,
"stop_loss": 1.85,
"size": 1,
"entry_price": 3.70,
"entry_timing": "pre_earnings_close",
"earnings_date": "2025-08-01",
"earnings_time": "AMC",
"expected_move": 5.0,
"iv_rank": 0.63,
"signal_publish_time": "2025-08-01 13:05:25 UTC-04:00"
}
```
---
📈 **#OptionsFlow #CVX #EarningsPlay #TradingViewSetups #LongCall #EnergySector #IVCrushProtection #PreEarningsTrade**
APLD 0DTE TRADE IDEA (AUG 1, 2025)
## 🔥 APLD 0DTE TRADE IDEA (AUG 1, 2025)
**💡 Multi-AI Model Consensus | High Risk-Reward | Gamma Alert**
### 🧠 AI Model Summary
✔️ **Bullish Momentum** confirmed across all models
📉 **Volume Weakness** = key caution signal
⚠️ **Gamma Risk HIGH** → Most recommend entry *next session* (Monday)
---
### 🛠 TRADE SETUP (Based on Consensus Call)
| Field | Value |
| -------------- | ------------------------------ |
| 📈 Direction | **CALL (Bullish)** |
| 🎯 Strike | **\$13.50** |
| ⏰ Expiry | **Aug 1 (0DTE)** |
| 💰 Entry Price | **\$0.23** (ask) |
| 🎯 Target | **\$0.35** |
| 🛑 Stop Loss | **\$0.12** |
| 🔁 Size | 1 Contract |
| 📊 Confidence | **75%** |
| 🕒 Entry Time | **Next session OPEN (Monday)** |
---
### 🔍 Key Model Insights
* 📊 **Call/Put Ratio Bullish** across all platforms
* 📉 **Weak Volume** warns of unsustainable moves
* 🧨 **High Gamma Sensitivity** → rapid profit/loss shifts
* 🧠 **Claude / Grok / DeepSeek** all flag for rapid exit if entered today
---
### 📌 TradingView Viral Caption
> ⚠️ \ NASDAQ:APLD 0DTE 🔥
> Models agree: 🚀 bullish trend, 💀 dangerous gamma
> ✅ \$13.50 CALL @ \$0.23 → Target: \$0.35
> ⏱️ Most say: **WAIT ‘til Monday open**
> 🔍 Risk tight. Exit fast. Volume light.
> \#APLD #OptionsTrading #0DTE #FlowTrading #AIModels #GammaSqueeze #FridayTrades #TradingViewIdeas

AUDCHF: Broken Support, Bearish Flow In Play Timeframe: 1H
Bias: Bearish
Type: Support Turncoat → Breakdown Play
📊 Technical Setup
AUDCHF previously broke the 4H resistance (0.5236) which flipped to support. However, price has now broken below this support, confirming it as a failed demand zone.
• Entry: Market execution or retest of 0.5236
• SL: Above 0.5245
• TP: 0.5189
• RR: ~1:2
• RSI: Below 50 and heading lower = momentum supports downside
📉 Macro & Fundamental Confluence
• AUD Weakness: RBA dovish, conditional score declining, bearish seasonality
• CHF Slightly Less Weak: Despite SNB dovish stance, CHF is outperforming AUD
• COT + Sentiment: AUD CFTC weakening, CHF holding steady
• Risk Sentiment: RISK ON environment reduces CHF demand but AUD still underperforms
🧭 Gameplan
“Support failed to hold. Bearish pressure intensifies. Target previous swing low zone.”
🔔 Watch for retest of 0.5236 for better RR setup before continuing short.

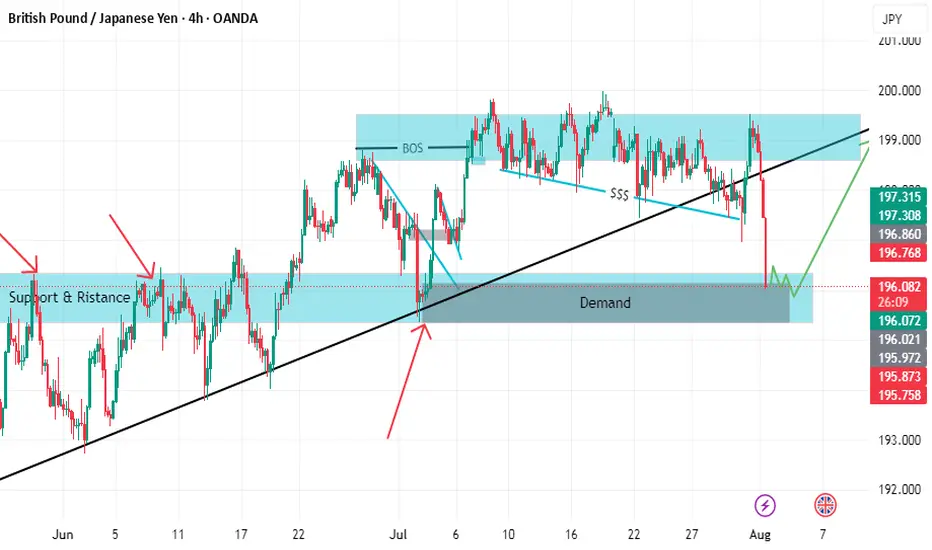
GBPJPY BUY SETUP LOOOOOOOOOOOOONGWELCOME TO YOU
we have support which is strong with retest
and we have demand and before it imbalance if you focus on photo
and the price make bos and take liquidity so i will buy with you .but prefer to be there conformation for buying
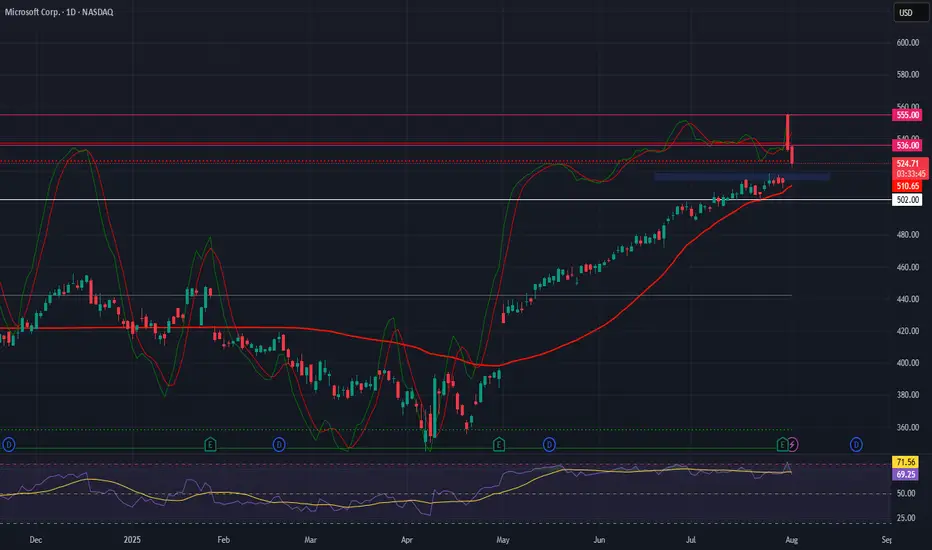
Microsoft (MSFT)–Watching for Pullback Entry After $4T MilestoneMicrosoft Corp. NASDAQ:MSFT has become the second company after Nvidia to cross the $4 trillion market cap, powered by strong AI and cloud demand.
Azure revenue grew 34% to $75B in 2024, with a $30B AI infrastructure investment fueling future growth. Q4 EPS came in at $3.65 on $76.4B revenue, showing strong fundamentals.
We are looking for a pullback to key support for a long entry:
Trade Plan:
Entry Zone: $515 – $518
Take Profit: $536, $555
Stop Loss: $502
#Microsoft #MSFT #Stocks #Trading #StockMarket #TechnicalAnalysis #AI #Cloud #BigTech #NASDAQ
Quantum's Missed IWM Short 8/1/25Well had a moment where I backed out of a A+++ setup. IWM had a ton of -gex pull down to 206. Would have been a massive short to end the week. I canceled my order instantly for no reason at all and missed it. Overall had a great day but this is what separates the elite from the average trader. Will work on this next week.

Quantum's TSLA & NVDA Trades 8/1/25Simply breaking down what I look at going into the trading day. Premarket watchlist was short but nailed TSLA short for 150% and could have made double that on TSLA and NVDA longs. Due to hitting my daily goals I had to walk away to avoid overtrading but what an amazing day.

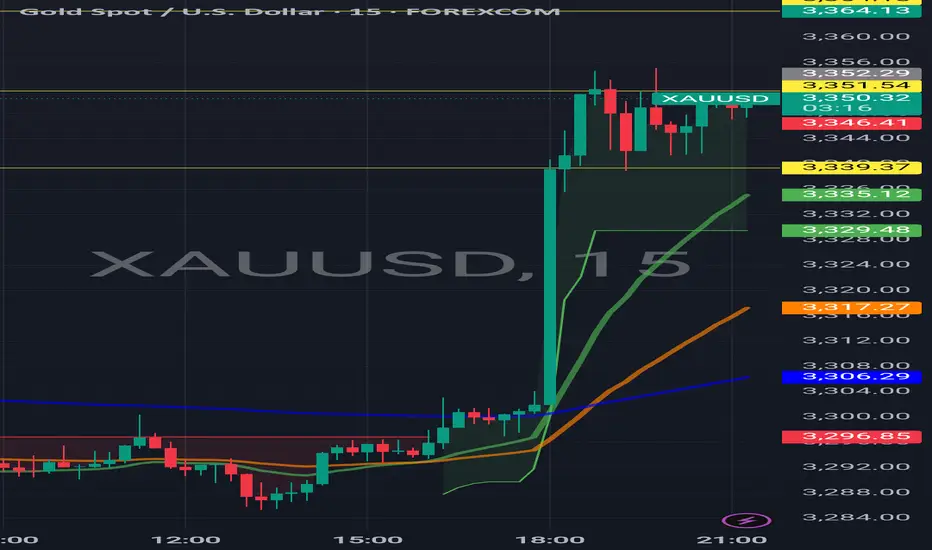
WEAK NFP EFFECTS FOR USA AND DOLLAR#NFP not as expected weakens dollar and shows weaker USA economy growth
Other Currencies and Gold Rising.
Big green candle at 6pm IST exactly when nfp data came
#EURUSD #XAUUSD #USEconomy
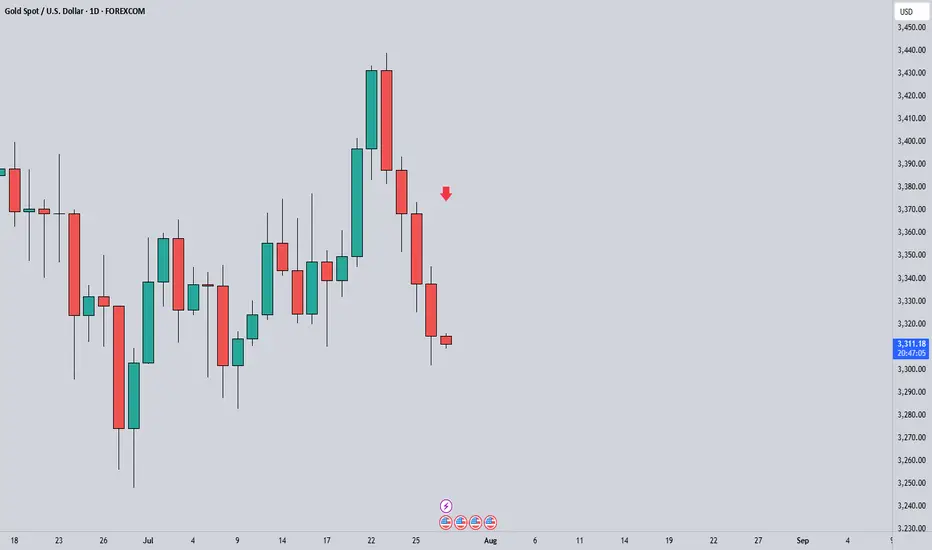
XAUUSD Short ProjectHi guys...😎
It's time to do a Short Project on XAUUSD with 3 key reasons:
1. Price Drivers: institutional shorting
2. Trend: down
3. Momentum: bearish
Action: waiting for entry on the intraday timeframe (entry will be published further)
$BTC needs a massive diaper change....BTC is crossing key technical points, pointing clearly in an bearish trend. The trend will likely accelerate and potentially aggressively. I have been through several turns, not financial advise and always do your due diligence, but for those who are up: sell and and don't get emotional about BTC, unless there is a clean / clear support levels. Crypto bros will be eating rice and beans very soon and still be trying to FOMO crypto. This could be way worse than FTX!
Stay safe and for signal support levels use UltraAlgo to avoid wasting time trying to find support / resistance levels.....best of luck!

Ocean Pal, Inc $OP going to .01 centThis one will soon be at .01 cent. Why? Outstanding shares went from 7 million to over 170 million as of a July 31st filing! OceanPal is based is Greece (not known for their financial accountability). There are others posting about an upswing to $3 based on TECHNICAL analysis. However, they are ignoring the fundamentals. Short this one if you can!

WeBull Look Ahead $BULLRecently took a look at WeBull and I believe there is a huge arbitrage opportunity from NASDAQ:HOOD to $Bull.
Although RobinHood is building something much much bigger than anticipated, including banking, I think WeBull can take some of $HOODS market share depending on their direction.
-Webull's total revenues grew 32% year-over-year to $117 million in the first quarter of 2025, according to SEC filings
-Customer assets increased 45% year-over-year, reaching $12.6 billion at the end of Q1 2025, according to Webull
-The number of registered users grew by 17% year-over-year, according to Webull
-Partnership with prediction market Kalshi will grow profits for WeBull exponentially.
www.nasdaq.com
This Might be the best price to get in today depending on WeBull's Success.

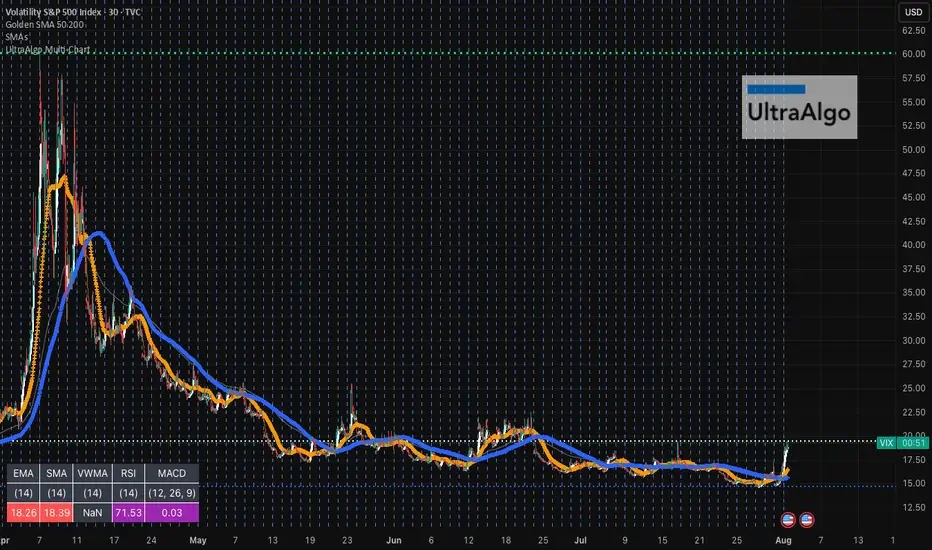
VIX will save you! Learn how to trade itHave been trading the VIX for years and it is absolutely gorgeous how well it performs when everything else tanks! Check out monthly spikes, it's trend, and cycles going back over 30 years. For details DM on the ABCs of using leverage without taking on any directly yourself and trading entry / exits with backtesting algorithmic support!
Soon we will get to the 20s and then it's when the fun begins....30s and 40s is very much a real scenario and the economy is doing far worse than people think. Most stocks are trailing below SMA 200 and only a dozen companies are holding the ship afloat. This is not sustainable!
The S&P is highly correlated, most in 5 years, which means that diversification has less impact. VIX has a beta of 0.1! Let that sink in, use it to your advantage before the massive correction happens. Not financial advise, always do your own due diligence, but have beaten the market multiple times over :)
GBP/USD | SMC Roadmap – Clinton Scalper POV🧠 Institutional Structure Overview
GU has been aggressively distributed from the 1.358xx premium zone, creating a strong downward market structure. We now observe:
A clean internal BOS confirming bearish intent
Major liquidity voids left behind
Price currently resting around discount levels (0.236–0.0 zone)
This sets the stage for a "fake recovery" trap before deeper markdown.
📉 Anticipated Smart Money Playbook
🔹 Scenario 1 – Short-Term Internal Rally (Liquidity Grab)
Price may engineer liquidity by forming a corrective retracement toward:
→ First Rejection Zone: ~1.33747 (aligned with fib 0.5 & diagonal internal trendline)
→ Extended Trap Zone: 1.34893 (near fib 0.705 + previous unmitigated OB)
This will allow Smart Money to unload positions before continuation lower. Expect a sharp sell-off post-liquidity sweep.
🔹 Scenario 2 – Continuation Without Full Retrace
If price fails to climb above 1.325xx, we could see an early breakdown after a minor internal rally. Key level to watch:
→ Support-to-Sell Zone: 1.31622
A clean break + retest here opens the way for a bearish expansion toward mid-July lows.
🎯 Key Levels to Monitor
Support Zone: 1.31622 → Valid for potential internal bounce
Short-Term Target if rally forms:
→ 1.33747 → Liquidity Cluster
→ 1.34893 → Final Trap Zone before HTF selloff
Mid-Term Target if breakdown confirmed:
→ 1.3050 → Old demand + final downside imbalance
→ Below 1.30 → Long-term liquidity void
🔍 SMC Takeaways
Premium Zone = Distribution, especially when price is beneath BOS
Discount Zone = Trap/Reload, but not always for bullish continuation
Market seeks efficiency, so every imbalance is eventually filled
True entry is not at key levels, but at confirmations within them (M5/M15 shift after sweep)
🎯 Trade Smart. Think Like Liquidity.
📌 Follow @ClintonScalper for more SMC breakdowns with precision.

XAUUSD
XAUUSD Updated in 30M :
The gold signal is marked on the chart based on the latest price changes and the supply and demand in the market. These points include the entry point, stop loss, and take profit.

Possible Gold Reaction Scenarios to Today's Jobs ReportMarket expectations for today's nonfarm payrolls change to be 104k, with the unemployment rate projected to rise to 4.2% from 4.1%. The divergence between payroll growth and the unemployment rate is mainly due to the birth-death model used in payroll calculations and expectations for either a halt or rebound in the labor force participation rate.
Fed Chair Powell recently stated that the "main number to watch" is the unemployment rate, which raises its importance in today’s data release. If the participation rate rises sharply, the unemployment rate could even increase to 4.3%, which may put a cap on the recent rally in the dollar index.
There is also a risk that a very strong payrolls number could be released alongside a rise in the unemployment rate. This combination may trigger a volatile and uncertain market reaction with multiple direction changes.
In similar past scenarios, markets typically reacted first to the payrolls data, then shifted focus to the unemployment rate shortly after.
For gold, look for 3310 and 3288 as pivot levels that could open the door to 3342 on the bullish case and 3270 on the bearish case.

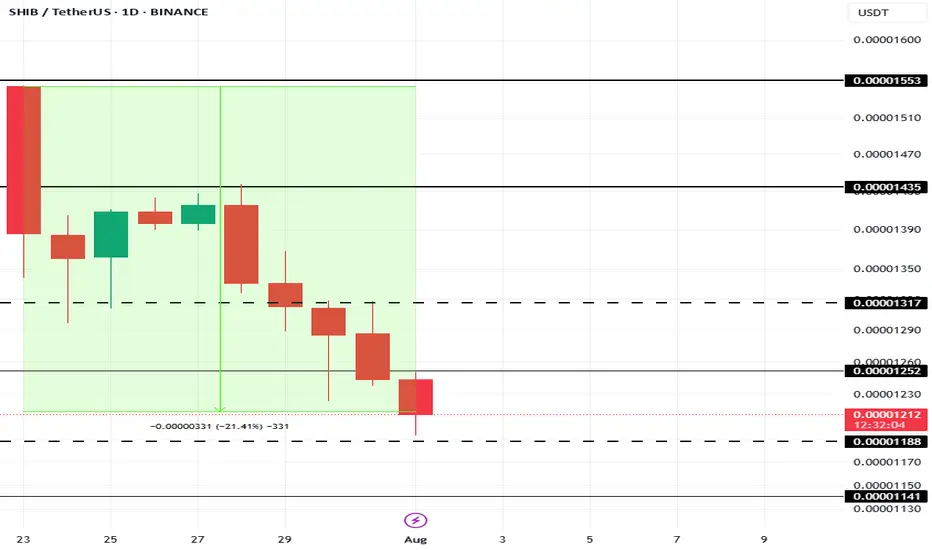
This Is The Cause Of Shiba Inu Price’s 21% Fall In 10 DaysAt present, BINANCE:SHIBUSDT price is sitting at $0.00001210, down 21% over the last 10 days . The drop in Shiba Inu's price can be traced to a sharp decline in the number of new addresses interacting with the token.
In the last 10 days, the number of new addresses has decreased by nearly 40% . This sudden exit of new investors indicates waning confidence in BINANCE:SHIBUSDT price potential, particularly after an extended rally earlier in the year.
If this trend continues, BINANCE:SHIBUSDT could lose the critical support level of $0.00001188, pushing the price down to $0.00001141 or potentially lower. However, if SHIB manages to hold onto its $0.00001188 support level, there is a possibility of recovery.
A bounce from this level could push BINANCE:SHIBUSDT price up to $0.00001317 . Securing this level as support would create a bullish scenario, invalidating the bearish thesis and offering hope for further price growth in the near future.
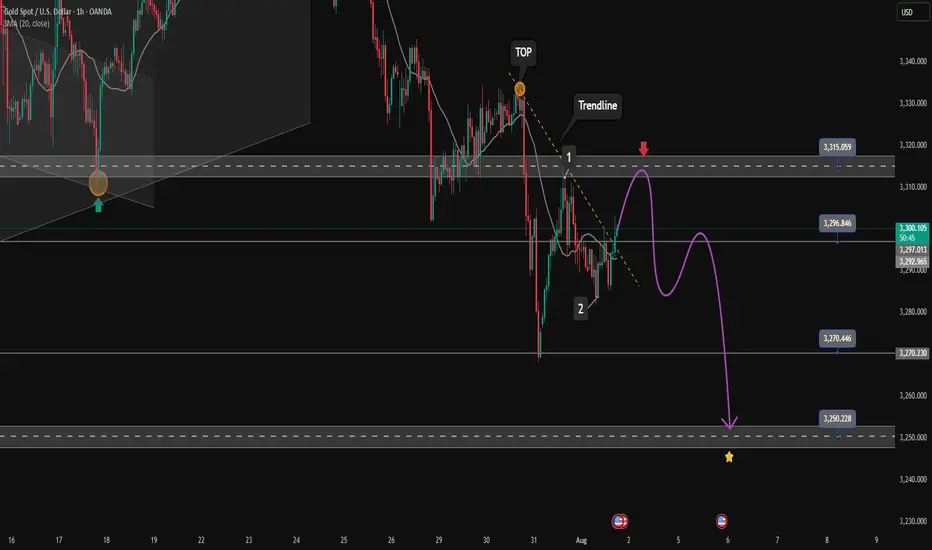
Nonfarm Pay Attention Zone✏️ OANDA:XAUUSD is recovering and increasing towards the resistance zone of yesterday's US session. The 3315 zone is considered a strategic zone for Nonfarm today. A sweep up and then collapse to the liquidity zone of 3250 will be scenario 1 for Nonfarm today. If this important price zone is broken, we will not implement SELL strategies but wait for retests to BUY. It is very possible that when breaking 3315, it will create a DOW wave with the continuation of wave 3 when breaking the peak of wave 1.
📉 Key Levels
SELL trigger: Reject resistance 3315.
Target 3250
BUY Trigger: Break out and retest resistance 3315
Leave your comments on the idea. I am happy to read your views.
Gold’s Glitter Fades: Why $3,250 Is the Next Big Drop🧠 Fundamental Analysis
Despite recent bullish momentum, several macroeconomic and policy-driven headwinds could pressure gold prices lower toward the $3,250 mark:
1. **Fed Policy Shifts (Higher for Longer):**
The Fed’s persistent “higher-for-longer” stance on interest rates has kept real yields elevated. With the U.S. economy still showing resilience (strong labor market, consumer spending), markets are pricing out aggressive rate cuts. Higher real yields reduce gold’s appeal as a non-yielding asset.
2. **Strengthening U.S. Dollar (DXY):**
Renewed dollar strength, driven by global risk aversion and higher U.S. yields, is acting as a headwind for gold. Since gold is priced in dollars, a rising DXY typically puts downward pressure on bullion.
3. **China & India Demand Weakness:**
Physical gold demand in key markets like China and India has been softening. High local prices, subdued consumer sentiment, and tighter liquidity conditions in China are dampening jewelry and investment demand.
4. **Geopolitical Easing:**
As geopolitical tensions (e.g., Middle East or Ukraine) show signs of stabilization, the fear premium embedded in gold could start to unwind.
---
## 📉 Technical Analysis – Bearish Setup to $3,250
From a chartist’s view, gold shows early signs of technical exhaustion and potential reversal:
1. **Rising Wedge Breakdown:**
Gold recently broke down from a **rising wedge pattern** on the daily timeframe—a classic bearish continuation setup. Price failed to hold the breakout above \$2,450 and is now forming lower highs.
2. **Bearish Divergence (RSI & MACD):**
Both RSI and MACD are flashing **bearish divergence** on the weekly chart. While price made new highs, momentum indicators did not confirm—suggesting weakening buying pressure.
3. **Fibonacci Retracement Targets:**
A pullback toward the **50% retracement** of the March–July rally aligns closely with the \$3,250 level. This would be a logical technical correction zone.
4. **Volume Profile Gaps:**
The VPVR (Volume Profile Visible Range) shows a low-volume node around $3,250, implying weak support. If price breaches the $3,400 psychological level, a swift drop to $3,250 is plausible.
5. **Elliott Wave Perspective:**
If the recent top was wave 5 of a larger impulsive structure, we may now be entering an **ABC corrective wave**, with Wave C potentially targeting the $3,250 area.
---
## 📍 Key Levels to Watch
* **Resistance:** $3,420 $3,500
* **Support:** $3,400 → $3,250 → $3,000
* **Trigger Point:** Break below $3,400 with volume confirmation
---
## 📊 Strategy Notes
* **Short Bias**: Watching for rallies to short near \$3,400–\$3,450 with tight stops.
* **Risk Management**: Be cautious around key macro events (NFP, CPI, FOMC).
* **Confluence is Key**: Look for alignment between macro headwinds and chart setups.
---
📌 **Conclusion:**
While gold’s long-term bull thesis remains intact, a medium-term correction to $3,250 appears increasingly likely due to weakening fundamentals, overbought technical conditions, and waning momentum. Traders should prepare for volatility and focus on disciplined execution around key support zones.
