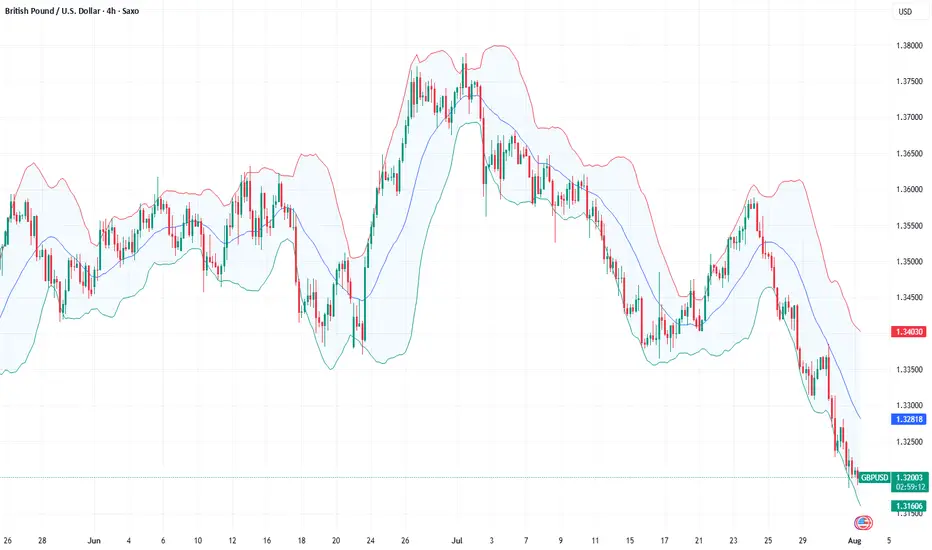
Could GBPUSD break the support at 1.3100?The pound extended its decline amid a stronger dollar and softening UK labour market, which fueled BoE rate cut expectations. From a technical perspective, GBPUSD broke out of the ascending channel and closed below the Ichimoku Cloud. If GBPUSD extends its decline and breaks the support at 1.3100, the price could approach the following swing low at 1.2720. Conversely, a rebound from the support at 1.3100 could prompt a retest of the resistance at 1.3380.
By Li Xing Gan, Financial Markets Strategist Consultant to Exness
Fundamental Analysis

Waiting for non-farm payroll dataGold prices (XAU/USD) remained under pressure in Asian trading on Friday, trading below $3,300, not far from the January low reached earlier this week. Gold failed to extend its modest overnight rebound, primarily due to the strong US dollar.
The Federal Reserve's latest hawkish tone has prompted a reassessment of the timeline for interest rate cuts, boosting demand for the US dollar and weighing on the non-interest-bearing asset, gold.
The US dollar index rose for the seventh consecutive day, reaching a new high since late May, further weakening gold's appeal. Key to the dollar's momentum lies in the latest inflation data: the US PCE price index rose to 2.6% year-on-year in June, while the core index remained stable at 2.8%, exceeding market expectations and reinforcing the view of persistent inflation.
"Both inflation data and GDP data suggest the US economy remains resilient, giving the Fed little reason to rush into easing," said a Fed observer. "This limits gold's near-term potential as a hedge."
Meanwhile, US President Trump signed an executive order on Thursday imposing import tariffs ranging from 10% to 41% on several trading partners, including Asian countries. Countries with trade deficits will face tariffs of at least 15%. This move has heightened global trade concerns, boosted market demand for safe-haven assets, and provided some support for gold.
Despite this, gold prices remain mired in a downward trend. Investors are generally maintaining a wait-and-see approach, awaiting Friday's release of the US July non-farm payroll report. This data is seen as a key indicator of economic resilience and the interest rate outlook. Expectations suggest an increase of 110,000 jobs and a slight rise in the unemployment rate to 4.2%.
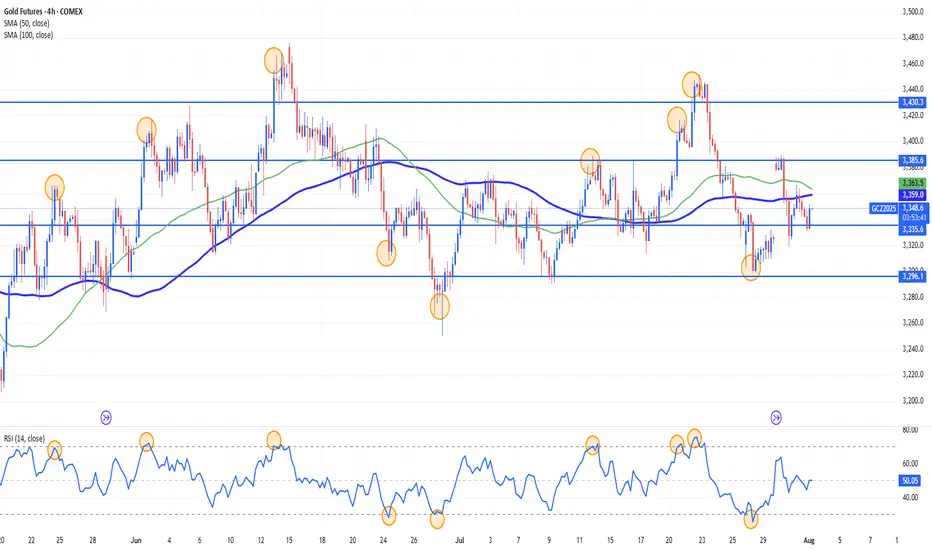
The daily gold chart shows that prices are in a weak consolidation phase, capped by key resistance near $3,320. If gold prices fail to break through this area, there is a risk of further decline in the short term. Stronger resistance lies above $3,350. A breakout on strong volume could trigger a rebound towards the $3,380 area, potentially pushing the price above $3,400.
As for downside support, the 100-day moving average provides initial support near $3,270. A break below this could trigger further downward pressure, targeting the $3,240 area, the June low. A further break below this level would target the psychologically important $3,200 level.
In terms of indicators, the MACD death cross continues, with a shortening red bar, indicating weakening bearish momentum but no reversal. The RSI remains in neutral to weak territory, not clearly oversold.
The current gold trend is characterized by a "structurally bearish, sentimentally supportive" pattern. Despite the trade war and heightened global risk aversion, the Federal Reserve's caution about inflation and the strong dollar are exerting significant pressure.
If the July non-farm payroll data is strong, gold could test further technical support. Conversely, weak data or a pullback in the dollar could trigger a technical rebound. PEPPERSTONE:XAUUSD ACTIVTRADES:GOLD VANTAGE:XAUUSD FOREXCOM:GOLD EIGHTCAP:XAUUSD FOREXCOM:GOLD
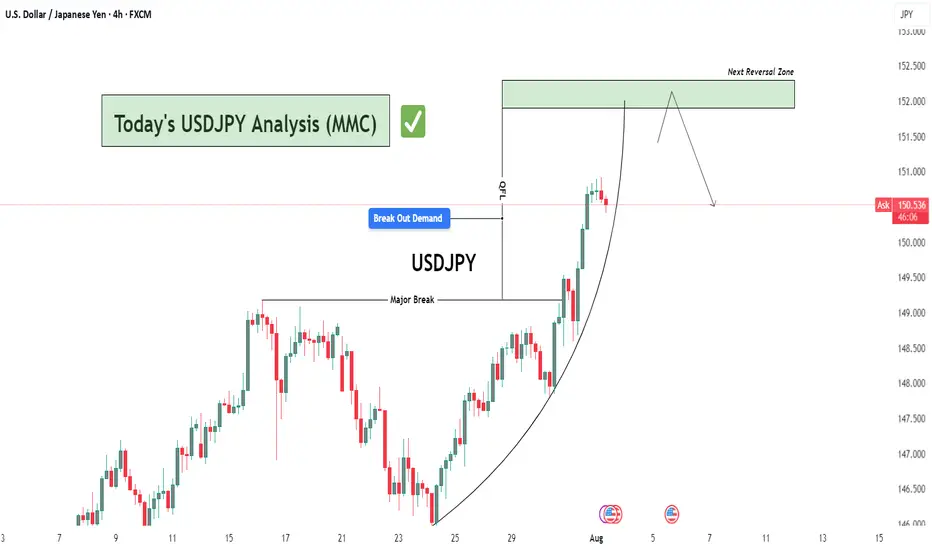
USDJPY Analysis : Key Reversal Zone After Parabolic Rally🧠 Market Psychology & Structure
The USDJPY 4-hour chart reveals a classic parabolic curve pattern signifying an acceleration phase in bullish momentum. This phase typically occurs during the final stages of a bullish move, where price action becomes increasingly steep due to aggressive buyer participation.
The rounded curve drawn on the chart reflects momentum compression—where pullbacks become shallower, and higher highs are formed rapidly. However, this pattern often ends in a blow-off top or a sharp correction, especially when approaching key supply zones.
🧩 Key Technical Highlights
Major Break Zone: The previous resistance around 148.80–149.00 (now flipped to support) was clearly broken with strong bullish candles, confirming trend continuation.
Break Out Demand : Price retested the breakout zone (around 149.80–150.00) before launching higher, validating this level as a new demand zone.
Current Price Action: The pair is currently hovering around 150.50 after a powerful rally, showing early signs of exhaustion with smaller bullish candles and slight upper wicks.
🔍 Target Area – Next Reversal Zone (151.80–152.30)
The green highlighted zone marks a strong supply area / reversal zone, identified from:
Previous price rejections in historical data.
Overbought conditions due to vertical rally.
Completion of the parabolic structure (climax zone).
We can expect price to reach this zone in the coming sessions, where it may:
Face strong selling pressure.
Trigger short positions from institutional sellers.
Lead to distribution or reversal back toward the demand area near 150.00.
🔄 Forecast & Trade Plan
Scenario 1 (High Probability): Price taps into 151.80–152.30, forms bearish engulfing or rejection wick, then pulls back to 150.00 or lower.
Scenario 2 (Invalidation): Strong breakout above 152.30 with momentum—bullish continuation towards 153.00+ possible.
🧠 Trader’s Mindset (MMC Insight)
This chart suggests a matured bullish trend nearing exhaustion. As smart traders, we anticipate rather than react. Wait for the price to reach the supply zone, then observe for confirmation (bearish structure, divergence, candlestick pattern) before shorting.
Avoid chasing longs at these highs—risk-to-reward is no longer favorable. Patience will offer a much cleaner entry if the reversal unfolds as expected.
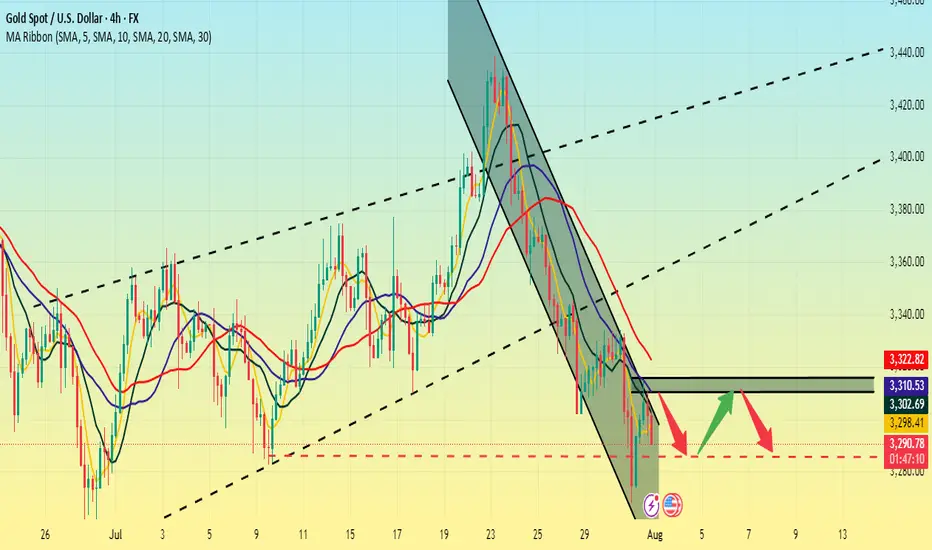
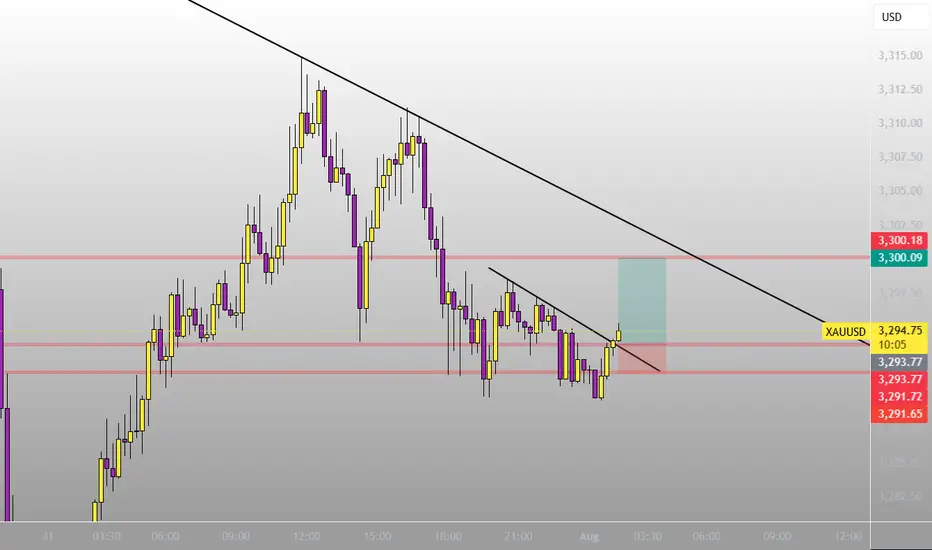
Gold Price Consolidates in Symmetrical Triangle, Breakout Ahead?Gold shows a clear bearish trend within a well-defined downward channel. Price action continues to form lower highs and lower lows, reinforcing the ongoing downtrend. The recent rejection from $3,312 suggests that bulls are struggling to regain control, and the market remains pressured by selling momentum. The price is currently hovering near $3,287 just above horizontal support zone.
📉 Potential Scenarios
- Bearish Continuation (Most Likely)
- If price continues to stay below $3,300 and breaks below $3,281, it may aim for $3,261 and $3,249.
- A close below $3,281 would confirm further bearish pressure and signal downside continuation toward the $3,240s range.
- Short-Term Bullish Retracement
- If price holds above $3,281 and breaks above $3,300–$3,312, a relief rally may occur at first resistance: $3,306 and second resistance: $3,312.
- However, unless gold breaks above $3,332 (previous swing high), this would still be considered a bear market rally.
- Range-bound Movement
- A third scenario is sideways price action between $3,281 and $3,312, where neither bulls nor bears take control immediately. This would represent market indecision or awaiting external catalysts (e.g., economic data, Fed policy).
🔍 Trend Outlook
- Short-Term Trend: Bearish
- Medium-Term Trend: Bearish, unless price breaks and sustains above $3,312
- Long-Term Trend: Neutral-to-bullish, as long as price holds above the macro support zone near $3,240
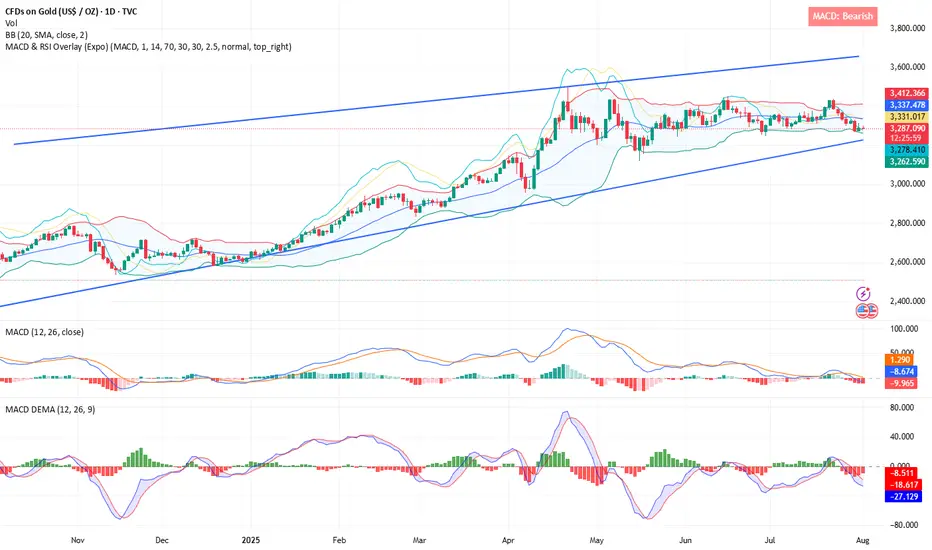
1D Chart Long Term Possible Scenario
The price is currently trading around $3,285, sitting just above the triangle’s ascending trendline support and within a key horizontal demand zone around $3,250–$3,300, which has held multiple times in the past.
If bulls manage to push the price above $3,360–$3,400, it could confirm a breakout and open the door toward the next major resistance at $3,450. However, if price fails to hold above the current ascending trendline, a breakdown could retest the base support near $3,248 or even lower toward $3,150
Gold is currently in a neutral consolidation phase within a symmetrical triangle, with both bullish and bearish breakout scenarios possible. The breakout direction from this pattern—expected in the coming weeks, will likely set the tone for gold's medium-term trend.
Note
Please risk management in trading is a Key so use your money accordingly. If you like the idea then please like and boost. Thank you and Good Luck!

Gold Range-Bound and Ripe for Mean Reversion Plays?Gold has been locked in a sideways, range-bound regime for months, largely oscillating between the 3400 and 3160 levels. This lack of clear directional trend stems from conflicting fundamental forces: on one hand, sticky inflation and resilient U.S. data have bolstered the U.S. dollar and yields, weighing on gold. On the other, global growth concerns and geopolitical tensions continue to underpin demand for the metal as a safe haven. The push and pull of these opposing themes has created an environment of indecision and choppy price action.
While long-term investors may find this frustrating, range traders and mean reversion strategies are thriving. With technical boundaries so well-defined, short-term oscillations within the range are offering repeated opportunities for disciplined entry and exit.
Currently, XAUUSD is trading just under the 3296 level after a recent rejection from the 3350s. The bearish structure suggests a potential leg down toward the 3160–3180 support zone. However, absent any major economic surprises or geopolitical shocks, this could merely be another deviation from the mean rather than a true breakdown. Indicators like RSI and Stochastic Oscillator are already hinting at early signs of bullish divergence.
If price holds above or near 3160, the setup for another mean-reversion trade back toward the mid-range (around 3296 or higher) could unfold. In the current environment, fading extremes rather than chasing trends remains a strategy of edge, as depicted by the 14 period RSI.
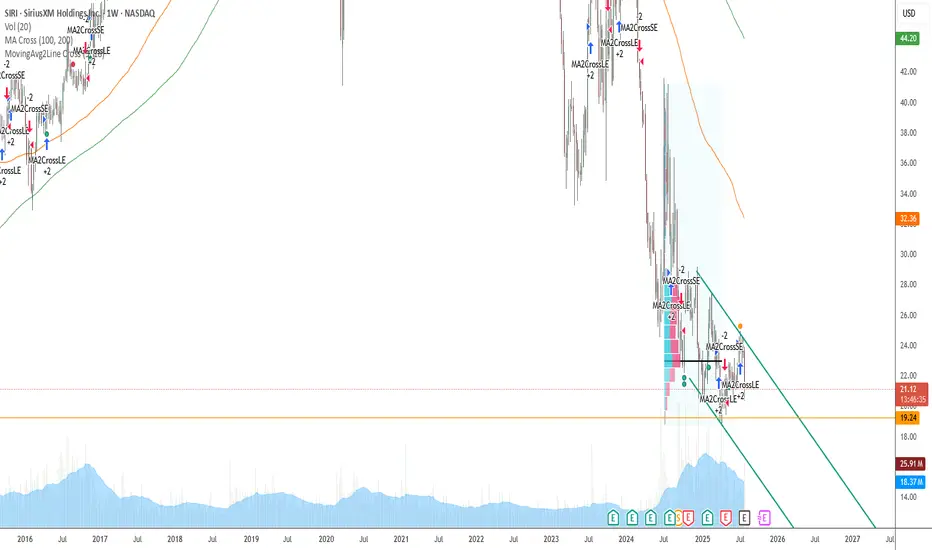
SIRI on the way down , correction begunThis stock is have a consistent Berkshire position and looks good to buy on a dip...
Fundamental Market Analysis for August 1, 2025 GBPUSDThe pound remains under pressure due to the strengthening of the dollar and expectations of further easing of the Bank of England's policy at its meeting on August 7. The regulator's rhetoric in June-July pointed to a “gradual and cautious” course of rate cuts amid weak growth, and the market is pricing in the likelihood of another move at the next meeting. The situation is complicated by the fact that July inflation in Britain unexpectedly accelerated, but the regulator interprets it as a temporary consequence of tariff and price shocks, not wanting to tighten financial conditions excessively.
The external environment is also unfavorable for the GBP: the US has imposed new tariffs on a number of trading partners, strengthening demand for the dollar as a risk-free asset. For the UK, the trade implications are mixed: part of the supply chain is focused on the dollar zone, and industry is sensitive to global demand, which, in the context of prolonged uncertainty, is hitting investment and employment expectations. The risks of a decline in private sector business activity remain elevated.
Today, attention is focused on US employment data: if the labor market confirms its stability, the likelihood of a Fed rate cut in September will decrease further, which will keep the dollar in the ascendancy. All these factors combined create a bearish bias for GBPUSD in the short term, with any brief rebounds from local oversold conditions typically being used for selling.
Trading recommendation: SELL 1.32000, SL 1.32500, TP 1.31000
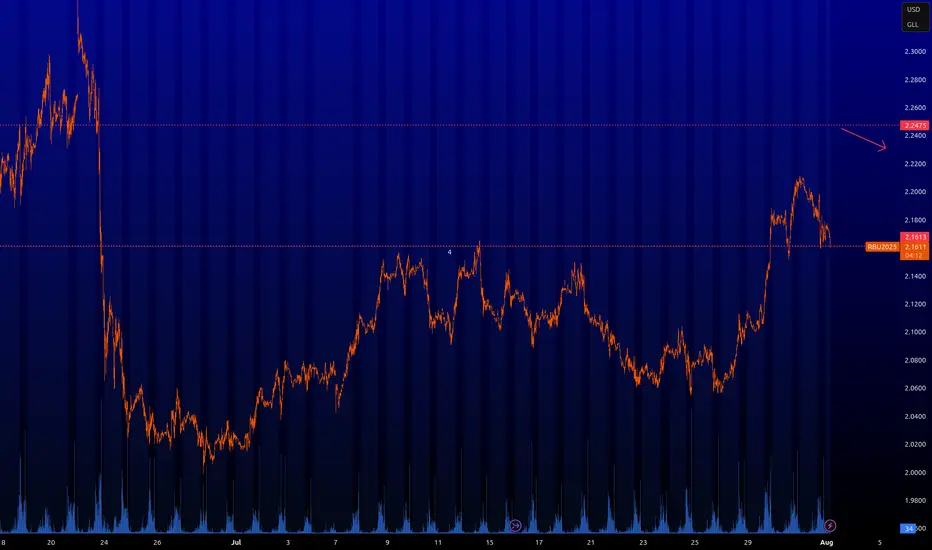
RBOB : Key levelsHere are the key levels that the market will be interested in. We can scalp from 2.2475. I have never traded this instrument, I do not know the specifics, but the level will be interesting. We can expect a bounce from it. I am more interested if it becomes inactive.
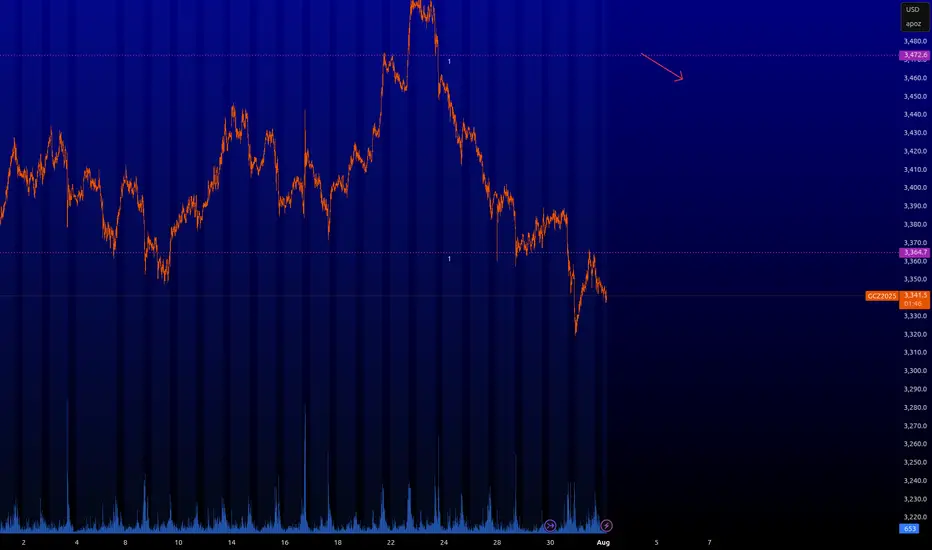
GC : Key levelsHere are the key levels that the market will be interested in. You can scalp from 3.472.
⚠️ VOLATILITY WARNING ⚠️
Trading around major news can be extremely unpredictable. Trade responsibly!
thinking about 3.300 & 2.813 is it possiblethinking about 3.300 & 2.813 is it possible under a cloud of discouragement??


Review a Few of our Trades & Update Overall Market PerspectiveIn this video, I review some of the trades taken over the past 1-2 weeks, and discuss in more detail the current technical and geopolitical/macro thesis on AMEX:SPY NASDAQ:QQQ NASDAQ:SQQQ AMEX:SOXS , and the overall market. Exciting times, and ripe with opportunity to *potentially* BTD (again).

The market is concernedThe structure of the S&P 500 daily chart implies a market that is concerned. Although many of the fundamentals released on Thursday were basically meeting market expectations, there is concern about the impact of the tariffs there is concern about geopolitical factors and there is concern about how the market will absorb Friday's economic numbers. Sellers are here but will they have a reason to follow through to the downside as we go into the weekend.

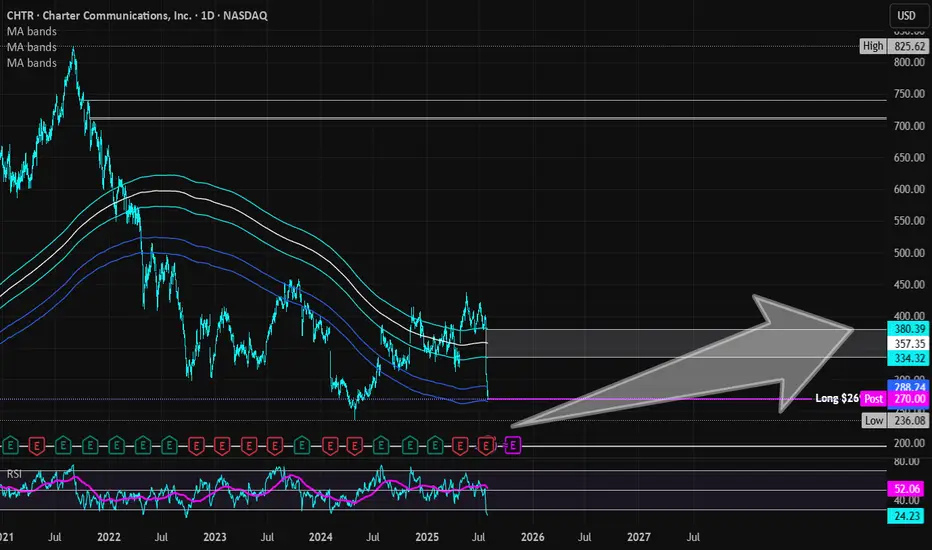
Charter Communications (Revised) | CHTR | Long at $269.50 **This is a revised analysis from December 26, 2024: . My stop was triggered in that original trade after the recent price drop (some gains were taken at 13%, as noted).**
Charter Communications NASDAQ:CHTR stock recently dropped due to a disappointing Q2 2025 earnings report, with earnings per share of $9.18 missing estimates of $9.58 and a larger-than-expected loss of 111,000 residential internet customers. Despite the recent subscriber losses and increased competition, the following factors suggest long-term growth potential:
Network Expansion: Launch of 2x1 Gbps service in eight markets in 2025, boosting competitiveness.
Rural Growth: Rural revenue projected to reach 10–15% of total revenue by 2025.
Cox Acquisition: $34.5B merger expected to close by mid-2026, yielding $500M in annual cost savings by 2028 and enhancing market share.
Mobile and AI Strategies: Strong mobile growth and AI-driven customer service tools to improve retention and efficiency.
Lower Interest Rates: Reduced bowering costs to help with profit margins.
Charter's President/CEO recently grabbed $2.5 million in shares under $300. From a technical analysis perspective, there is an open price gap near $195 that could be of concern in the near-term. I foresee that being closed if the whole market flips or more bad news for the company arises. But, with a P/E of 7x and the industry average being near 13x, I believe NASDAQ:CHTR is a good value at the moment.
Thus, at $269.50, NASDAQ:CHTR is in a personal buy zone with a note of "risk" of a drop near $195 (a second personal entry point if it hits that level before targets are reached).
Targets into 2028:
$330.00 (+22.4%)
$375.00 (+39.1%)
XAUUSD
XAUUSD Updated in 5M :
The gold signal is marked on the chart based on the latest price changes and the supply and demand in the market. These points include the entry point, stop loss, and take profit
**07/31/25 Trade Journal, and ES_F Stock Market analysis **
EOD accountability report: +
Sleep: 5.5 hours
Overall health: Good
** VX Algo System Signals from (9:30am to 2pm) **
— 9:00 AM Market Structure flipped bullish on VX Algo X3
— 9:30 AM VXAlgo ES X7 Sell signal
— 9:32 AM Bullish market structure got cancelled
— 11:40 AM VXAlgo NQ X1 Buy Signal
— 12:40 PM VXAlgo NQ X1 Sell Signal
— 1:00 PM Market Structure flipped bullish on VX Algo X3!
— 1:22 PM if we lose 6415 and stayy under it . Bullish Market structure is cancelled.
— 1:55 PM VXAlgo NQ X1 Buy Signal
What’s are some news or takeaway from today? and What major news or event impacted the market today?
Today marked the 4th day of the structure signals being iffy as they try to tip the volumes bullish just to cancel it right afterwards.
I was starting to get a bit tilted today as I had a bunch of orders at area that didn't get filled and eventually just gave up trying to have a green day and walked away.
looking at some of the other charts, i also we are getting a doji on the longer time frames and it is starting to look like bear's wet dream.
However, Mag 7 stock earnings were really great, the only downside was rate cut isn't happening.
News
*U.S. STOCKS END LOWER, VIX JUMPS AS S&P 500, NASDAQ RETREAT FROM RECORDS DESPITE MONSTER META AND MICROSOFT EARNINGS
What are the critical support levels to watch?
--> Above 6415= Bullish, Under 6403= Bearish

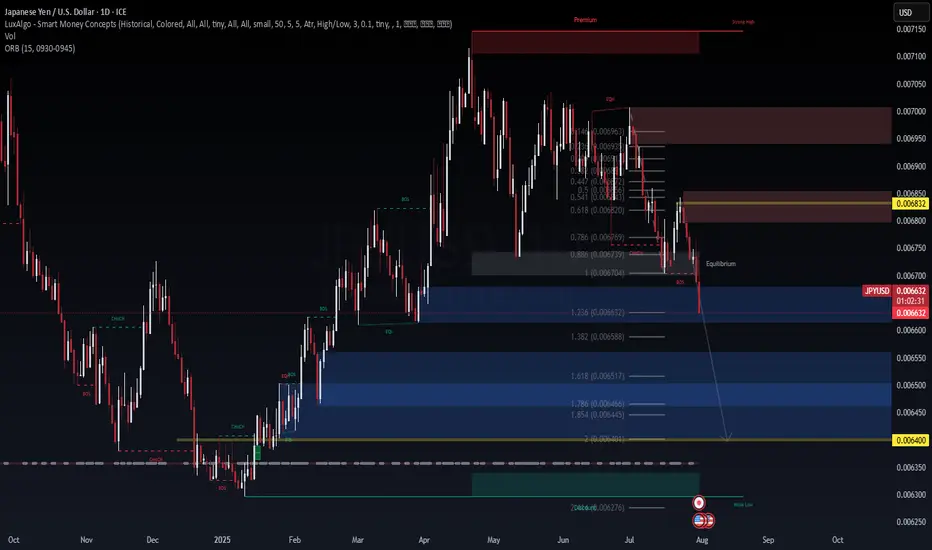
JPY/USD — Long-Term Technical Setup & Market Outlook💱 JPY/USD — Long-Term Technical Setup & Market Outlook
1. 🧭 Market Context & Catalysts
US-Japan monetary divergence: The Fed remains rate-tight while the BoJ maintains ultra-loose policy, putting persistent downside pressure on the yen.
Economic drivers: Strong US economic data (growth, labor, inflation) supports USD strength; Japan’s macro data remains soft.
Sentiment signals: Hawkish Fed tone continues; safe-haven flows may limit further USD gains in geopolitical risk shifts.
2. 🧱 Technical Structure (Daily Timeframe)
Break of structure (BOS) below 0.00700 signaled the dominant bearish regime.
The price retraced into the 0.786–0.886 Fibonacci zone (~0.00676–0.00679), then resumed selling—textbook re-entry into areas of liquidity (Equilibrium).
Current price sits near 0.006631, just below BOS and equilibrium zone—suggesting continuation of bearish order flow.
Fibonacci extensions show projected targets at 0.006632 (1.236), 0.006588 (1.382), 0.006517 (1.618), and potential support area at ~0.006400.
A stronger support zone exists near 0.006276 (Weak low / domain demand zone).
3. 📝 Trade Plan & Risk Controls
Continuation Setup: Look to enter on a clean bearish candle close near ~0.00665. Target the Fibonacci extensions at 1.236, 1.382, and 1.618—approximately 0.006632, 0.006588, and 0.006517 respectively. A deeper extension into the 0.006400 zone is also possible. Place the stop-loss just above 0.00670, as this level invalidates the recent break of structure and implies rejection of downside continuation.
Pullback Re-entry Setup: If price retraces higher, consider a re-entry short near ~0.00680. Use the same Fibonacci targets as above. Invalidate the setup if price breaks above 0.00680, which would suggest a shift toward bullish structure or absorption of the prior supply zone.
4. ⚠️ Watch Key Risks & Signals
If price breaks above the 0.786 zone or creates a higher high above equilibrium, bearish thesis fails.
Monitor US data releases: FOMC minutes, inflation or jobs data—shifts could accelerate USD momentum.
Geopolitical shocks or risk-off flows could trigger yen strength reversal.
✅ Summary Outlook
JPYUSD remains firmly bearish with technical integrity intact.
Valid corrective levels now become sell zones toward continuation targets.
Extended downside toward 0.00640 area is plausible, with further drop to 0.006276 zone if trend continues strongly.
charge fees on patentsTrump's decision to charge fees on patents exposes IDCC shares to long-term decline

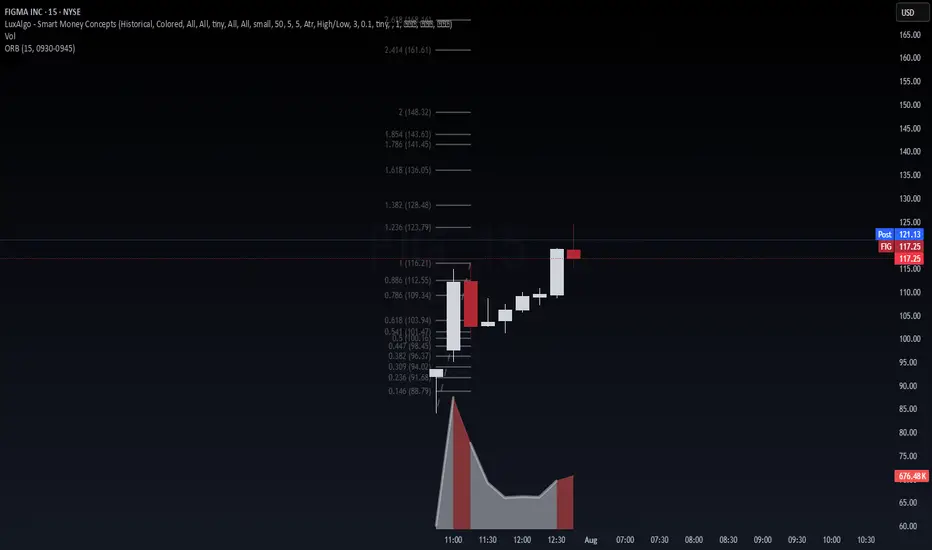
FIGMA INC. (FIG) – IPO Day Momentum + AI Design Wave📈 FIGMA INC. (FIG) – IPO Day Momentum + AI Design Wave
Figma just launched its IPO at $33/share, raising over $1.2B with intense demand (reportedly 40× oversubscribed). The stock opened explosively around $85 and surged past $115 within hours—marking one of the strongest SaaS IPOs in recent memory.
This debut is powered by:
The failed $20B Adobe acquisition (2023), which boosted Figma’s independence and cash position via a ~$1B break-up fee.
Accelerated AI integration: new tools like Figma Make, Draw, and Buzz debuted at Config 2025, reinforcing its leadership in collaborative design.
A rebound in tech valuations and strong market timing for IPOs, with Figma now positioned as a bellwether for high-growth SaaS.
🔍 Technical View (15-min chart):
After the opening range breakout (0930–0945), price cleanly moved through the 0.618 and 1.00 Fibonacci levels. FIG is now hovering near 1.236 ($123.79) with next key extension at 1.382 ($128.48). Volume confirms sustained interest. A hold above $116 signals strength. Watch for:
Breakout continuation above $123.79 → $128.50
Retest of VWAP/Fib levels ($112–$109) for re-entry
Lock-up risk, but low near-term float = volatile upside
🎯 Thesis: This is institutional-grade price action backed by AI momentum, macro timing, and a clean technical base. Trade the trend, not the headline.
#FIG #IPO #AI #SaaS #Breakout #Fibonacci #VolanX #WaverVanir #TradingStrategy #MacroSignals
Gold consolidates on softer safehaven demand
Fundamental View
The Federal Reserve opted to keep interest rates unchanged with a hawkish tilt at its latest policy meeting which gave the USD a boost. Meanwhile, gold’s upside remains limited due to reduced safehaven demand, a stronger USD and a de-escalation in global trade tensions. Elevated US inflation figures and robust economic performance have continued to support the dollar, thereby limiting gold’s attractiveness.
Technical View
XAUUSD remains in a consolidation phase as long as it holds above the $3,285–$3,300 support zone. A decisive break above $3,355 could signal a resumption of bullish momentum, while a move below current support levels may open the door to further downside pressure.
By Terence Hove - Senior Financial Markets Strategist at Exness

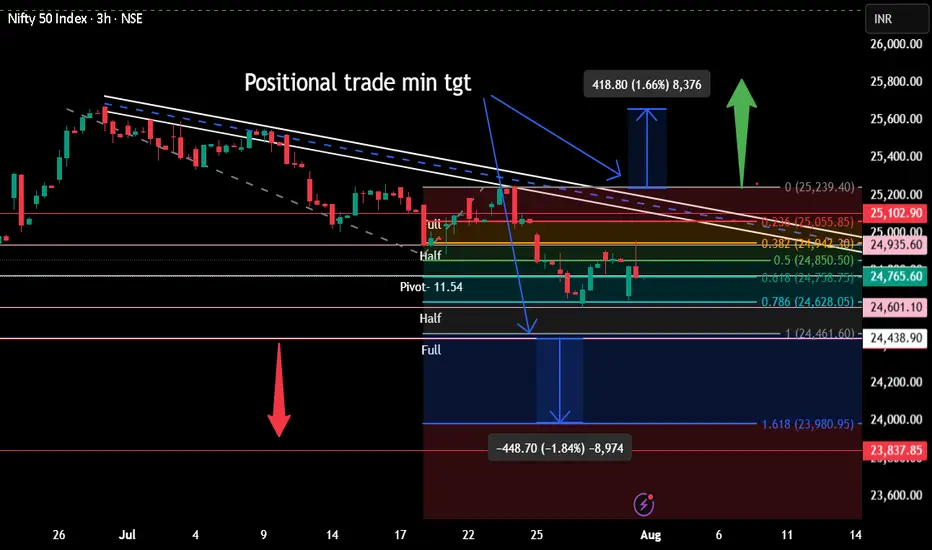
In addition to previous positional trade with targetThis are no buy sell recommendation but sharing for learning purpose only.
The US dollar is strong. Be wary of gold.The US dollar index rose, now above 100, before retreating slightly and fluctuating slightly, reaching 100 for the first time in two months. After a sharp drop to around 3270 on Wednesday, gold rebounded sharply today. With the US dollar breaking through 100 and the USD/JPY pair breaking through 150, gold is now struggling to maintain its position.
Thus, Quaid believes it's not appropriate to be overly bullish on gold for now. A significant decline is likely.
The 4-hour chart shows that the upper moving average resistance is currently around 3310-3315. If it breaks through 3315, it could potentially move towards 3325.
Conversely, if it fails to break through 3315 today, it could continue to consolidate in the 3315-3285 range. Waiting for new data to guide its trend.