July 30 2025 USDJPY Buy Limit ActivatedGood day, folks!
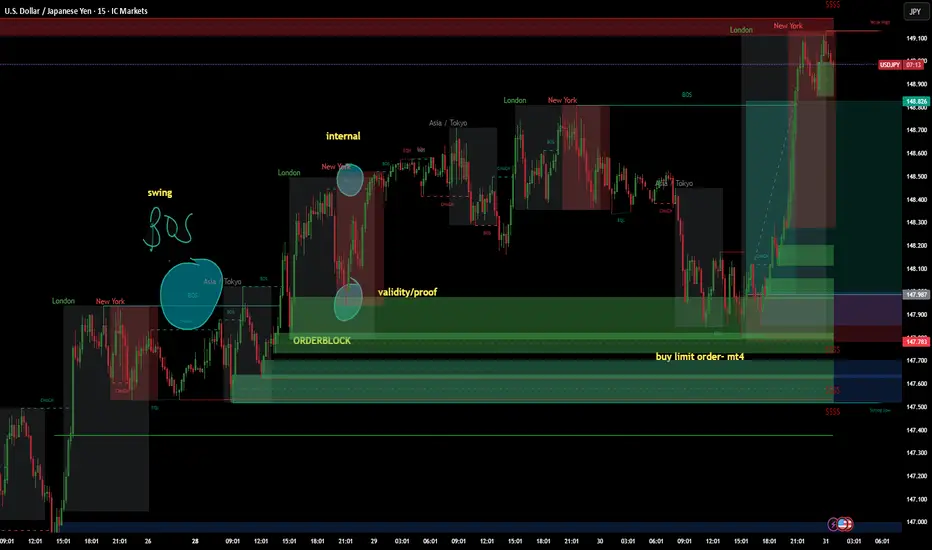
Another trade today! This is a continuation trade before the USD fundamental news. I've got some useful schematics on my chart for trading continuation momentum patterns with positive confluence in your fundamentals. You can see a swing structure BOS with validity of an internal structure: another BOS. I waited for the price to tap again into that valid order block, which also had validity of internal structure - BOS. The risk-reward (RR) is 1:4. Check the chart for detailed annotations.
I hope you find value in this trade today. Until next time!
#proptrader
#wyckoff
#supplyanddemand
#riskmanagement
Fundmentalanalysis
BULLISH TRI BREAK to Finish ABC Move for +2500 PIPS?! - UJHere I have USDJPY on the Weekly Chart!
Price has been meeting all the criteria since its LOWEST LOW recorded @ 75.565 in Oct. 2011 to have then started what looks to be a Correction Wave (ABC).
*This Low also seems to have been the completion of the 5th Wave of the Impulse Wave since UJ hit markets in Jan. 1971!!
On the chart you will see that we have continued to make HIGHER HIGHS & LOWS since our Low of 2011 and price after making its HIGHS, finding support at the Target Fib'd Retracement Levels!
This month of April has been a remarkable month for USD in the UJ pair:
-April has been nothing but overall BULLISH for UJ
-The past 2 weeks has not only given us a Break up out of the Resistance Zone of ( 151.944 - 149.710) that has contained our Highs since Oct. '22 but has CONTINUED to reach even HIGHER giving us a BULLISH BREAK of the BULLISH TRIANGLE that price has formed with our Resistance Zone and Rising Support created by our LOWS in Jan. of 2023 & 2024!
Fundamentally what really pushes this move is the fact that the USD is now looking to keep rates still "Higher For Longer" with potentially only 2 Rate Cuts this year!! This can really feed favorability from investors towards the USD!
What does this all mean??
Firstly, we want to see if this CURRENT HIGH price is moving on is VALID!!
*I would like to see Price retrace to test these HIGHS in the Resistance Zone of ( 151.944 - 149.710) to see if this level changes to SUPPORT!!
-If so, we will be looking to be BUYERS!!
Potential Range Target - ( 178.097 - 196.821 )
