My theory on BTCUSD future movement ($4.5k bottom)!Well this bear market is now 6 months long. It was inevitable, January parabolic blow-off was just too extreme for COINBASE:BTCUSD to digest the gains. After first month of bear market I saw a lot of people on social media talking like "Yall wait for summer!" and it was just absurd in my opinion. Although if we compare stock market with cryptocurrency market it's speed is like a speed of sound to a speed of light.. But still... it's cyclical!
Fact is that 70% of people in crypto in December, January was "average Joes" who saw gains and wanted to get rich quick and I blame media mostly for that. Keep in mind that some of them are still in it and already forgot about the money that they invest and are waiting for market to turn around and break even if possible. That is why I think it's going to take a little bit longer than expected, I'm expecting 3-4 break-even sell off around $10k , $12k and $14k-16k.
A lot of people (even my-self) was watching $6800 level where Triple bottom formed... It was broken with ease, but I had another theory al this time:
COINBASE:BTCUSD in my opinion there are two ways bear market will end or it will continue to a level where bear will be exhausted enough for bulls to take-over control.
First:
Bitcoin will touch $5k level area inside a September 2017 high and low channel. And then proceed upwards!
Second (in my opinion more likely because trend line and support cross there) :
Bitcoin will touch and bounce off the $4.5k area, in this area September 2017 low trend line and Fibonacci level 0.786 (also 2017 high and low) cross which could provide enough strong support for the price to bounce of.
Note: If COINBASE:BTCUSD breaks below that $4.5k (and closes below) forget about this idea and look for a another potential buy zone opportunity!
Note: This is not a financial advice in any form is just an opinon based on price action! Please leave a like if you find this helpful, or a comment if you want to add something! I'm here looking to grow a community where we all communicate, exchange ideas and so on! Peace
Future

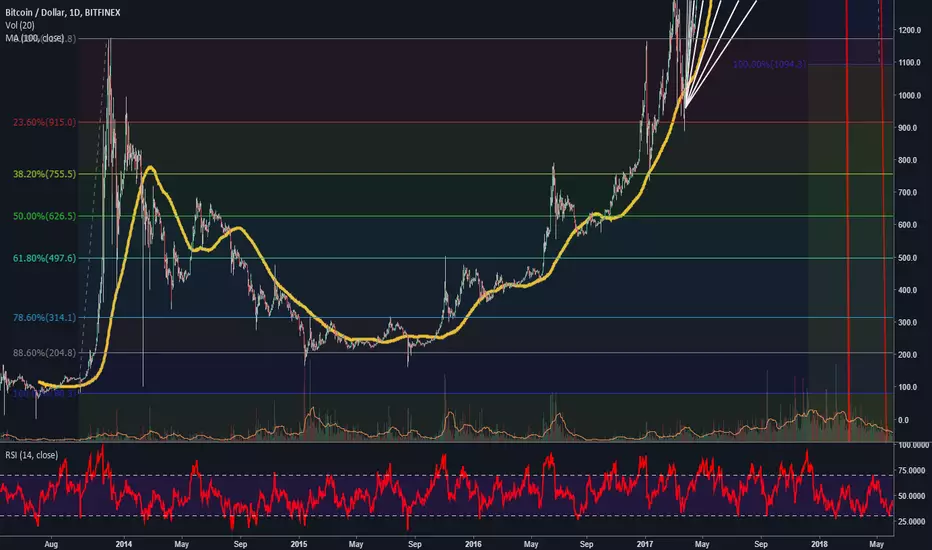
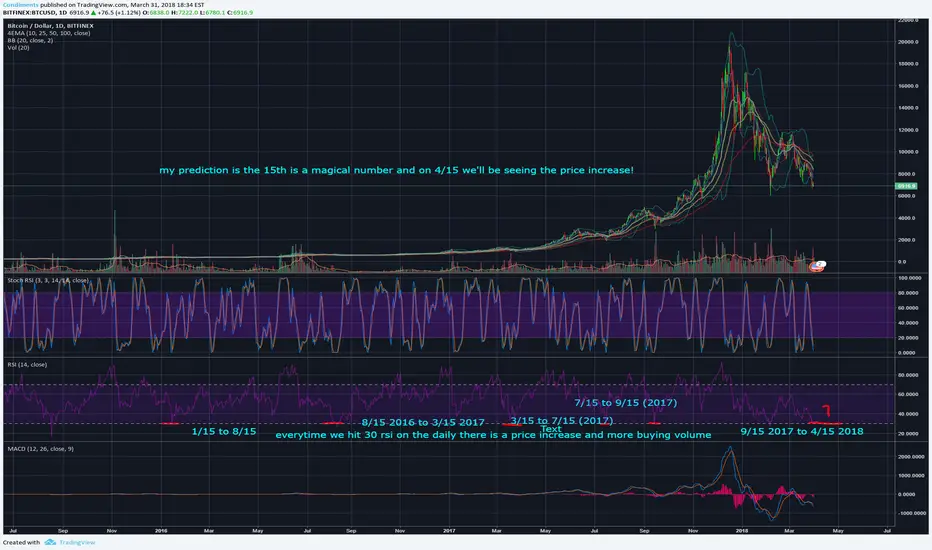
BTCUSD From Aug 2013 until 2017 Fib give 88.60% Support at $3200Well You see the Very low Support Level was at 88.60% on this chart.
If you have noticed that this price action is the same as we are in right now. I have posted also the chart from november 2017 until now in my TV so look at both charts and you will see identical price movement in both chart.
First the Highest bar and then the first low after the High it stops at 61.80% fibo level.
Also the waves after the first are identical.
So if we go through the whole fase than our support will be at 88.60% level!
on the latest chart from BTC that i have posted you can see that this level is around $ 3200
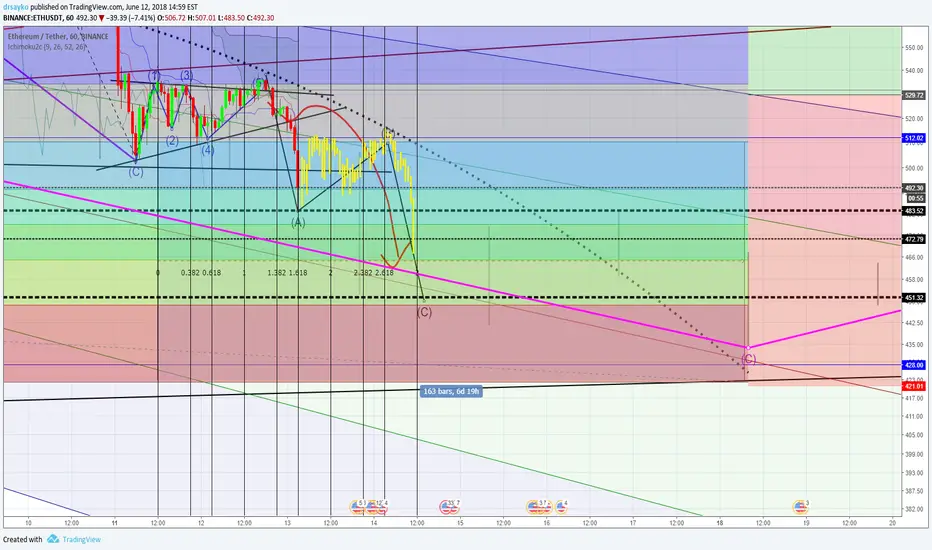
shortest strawmy "lucky" idea has just become very near to true trend line. let's see what is happens next. will ethereum follow our's "ghost of future" correction wave?
p.s.: this is not a trade investment recommendation.
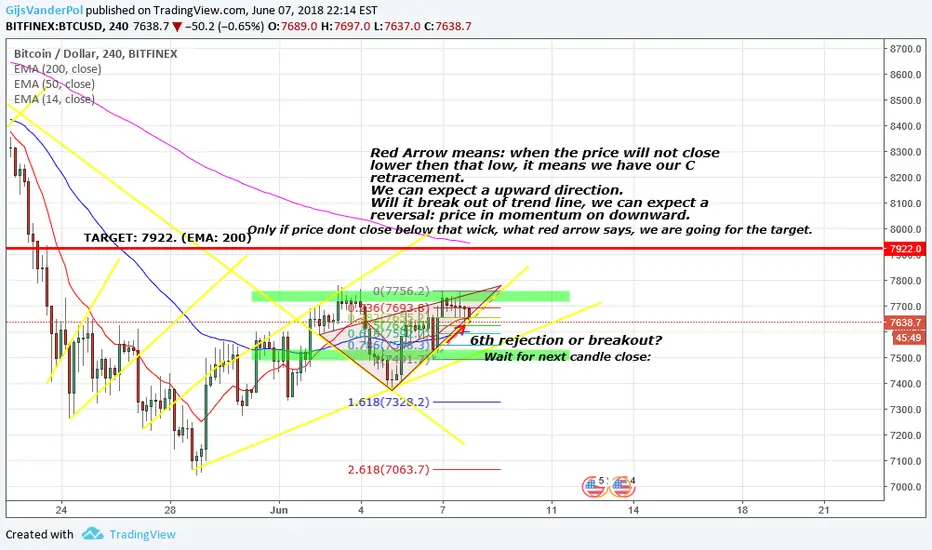
Great Analysis Bitcoin (SEE!)Hello my name is Gijs,
this is my first project. This is my speculation of Bitcoin.
Yellow,Blue or Red?What will happend for BTC???Hi,Welcome to my analyse about Bitcoin Feuture.
Two month ago i published an idea about BTC that said why we are expect to BTC change trend to Bullish in this short time.after Two month we saw that Btc could not change trend and break limits that controlling it.
So me and 2 of my expert co-workers decided to open this situation and explain it simple to community of Crypto World.As always i have to say this analyse made by our mind an knowledge and have a good chance to be wrong,so precaution to use this for your trades.
Let's open this Quickly.we illustrated 3 of most possible scenarios and will explain to you.Yellow one,Blue one and Red.Neither of these scenarios are full bearish because we are believe that BTC is in a huge channel from 2015 and we are now move to bottom of that channel and we will stay in bullish trend until we drop out of the channel.all these scenarios imagined ways to reach our last al time high and much better goals after that.
Yellow Scenario
This Scenario illustrated based on channel that Started from 15.8.2015 that we believe market released from pressure that 2014 correction on that period.we made a channel and moved in bottom of this bullish channel to 23.3.2017.in this date we started a parabolic super bullish movement that reached us to the top this channel,better to say made a roof for this channel.after 2017 all time high in Dec we started to move back to the channel bottom.we believe in yellow scenario that we need to touch the bottom and move along it for a while and then start another parabolic trend to the top of channel.
During the parabolic trend and correction that started from JAN,we made a Triangle Formation that have much similarities to Descending Triangle but this triangle don't have requirements for that pattern but usually this formations move in way of consolidation of trend that they are in it,so because of downward trend that we started from JAN we think this formation guide us to the bottom of the channel.
We think we are in middle of making another Impact to that triangle bottom.It is possible that we drop from this impact to the bottom of channel or making another waves and impacts to the triangle(red,orange arrows).
This Triangle aim to some place between $3800-5000.if this scenario go right we will move whie along of bottom line of the trend or bounce up after we touch that or close to it.this scenario contains of lowest price we can imagined for BTC.
we used elliott waves and fibo rules to make sure that it can occur in near future.in fibo retrace we will have 78.60% retrace in $4372 and touch the bottom of the channel.
Blue Scenario
This Scenario have a little chance to win.Our channel in this scenario started from the early points of parabolic bullish trend in late days of last july.It's usually impossible to make a channel in the middle of one wave and we need few points to reaching the bottom of this channel.$7800ish is the bottom of this channel now.
we made another triangle with this channel too.if this channel is our main channel we need to break the triangle to up and make our way to the roof and free of this triangle prison.
Like what i said in yellow scenario we can break this triangle to down side.this can make our yellow Scenario more real and have good chance to occur.
Red Scenario
This Scenario say that we are not in a long term channel from 2017 but we made a new upward channel from march after that horrible drop.we made another confimation after late $10000 touch and we are in way of bottom touch.
forgot to say that MACD and RSI both confirmed that we are in the way down.

Understanding the next wave. The future in fractals.Short term and long term prediction based on patterns and waves.
*This information is to be used for educational purposes only.*

OMG Buy ME!!Now lets talk about Omisego with Microsoft being one of the main sponsors at Consensus 2018 We can begin to see that Omisego has started to fire off the TTM Squeeze to the upside. on the 5 minute its break out already started. on the Teal triangle...the tip of the triangle is its possible trajectoryto the upside as it has started to form an ascending Chanel. we have a fractal on the tip demonstrated by the pink half circle on the chart and a higher low following the Chanel. Ichimoku already started to fire off Bull signals on the smaller time frames. currently testing the resistance at 1640 satoshi if its able to break past the 1640 satoshi mark my next level of interest is represented by the teal line at 1740 satoshi this is the bull run confirmation level as if its able to break past the resistance there is a big chance we will see the start of a nice run. Remember that Omisego is associated with some of the biggest names in technology today! OMG i am most definitely bullish.

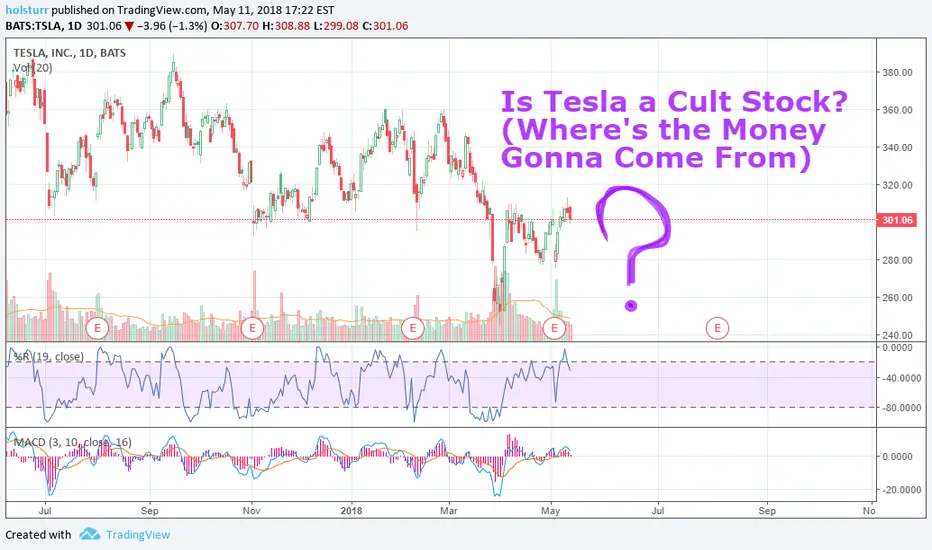
Is Tesla a Cult Stock? Big Longs, Big Shorts, and New Money. . .Tesla as a company inspires controversy today just as its namesake scientist did many years ago.
Is TSLA price supported by a cult-like following rallying around its futuristic visions and outspoken genius-billionaire Elon Musk?
More importantly, what stock price makes sense for Tesla? There's no good answer; but based on fundamental factors alone (missed earnings, hazy forecasting, uncertain production and sales, dispute over what sectors the company operates in and what exactly the company "is" and "does," and the conundrum that poses for risk and profitability assessment), Tesla should be trading at much lower prices. The shorts seem to think so, with short interest in the stock weighing in at almost one-third of the tradable float.
It's clear many believe Tesla price will fall as the company's visions don't come to fruition. A plummeting stock price would lead to a funding debacle for Tesla's varied projects.
The scientist Nikola Tesla was driven to madness and ruin as big money left his projects to wither. Without the nutrition of capital for funding his innovations, Nikola's breakthrough ideas fell by the wayside and his business endeavors crumbled.
Big money and big players conspired against Tesla the scientist and his gregarious futuristic ideals. Will Tesla the company suffer the same fate as Tesla the scientist?
A lot of money is betting against the company and the fundamentals don't make sense. Is Tesla price being propped by investors who believe in Musk's vision and the revolutionary implications of his technologies, who will HODL no matter what the company's stock does? The top handful of holders of Tesla stock own about 50% of the value of the company, including Musk himself. Musk recently agreed to a desirable pay package, so F.U.D. speculation that Elon was heading for the exits seems to be just that - F.U.D.
So we have a handful of believers HODL-ing half of Tesla stock, and big short interest - a third of the float - believing Tesla stock is headed down. Some analysts believe the stock will head higher, trigger a short squeeze, and catapult the stock price hundreds of dollars higher than it is now. Others believe Tesla's efforts span too much breadth across too many industries and the company will collapse, unable to raise money for its endeavors.
Will Tesla the company persevere with its groundbreaking innovations in technologies spanning several industries and areas of life, squeezing the shorts and bringing value to shareholders and consumers alike?
Or will Tesla the company go the way of Tesla the scientist, ostracized as the big money clears out, leaving big ideas to wither?
Only time will tell. Initiative\activist investing can only go so far, but if things go right, they might go very right, not only in a business sense, but in a futuristic sense as well.
Please like, follow, and share, and maybe we can have fun and do great things together.
Thanks again!
See it on the site: holsturr.com/category/markets/charts/
** For speculative and research purposes only - good luck! **
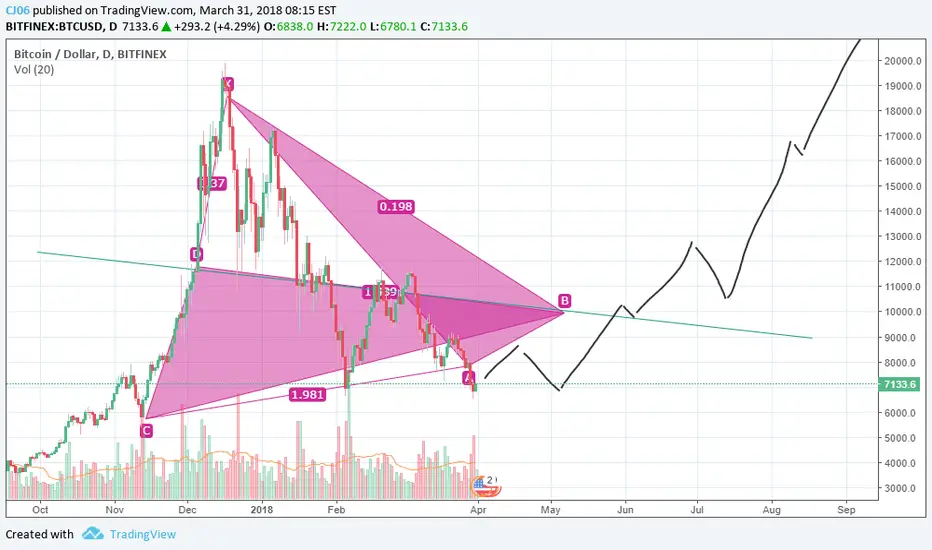
Bitcoin / USD Daily Coinbase Chart and where it's going...How and why I marked up this chart with drawing tools.
I started the first Fibonacci Speed Resistance Fan (FSRF) back to the lowest low I can scroll back to on 2015 January 14th when BTC was at $109.87. I ended the FSRF coordinates at the ATH on 2017 December 17th ($19,891.99). This makes for the lower angled FSRF rays on the chart. My up trending support line is green and around the green 50% fib level.
I began the Fibonacci Time Tool (FTT) {orange vertical lines numbered 0 - 5} at the ATH and ended the second coordinate at our most recent lowest low ($5,873.00) since after the all time high. What I notice about crypto is that time is reset after big and fast moves. Especially and mostly after a huge steep down move. New money can come in with low prices and the psycological factor of "getting in low" is continueing to give buyers confidence at recent prices.
The rocket upward movement has been re-set. Bitcoin has been re-fueling and ready to launch higher than ever. It's had enough time to cool off and let sellers take some profits. I can easily see BTC breaking the ATH this year and maybe soon!
Fibonacci SPEED AHEAD!
Every great idea is beaten to near death before manifestation!
This goat is going to fly in the sky <3
P.S. Is there an escape character sequence so that my use of "ATH" and "FTT" do not appear as tickers?

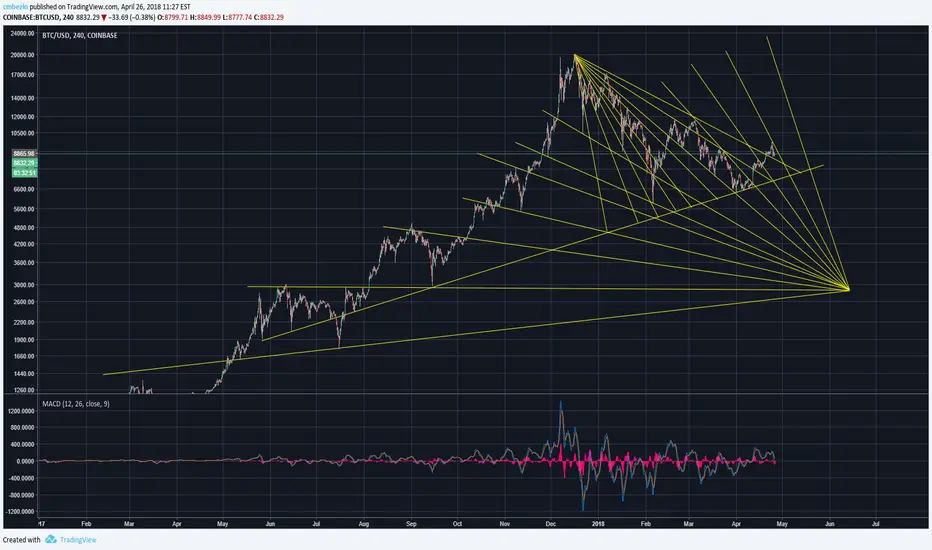
Converging trendline magnet forces, what is this?I got bored one night and started drawing major trendlines on the log chart and noticed that they all seemed to converge at certain locations. The most obvious is at the recent ~20k all time high, and the trendlines seem to fan out from that point. But then I noticed that there was an obvious trend in which the lines plotted all converge at a point around 3k, as if that point in the future is acting as a magnet for price action that is battling with the magnet from 20k.
Then I noticed that you can plot lines that lead back to bitcoin's inception (the "bottom" from the last couple of months is one of these) and price action seems to overtly follow those. Not sure what this means or if I'm looking way too much into this, but thought it was interesting none-the-less and figured maybe someone else could provide insight as to whether this is significant or not.
If there is legitimacy to this idea, if you just followed the obvious trendlines from the beginning of bitcoin and especially once we went parabolic just recently, it would have been obvious it converged at 20k and you would have had a good idea it was going to land there one day.
I noticed too that there are some trendlines in the price action from the last year that all converge around 60k in december of 2018
Is Bitcoin going to every die - probably not. In this video, I review some evidence available to everybody. I spot some behaviour patterns of Bitcoin over the years.
The evidence to date is that it refuses to die - at each stage when people shouted "Crash!" or "Tulip!".
I'm not saying that Bitcoin will not die. That's none of my business as a trader. My business is to assess evidence, see patterns and decide on probabilities.
I'm inviting all to look at the same evidence. Are we all seeing the same thing? Are we seeing broadly the pattern of fall back followed by shocking recovery?

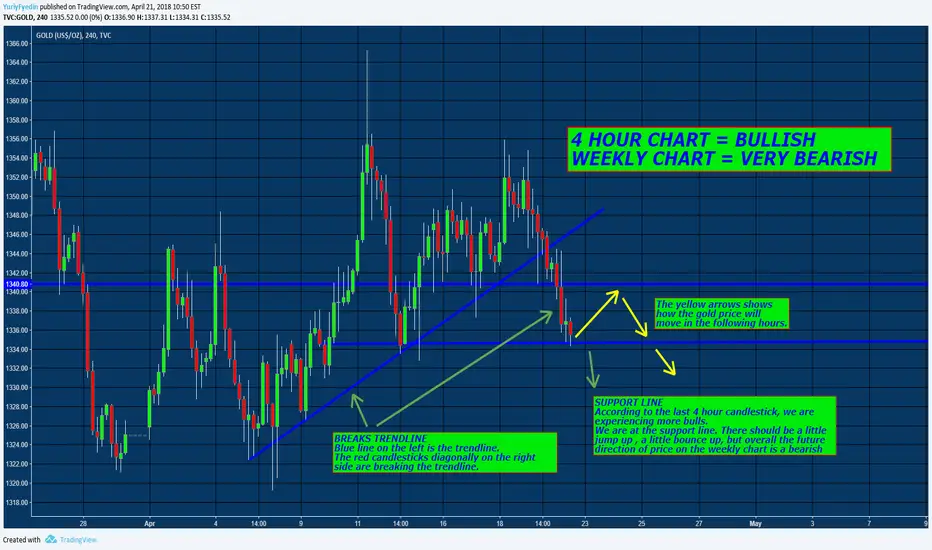
GOLD - 4 HOUR BULLISH - Weekly BearishOn the 4 hour chart, there should be a bounce up.
On the weekly chart, the price of gold should really go down.
A very possible futureUsing fibonacci we probably could see the sould of bitcoin and his near future


The only way to see future in cryptomarkets, analyzing BTCzaurusDon't try to predict crypto's with other market tools, just a tip.
I know it looks stupid, but you guys and lads don't have to take this too seriously, but we will talk in a short time and I guess you'll come back here and ask how the hell this happened.
BTC future price for 2018I compàre this bubble explosion with the earlier one of 2013 and we can see that during all 2014 we have had an important price decreasing for all over 2014. That's why I assume that in this case the behaviour of the BTC price would be similar. And that's all.
Bitcoin Forcast BTCStrap in for 1 more Bear run. Plant seeds below 6200. Then sell your house and wait.

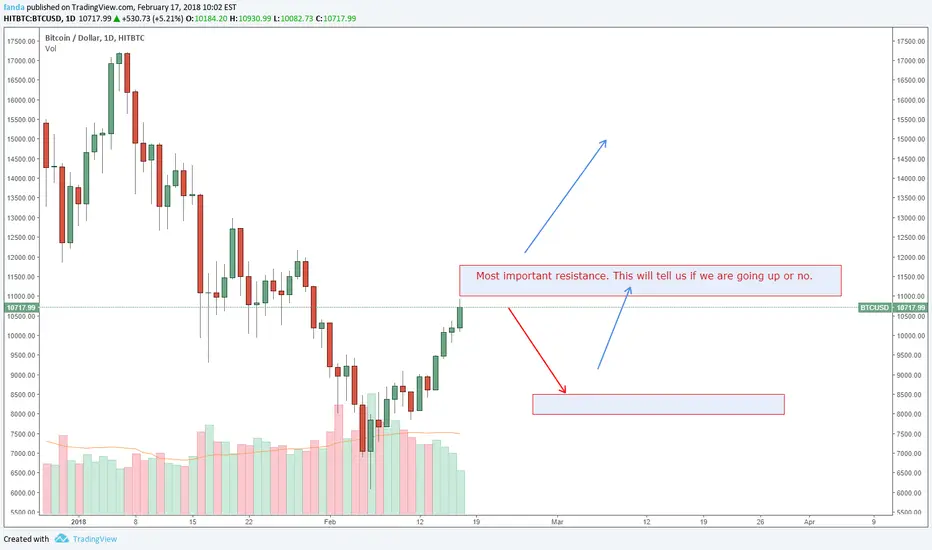
BTCUSD these days will decideWe have an important zone ahead.
We need to get throught it and break it. If we will get above it, we can expect further bull run. If not, we can expect price to fall atleast to drawn support. Then another try for breaking this zone.
Prediction is wrong.'Prediction' is a word commonly seen on Tradingview and other places. Quite often people go, " Nice prediction! " when price moves in favour of some setup that was previously shared - and delivers profits. This use of the word or concept of prediction is wrong for a number of logical reasons.
Not because I say that B will follow A, and B happens means I've predicted anything. I could also predict that the sun will rise in the East tomorrow or next year, but I doubt anybody would see value in that. I could 'predict' that if you drop an ordinary glass tumbler on a hard concrete-floor, that it would shatter. Nothing great in that either. Why? Because everybody knows about those situations. They know the probability in advance. In addition, 'value' is important in what people call prediction. Few are impressed by meaningless so-called 'predictions'.
There is phenomenon of 'adventitious reinforcement' that affects many traders (unknowingly). For more on that see Predictable Peckers and similar on the net. That's not just about pigeons. People too can come to believe that their actions 'predict' what happens next, and then they behave or act in certain ways. Any rewarding outcome can be associated with a previous action and developed into a pattern. So - in trading, the seeming correct prediction reinforces a belief that the outcome was due to something in the setup that brought success. These beliefs are almost never statistically analysed and in any case, traders are not interested - which is very sad.
I removed 'prediction' from my lexicon when trading. In my analyses, I focus on probabilities. Yes I use technical analysis and chart patterns. In other situations, I simply assess the trend for time momentum and price momentum , then estimate probabilities. I know that for any estimate I make which may be as low as 51% there is a reverse probability of 49%. If 60% then the reverse is 40% and so on.
There is no surprise or reinforcement when my entry position is successful and delivers rewards. I predicted nothing. All I did was get the probability right on those occasions.
Especially in trend-following trades the estimate of probable direction is particularly important. About 3 years ago I missed a trend following trade that was shown live because I couldn't believe how far it might go. That trade delivered a staggering 600 points. My question to the expert was, " How did you know it would go so far? " (as if he predicted it). I thought he knew the future. He just explained that he followed his strategy. But he didn't really answer the question. With more experience, I now know that he predicted nothing, for the simple reason that he was just following.
Trades with predefined targets create expectations and are more prone to leading traders to a belief that they can predict. The harsh reality is that nobody owns the future and can predict anything. All humans can do is estimate probabilities.

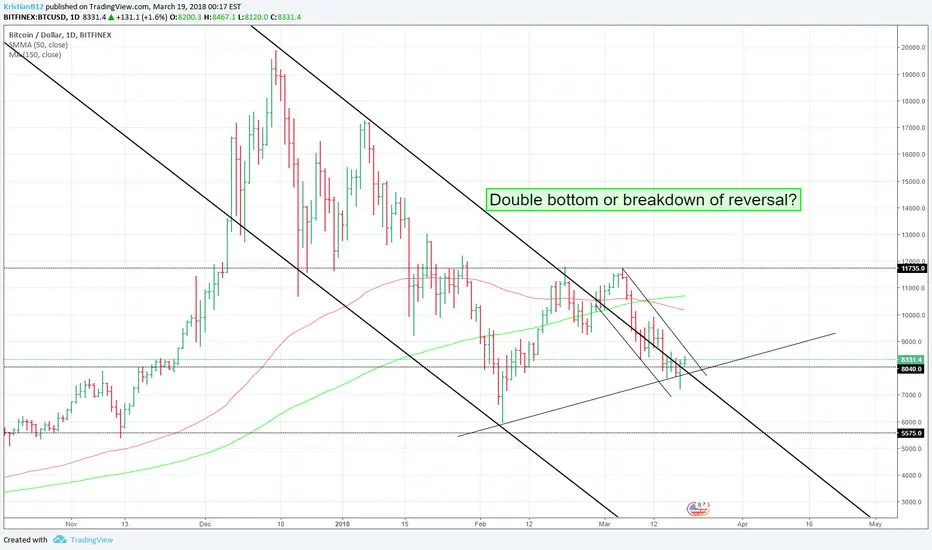
Critical point for BTCCrucial if BTC can find bottom here, if it does it could signal a wider uptrend, if it doesn't, it could break down back to around $6k.
Lemme know what you think,
-Kristian

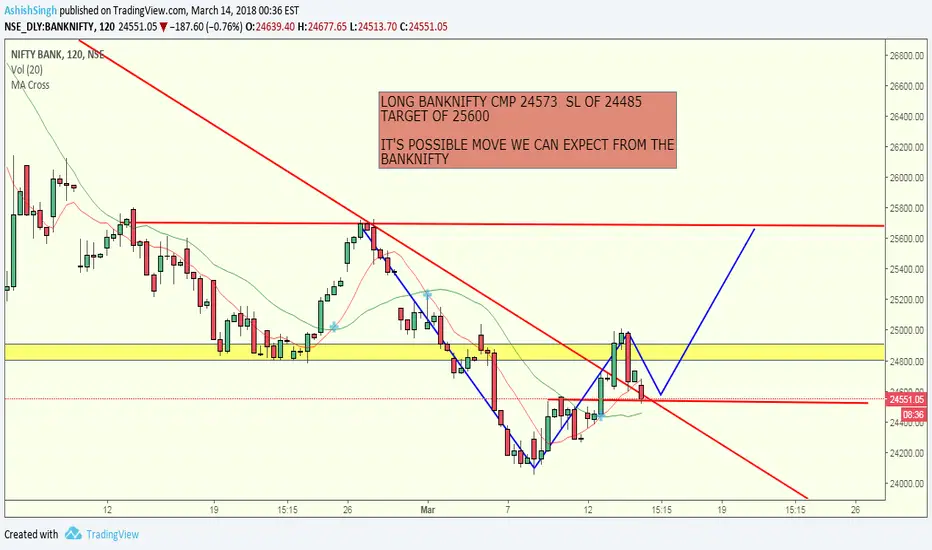
WILL YOU LONG BANK NIFTY THIS IS FOR YOU ???EVERYTHING ON THE CHART
JUST HAVE A LOOK
USE MY ANALYSIS FOR THE OVERALL VIEW OF THE MARKET
HAPPY TRADING!!!