DIYWallSt Trade Journal: Perfect Morning Signals & Rate Cut bets07/15/25 Trade Journal, and ES_F Stock Market analysis
EOD accountability report: +404.50
Sleep: 7 hours
Overall health: Good
VX Algo System Signals from (9:30am to 2pm)
— 8:41 AM Market Structure flipped bullish on VX Algo X3!
— 9:33 AM VXAlgo ES X1 Sell Signal (triple sell)
— 9:40 AM Market Structure flipped bearish on VX Algo X3!
— 1:20 PM VXAlgo ES X1 Buy signal (triple buy)
What’s are some news or takeaway from today? and What major news or event impacted the market today?
We got great signals at the start of the day and that really helped with today's trading. I had some meetings today and stufff to take care of so i decided to lock out the funded account around noon and called a day.
News
— 9:54 AM
*TRADERS STICK TO BETS ON SEPTEMBER FED RATE CUT AFTER INFLATION REPORT
What are the critical support levels to watch?
--> Above 6295= Bullish, Under 6285= Bearish
Video Recaps -->https://tradingview.sweetlogin.com/u/WallSt007/#published-charts
Futures

Mid-Session Market ReviewMid-Session Market Review
S&P 500: After some initial volatility from the 8:30 news, the market accepted above the prior day’s levels but has since pulled back within range, consolidating just below the highs.
NASDAQ: The NASDAQ remains above all of yesterday’s levels and is currently balancing between the high of the day and the 23,100 level, showing a rotational pattern.
Russell 2000: This market is rotational within the prior day’s range and has accepted below the CVA and PVA. Potential trade opportunities might come with a pullback to the 2,245 area.
Gold: Gold has accepted below the prior value area and is still rotational within the CVA. Trade opportunities could present themselves near the prior day’s low.
Crude Oil: The market is quite choppy, hovering around the prior day’s low and value area low. Caution is advised, with potential long opportunities on a pullback, as long as conditions align.
Euro Dollar: The Euro is dropping significantly, moving below all key levels without much respect for them. This could provide short opportunities if there’s a pullback.
Yen: Similar to the Euro, the Yen is also pushing below previous levels. It’s getting choppy near the CVA low, so caution is needed until it shows more respect for those levels.
Natural Gas: The market is rotational within the prior day’s range and respecting the CVA high. Long opportunities might be possible if conditions are right.
Aussie Dollar: It’s showing some respect for the CVA low and is still rotational. There could be a potential long setup forming, depending on how it plays out.
British Pound: The Pound has accepted below all key levels, and a pullback to the CVA low might provide short opportunities, though caution is needed around the VWAP.

GOLD again targets $3,371, new bullish cycle conditionToday (Tuesday, July 15), in the Asian market, the spot OANDA:XAUUSD maintained a slight recovery trend, currently at around 3,360 USD/ounce.
The spot OANDA:XAUUSD rose to a 3-week high on Monday, but quickly fell back and finally closed lower. Trump's open attitude towards trade negotiations has improved the market's risk-on sentiment and negatively impacted gold, a safe-haven asset. But gold still has a lot of potential risks for price increases, and personally, the fundamental trend for gold has not changed.
The US Bureau of Labor Statistics will release its June Consumer Price Index (CPI) report today (Tuesday).
According to a Reuters survey, economists expect the US CPI to increase year-on-year in June to 2.7% from 2.4% the previous month, while the core CPI is expected to increase year-on-year to 3% from 2.8%.
The survey also showed that the US CPI is expected to increase 0.3% month-on-month in June, and the core CPI is also expected to increase 0.3% month-on-month.
According to the Chicago Mercantile Exchange's "FedWatch Tool", the market believes that the Fed is unlikely to cut interest rates in July and the probability of keeping interest rates unchanged in September is about 30%.
If the US core CPI rises by 0.4% or more in June, this could prompt market participants to reassess the possibility of a rate cut in September. In this case, the US Dollar could hold steady and push gold prices lower. On the other hand, if the data is lower than expected, gold will become more attractive while a weaker Dollar will be positive for gold prices.
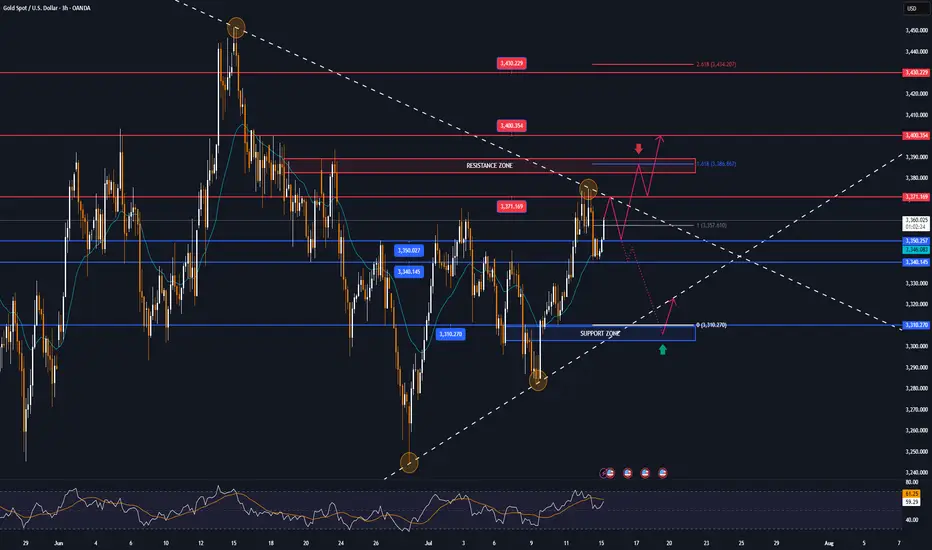
Technical Outlook Analysis OANDA:XAUUSD
After gold reached the resistance target of attention to readers in the weekly publication at 3,371 USD, which is the location of the 0.236% Fibonacci retracement, it fell slightly but is now recovering positively.
Currently, gold is trading in the range of 3,360 USD, the price action above the lower edge of the long-term rising price channel with support from the EMA21, gold is now likely to continue to retest the 0.236% Fibonacci retracement level.
If gold breaks above $3,371 it will be eligible for a new bullish cycle, with the target then being around $3,400 in the short term, more so than $3,430.
On the other hand, the RSI is pointing up, maintaining activity above 50, and this should be considered a positive signal in terms of momentum. It shows that there is still a lot of room for growth ahead.
However, as of now, gold is still neutral in terms of trend, with conditions gradually tilting towards the possibility of price increase.
Along with that, the notable positions will be listed as follows.
Support: $3,350 – $3,340 – $3,310
Resistance: $3,371 – $3,400 – $3,430
SELL XAUUSD PRICE 3390 - 3388⚡️
↠↠ Stop Loss 3394
→Take Profit 1 3382
↨
→Take Profit 2 3376
BUY XAUUSD PRICE 3304 - 3306⚡️
↠↠ Stop Loss 3300
→Take Profit 1 3312
↨
→Take Profit 2 3318
End-of-Session Market ReviewToday was a solid trading day with some interesting moves across the markets:
S&P 500: The market trended upwards from the open, gradually moving into and above the prior day’s value area, closing near the high of that range.
NASDAQ 100: After some initial back-and-forth, it climbed above the prior day’s high and value area, showing strength into the close.
Russell 2000: This market was quite choppy and balanced for a good part of the session, but eventually pushed up to close near the prior value area high.
Gold: It stayed range-bound, moving between the CVA high and the prior day’s value area without breaking out.
Crude Oil: We saw a significant drop right from the start, with prices falling about 1.5 points and ending the day lower, though still within the prior day’s range.
Euro Dollar: It tested the CVA low, dipped below the prior day’s low, and then bounced back to close around that level.
Yen Dollar: It started near the prior value area low, accepted below it by midday, and remained balanced in that lower range.
Aussie Dollar: Initially, it held above the CVA area and tested a higher level before sharply dropping below the prior day’s low and then balancing in that lower area.
In total, I took eight trades today. Two of them were in the Yen, both valid setups that didn’t work out and ended in stop-outs. I also took some long trades in the Aussie Dollar that I probably could have avoided since the market was choppy.
On the positive side, I managed risk well and ended up with two winning trades that put me in the green by about $1,200. Overall, I’d rate today as an A- day. Moving forward, I’ll focus on staying out of choppy markets, paying attention to the developing value area, and possibly using Heikin Ashi bars for better clarity.

Back above $3,300, GOLD may remain neutral, tax focusOANDA:XAUUSD reclaimed the psychologically important level of $3,300/ounce last week, but while gold is still receiving some support as a safe haven amid economic and geopolitical risks, its upside momentum may be limited as the market shifts its attention to other commodities.
Gold prices ended last week on a generally bullish note, rising back above $3,300 an ounce after US President Trump unexpectedly announced a series of new trade policies. Spot gold prices rose about 0.5% last week on Friday.
Although the market initially doubted Trump’s self-imposed July 9 deadline, the overall market reaction remained steady and the renewed risk appetite helped the S&P 500 hit a new record high, somewhat undermining gold’s safe-haven appeal. The July deadline has been pushed back to August 1, but the global trade conflict is far from over. Gold has regained support after initial pressure after Trump announced a new trade policy on copper imports, along with a series of news stories about the relationship between Trump and the FED sent to readers throughout the past week.
A sharp rise in copper prices will also add to inflationary pressures, exacerbate economic uncertainty and raise concerns about recession and stagflation. In this context, gold is expected to continue to receive support from potential risks.
In addition to fierce competition in the commodity market, gold may remain fundamentally neutral in the short term, as economic data will support the Fed's neutral monetary policy. The key market focus next week will be the June Consumer Price Index (CPI). The Fed has made it clear that it is in no rush to raise interest rates while inflation risks remain high.
However, traders still need to be cautious and closely monitor the situation surrounding the tariff war initiated by Trump, which will directly affect the price of gold. In case of negative news, the gold price will receive support and vice versa if positive news appears in the market.
Over the weekend, US President Trump once again used the tariff tactic, announcing that he would impose a 30% tax on imports from the EU and Mexico, causing a strong reaction from the international community. This move not only casts a shadow over the relationship between Europe and the United States, as well as between the United States and Mexico, but also adds further uncertainty to the global trade model. EU politicians, businesses and academics were quick to respond, calling for unity to protect their interests, while Mexico stressed the need to maintain national sovereignty and pledged to respond calmly.
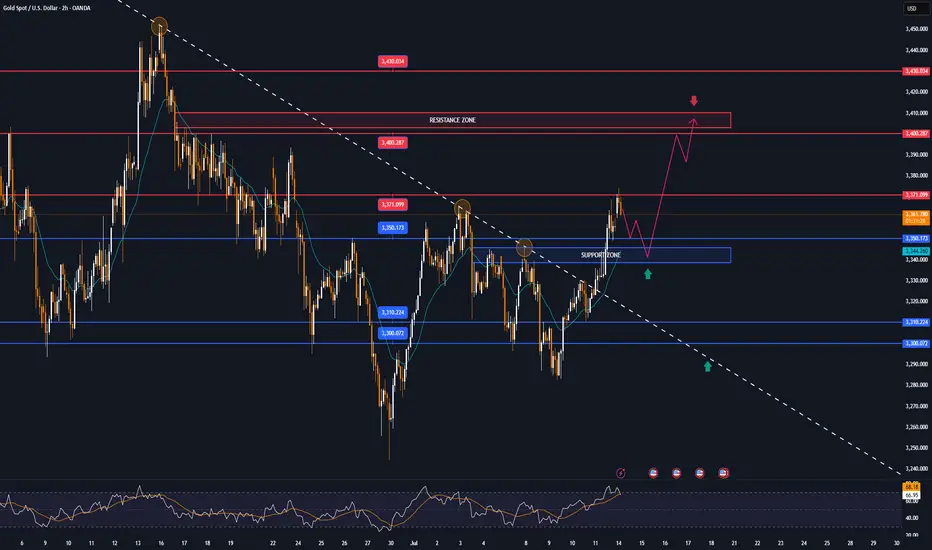
Technical Outlook Analysis OANDA:XAUUSD
On the daily chart, gold has a 3-day rally, and the upside momentum has reached the important target resistance at the 0.236% Fibonacci retracement level. Gold's upside momentum is also limited by this Fibonacci retracement level, specifically it has slightly dropped to $3,355/oz.
But overall, gold is still not in a position to form a specific trend, and the indicators and positions are mainly showing the possibility of continuing to accumulate sideways.
For gold to have the conditions for a new bullish cycle, it needs to bring price activity above the 0.236% Fibonacci retracement level, then the target will be around $3,400 in the short term, more than $3,430.
Meanwhile, a pullback, which sees gold sell below the 0.382% Fibonacci retracement, would open the door to a bearish cycle, with a target of around $3,246 in the short term, rather than the 0.50% Fibonacci retracement.
RSI hovering around 50 also suggests a hesitant market sentiment, so the short-term bias for gold is neutral.
Along with that, notable positions will also be listed as follows.
Support: $3,350 – $3,310 – $3,300
Resistance: $3,371 – $3,400 – $3,430
SELL XAUUSD PRICE 3406 - 3404⚡️
↠↠ Stop Loss 3410
→Take Profit 1 3398
↨
→Take Profit 2 3392
BUY XAUUSD PRICE 3340 - 3342⚡️
↠↠ Stop Loss 3336
→Take Profit 1 3348
↨
→Take Profit 2 3354
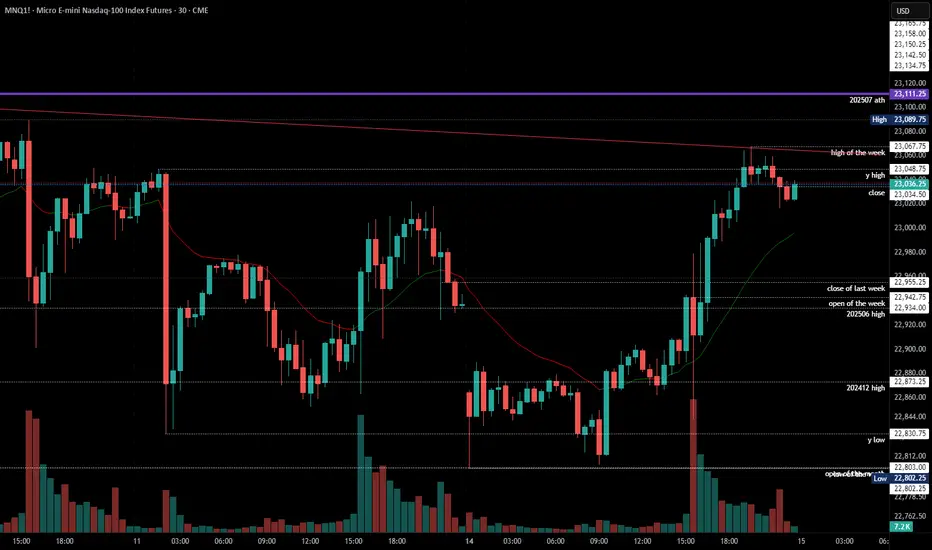
2025-07-14 - priceactiontds - daily update - nasdaqGood Evening and I hope you are well.
nasdaq e-mini futures
comment:
The biggest surprise for next week would be a huge gap down Sunday futures open and having that gap stay open. If bears could actually do something like that and trap all bulls who bought above 22600, that would be amazing.
Spoiler: Bears could not. Another gap down and bear trap. It’s sad but the reality. Don’t expect strong bears all of the sudden.
current market cycle: bull trend
key levels: 22000 - 23100
bull case: Bulls defended 22800 which is still as bullish as it gets. Don’t make it more complicated than it is. We are going sideways under the ath, can print a new one any given day. Since I don’t have any targets above 23100ish, I won’t make stuff up here. I only wait for the profit taking to begin to look for shorts.
Invalidation is below 22700.
bear case: Bears are sad. Need a daily close below 22700. If they prevent bulls from printing a new ath above 23111, I would be surprised. No need to write more here until we see much much bigger selling pressure.
Invalidation is above 23500.
short term: Neutral. Bears not doing enough and bulls going sideways under ath. No interest in buying, so I am neutral until big bears come around.
medium-long term - Update from 2024-06-29: No change in plans. I expect 20000 to get hit over the next 3 months and maybe 19000 again.
trade of the day: Long the double bottom above 22800 or the retest on US open around 22830. Bears failed to print consecutive good looking 30m/1h bear bars, so a reversal was the most likely outcome after the double bottom.
Mid-Session Market InsightsMid-Session Market Insights
In today's session, I'm closely monitoring eight different futures markets: S&P 500, NASDAQ 100, Russell 2000, Gold, Crude Oil, Euro Dollar, Yen Dollar, and Aussie Dollar.
S&P 500: We're seeing a rotational pattern within the prior day's value area and the CVA. I'm eyeing long opportunities from the prior value area low up to the high.
NASDAQ 100: The market is a bit choppy around the PVA and CVA highs, with a slight upward intraday trend. I'm staying cautious here.
Russell 2000: Also choppy, but we've got acceptance within the CVA. I'm looking for long opportunities from the CVA low, which aligns with the prior day's low.
Euro Dollar: I'm currently short from the CVA high, with the first target at the prior day's low. We've broken below the prior value area, so I'll trail this trade and see how it develops.
Yen Dollar: It’s been a bit of a mixed bag. I took a short below the CVA and prior day's low, got stopped out, but it was still a decent setup.
Aussie Dollar: I took some long positions that weren't the best setups, as it was quite choppy near the CVA high and prior day's low. Lesson learned for next time.
Crude Oil: I took a short from the CVA and PVA highs, hit my target at the low of those areas, and we’re currently hovering around that level.

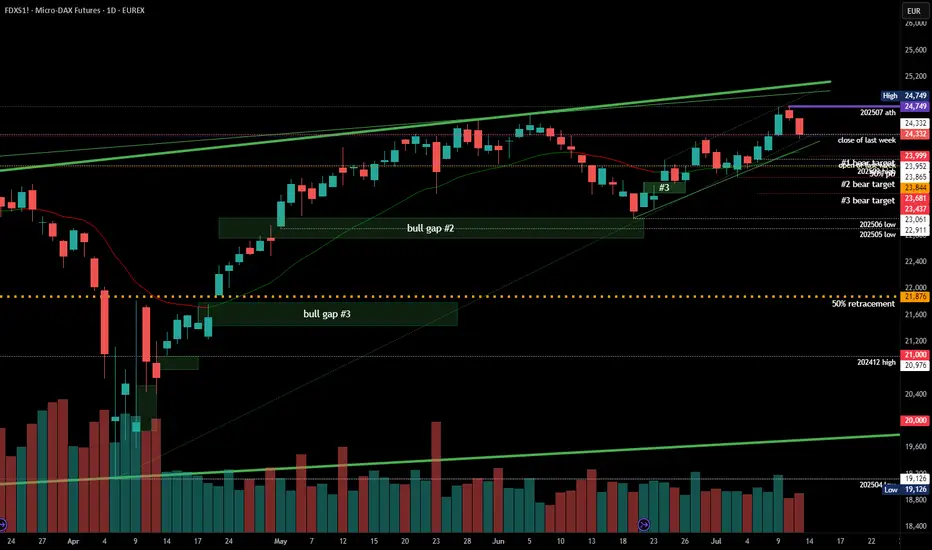
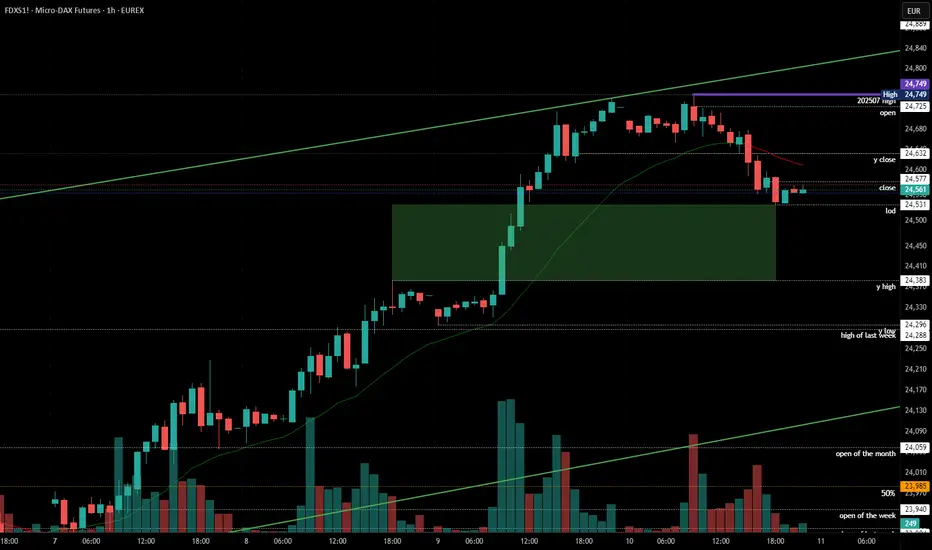
#202528 - priceactiontds - weekly update - daxGood Evening and I hope you are well.
comment: Third leg up is done and now it’s all about how long do we need for a lower low below 23680 again. For now I don’t know since we have another risk-off news but of them were bought the past 3 months, so I remain skeptical. Too early for shorts but I think longs near 24000 are likely good for a bounce to either retest 24749 or print a lower high.
current market cycle: bull wedge
key levels for next week: 23000 - 24800
bull case: Bulls want to continue sideways to up and trap all eager bears again who think that 30% tariffs between the US-EU are bad. Those poor souls. Markets can only go up.
Invalidation is below 23680
bear case: Bears need a lower low below 23680. That’s all there is to it. No idea how fast and if we get there but shorts before are most likely a gamble, since literally every dip since April has been bought and especially every Sunday Globex gap down became a giant trap. I do think 24749 is a perfect double top with the prior ath from June and we can go down from here but until we have a daily close below 23680, I am not eager to run into another bear trap.
Invalidation is above 24749
short term: Neutral. Tariff news are bad but they are not in-effect, so could be that we see another bear trap. I don’t know and I won’t pretend otherwise. Sitting on hands.
medium-long term from 2025-06-29: Bull surprise last week but my targets for the second half of 2025 remain the same. I still expect at least 21000 to get hit again this year. As of now, bulls are favored until we drop below 23000.
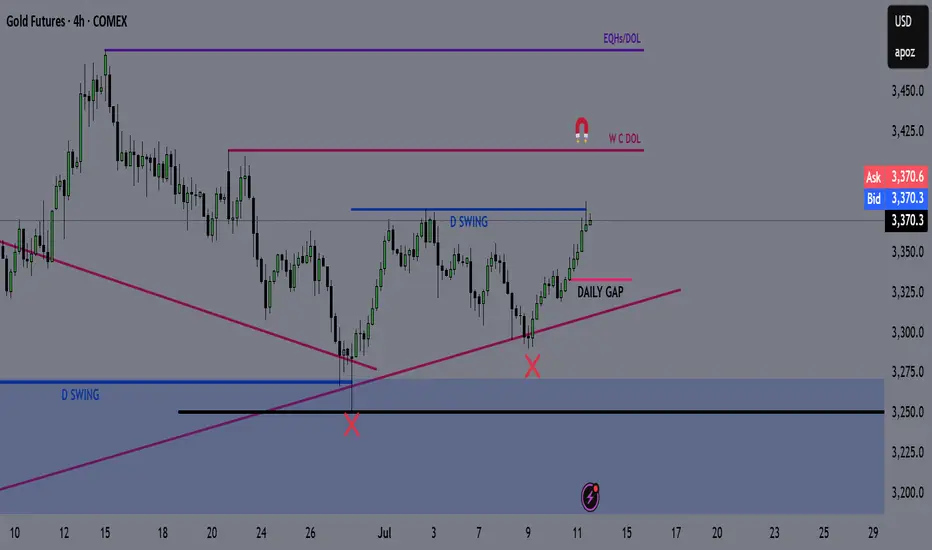
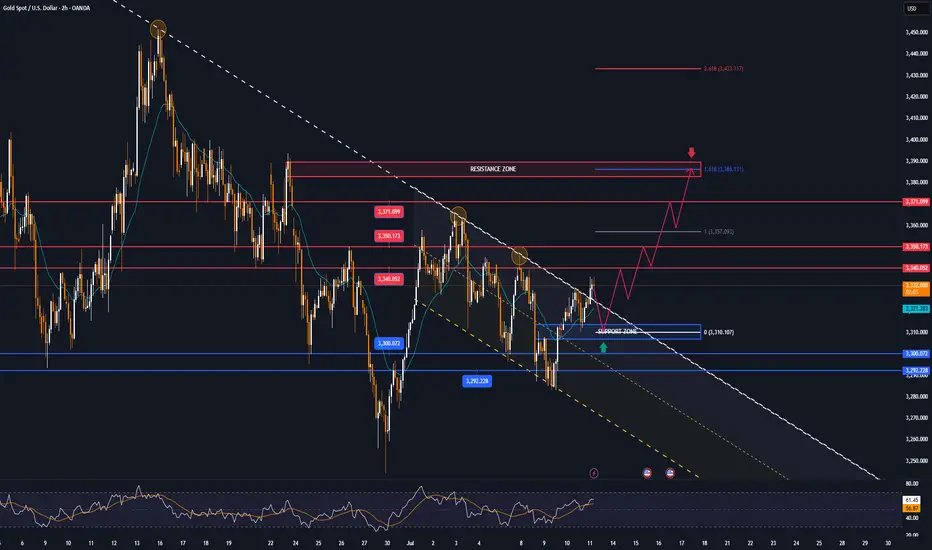
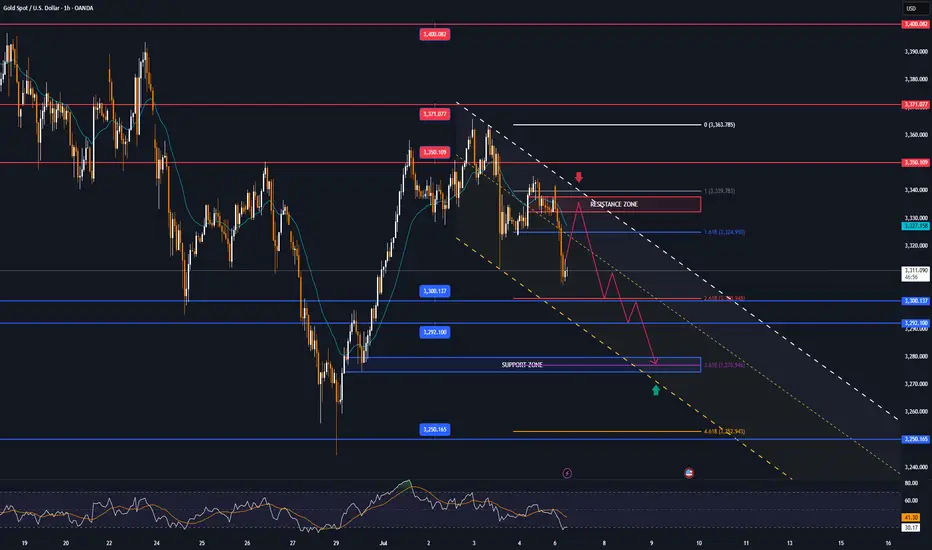
GOLD - GC | Weekly Recap & Plan 13.07.2025🟡 GOLD (GC) Weekly Recap & Outlook
Symbol: GC1!
Date: Week of July 8–12, 2025
Timeframes Used: 4H, Daily, Weekly, HTF structure
🔍 What Happened Last Week?
Gold saw a strong rejection from a confluence of two HTF trendlines, signaling resistance.
But that move was absorbed by:
🟦 Daily Demand (blue zone)
🔵 Daily Swing Liquidity (blue line)
This builds a bullish structure on the daily chart.
🧭 Scenarios I'm Watching
Scenario 1 — Minor Pullback:
🔹 Price may revisit the Daily Gap (pink line) and find support for continuation.
Scenario 2 — Deeper Pullback:
🟣 Price could retrace into the HTF bullish trendline (purple) before resuming upside.
🗞️ Bonus Macro Scenario: Powell Resignation?
There are growing rumors that Fed Chair Powell might resign this week.
📈 If that happens, I expect strong bullish momentum in Gold —
→ very limited retracement, and
→ potential straight breakout into new highs.
🎯 Targets for the Week:
✅ 1st Target:
W C DOL (purple line) → acts as a primary take profit area.
✅ 2nd Target (Expansion):
EQHs / DOL (extended purple levels)
Game Plan:
Watch for LTF confirmation on both retracement zones.
Maintain bullish bias unless Daily Demand fails.
If Powell resigns, be ready for breakout setups.
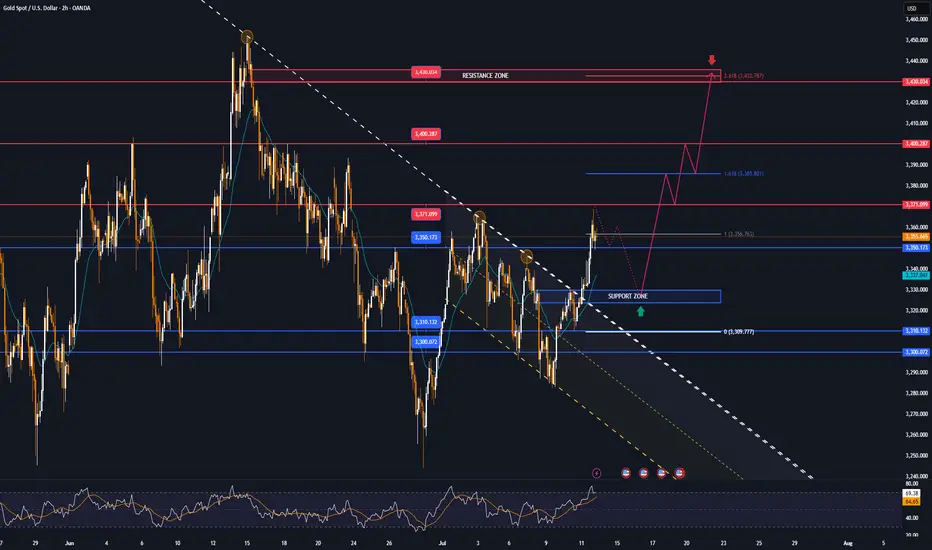
GOLD MARKET ANALYSIS AND COMMENTARY - [Jul 14 - Jul 18]This week, OANDA:XAUUSD opened at $3,342/oz, dropped to $3,282/oz, but then rebounded sharply to close at $3,355/oz. The recovery was mainly driven by former President Trump's announcement of new tariffs ranging from 20% to 50% on imports from 22 countries, effective August 1st. Particularly, a 35% tariff on Canadian goods — a key U.S. trading partner — raised concerns about global trade stability and supply chains.
Trump also proposed 15–20% tariffs on most other trading partners, reigniting fears of global trade disruptions. At the same time, ongoing conflict between Israel and Hamas continued to weigh on sentiment, despite U.S. diplomatic efforts showing little progress.
However, analysts note that gold still lacks strong momentum for a breakout. Trump's tariff threats may be more about negotiation leverage than triggering a full-blown trade war. Meanwhile, with the labor market recovering and inflation rising, the Fed is expected to maintain its neutral monetary policy, limiting short-term gold price movements.
Although geopolitical tensions remain (e.g., Russia-Ukraine, Israel-Hamas), the ceasefire between Israel and Iran has reduced gold’s geopolitical risk premium.
Looking ahead, key U.S. economic data next week — including CPI, PPI, and retail sales — will be closely watched. A strong June core CPI (0.4% or higher) could reduce the likelihood of a Fed rate cut in September, strengthening the USD and pushing gold lower. Conversely, weaker inflation data could boost expectations of a rate cut, supporting gold prices.
📌In terms of technical analysis, gold prices next week may continue to adjust and accumulate. Accordingly, if they surpass the 3,370 USD/oz mark, gold prices next week will challenge the 3,400-3,450 USD/oz range. On the contrary, gold prices next week will adjust down to 3,285 USD/oz, or even 3,245 USD/oz.
Notable technical levels are listed below.
Support: 3,350 – 3,310 – 3,300USD
Resistance: 3,371 – 3,400 – 3,430USD
SELL XAUUSD PRICE 3435 - 3433⚡️
↠↠ Stop Loss 3439
BUY XAUUSD PRICE 3329 - 3331⚡️
↠↠ Stop Loss 3326
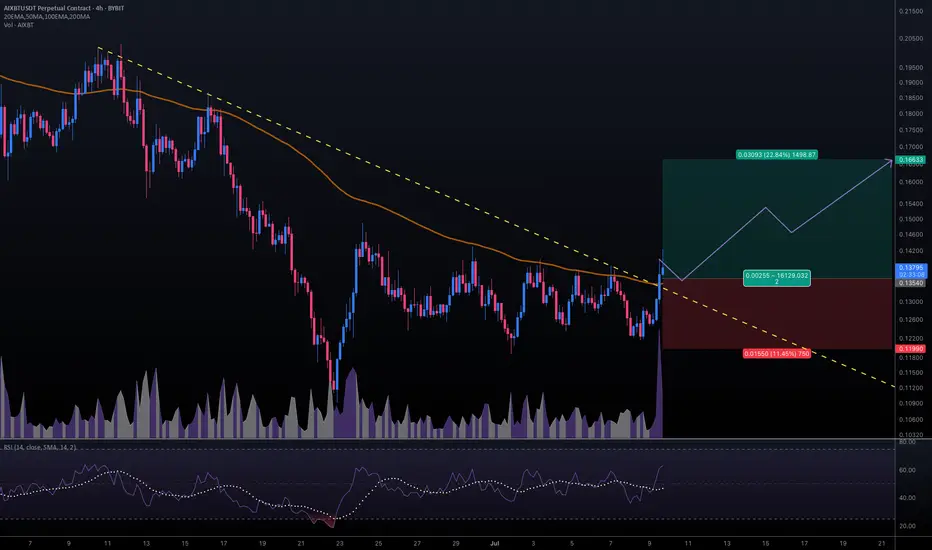
#AIXBTUSDT #4h (ByBit) Descending trendline breakout$AIXBT just regained 100EMA support and looks ready for short-term recovery.
BYBIT:AIXBTUSDT.P aixbt.tech
GOLD continues to recover, tariff war changes unpredictablyInternational OANDA:XAUUSD continued to rise, boosted by a slight decline in the US Dollar and US Treasury yields. At the same time, investors are closely monitoring the developments in trade negotiations as US President Trump expands the tariff war.
As of the time of writing, spot OANDA:XAUUSD increased by 0.3% to 3,333 USD/oz. The general weakness of the US Dollar, the decline in US Treasury yields and renewed concerns about the escalation of the trade war have helped stabilize gold prices.
On Thursday evening (July 10) local time, US President Donald Trump once again increased pressure on trading partners. He announced that he would impose a 35% tariff on imported goods from Canada, and the USD/CAD exchange rate rose sharply in the short term.
Trump posted on his social media platform Truth Social that a 35% tariff would be imposed on imported goods from Canada, effective from August 1, 2025.
It is still unclear whether the current exemptions for goods traded under the United States-Mexico-Canada Agreement (USMCA) will be extended or terminated.
Due to the impact of escalating trade tensions, spot gold prices also rose by more than 10 dollars in the short term at the beginning of the Asian trading session on Friday, and the current high price of gold has reached around 3,336 USD/ounce.
In an interview with NBC News on Thursday, Trump said he was also considering imposing a flat tariff of 15% to 20% on most of his trading partners, adding that the exact tariff rate was being worked out. The current flat tariff rate is 10%.
Trump sent letters to trading partners this week, announcing that the new tariffs would take effect on August 1 if they could not negotiate more favorable terms. He is expected to send letters to European Union member states soon.
Trump sent the first batch of tariff letters to 14 countries, including Japan and South Korea, on July 7, with tariffs ranging from 25% to 40%. He also said he would send more similar letters this week.
Minutes from the Fed's June 17-18 meeting showed that only a "few" Fed officials thought a rate cut was possible as early as this month, while most preferred to hold off until later in the year due to inflation concerns caused by Trump's tariffs.
The Federal Open Market Committee (FOMC) voted unanimously to leave interest rates unchanged at its June meeting. The next policy meeting is scheduled for July 29-30.
Markets will focus on progress in Trump's tariff negotiations, key US economic data and speeches by Federal Reserve officials later in the day for fresh trading direction for gold prices.
Technical Outlook Analysis OANDA:XAUUSD
Gold has had 2 sessions of recovery from the area around the 0.382% Fibonacci retracement, but the temporary upside momentum is still limited and does not qualify for a new bullish cycle.
In the short term, the EMA21 with the 0.236% Fibonacci retracement will act as the nearest resistance, if gold takes the price action to break above the 0.236% Fibonacci retracement level it will qualify for a new bullish cycle with the target then being around $3,400 in the short term, more so than $3,430.
On the other hand, with the current neutral trend, once gold is sold below the 0.382% Fibonacci retracement level again, it will have conditions to decline, and the target then is around 3,246 USD in the short term, more than the 0.50% Fibonacci retracement level.
The RSI index is hovering around 50, also showing that the market sentiment is still hesitant to have a specific direction.
During the day, the sideways trend of gold prices will be noticed by the following positions.
Support: 3,300 - 3,292 USD
Resistance: 3,340 - 3,350 - 3,371 USD
SELL XAUUSD PRICE 3388 - 3386⚡️
↠↠ Stop Loss 3392
→Take Profit 1 3380
↨
→Take Profit 2 3372
BUY XAUUSD PRICE 3296 - 3298⚡️
↠↠ Stop Loss 3292
→Take Profit 1 3304
↨
→Take Profit 2 3310
2025-07-10 - priceactiontds - daily update - dax
Good Evening and I hope you are well.
comment: 50% retracement of the last bull leg is pretty much exactly 24530 and low of the day was 24531. Could always be a coincidence eh. Bull gap still open to 24383, so do not look for shorts. I doubt we will go red into the weekend unless we get bad news. Technically we could pull back to the bull trend line 24200ish but I can not, for the life of me, see that happening tomorrow.
current market cycle: trading range - bull trend on the 1h tf
key levels: 24300 - 25000
bull case: Bulls want 25000 now. They are correcting sideways, which is as bullish as it gets. Even if bears close the gap to 24383, I would still expect another push for 24700+ with at least a lower high. Bulls remain in full control.
Invalidation is below 24270.
bear case: Bears likely not doing much but rather bulls taking profits. It was a slow grind lower on low volume. I would not expect follow-through selling tomorrow. Bears still have nothing until we see lower lows again.
Invalidation is above 25100.
short term: Neutral. Bulls remain in control but the spike phase is over and we are trading below the 1h ema, which means the trend is getting weaker. We could pull back further or stop at the 50% retracement and leave the gap open. No bigger interest in guessing what it’s gonna be, so I sit on hands.
medium-long term from 2025-06-29: Bull surprise last week but my targets for the second half of 2025 remain the same. I still expect at least 21000 to get hit again this year. As of now, bulls are favored until we drop below 23000
trade of the day: Tough to short this and hold tbh. Not really obvious today, so no trade of the day from me.
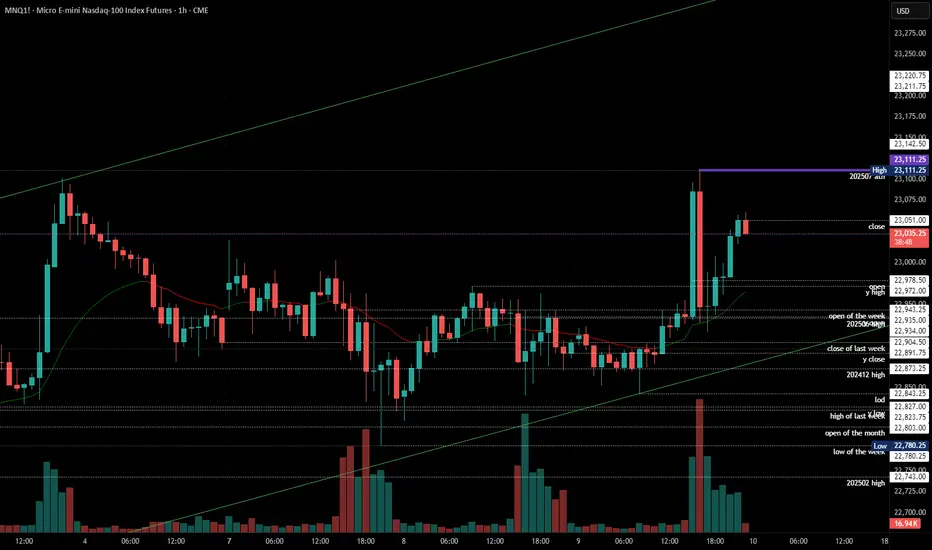
2025-07-09 - priceactiontds - daily update - nasdaqGood Evening and I hope you are well.
comment: Bears just need to do more. As long as we are not leaving behind bear gaps, bulls keep buying the dips. Wait for long pullbacks if we keep making higher lows. The bull channel is also still valid.
current market cycle: bull trend
key levels: 22700 - 23300
bull case: As long as Bulls stay comfortably above 22500, they are fine and sideways is a very bullish correction for them. Bears are certainly not doing much, so bulls buy every dip. Nothing changed. Might go up to 23300 or higher. No one knows where it will end but it’s likely orange face will end it and he will make sure he announces it in his private Epstein-and-Friends signal group in advance. Some put options 3-6m are fine to buy I think.
Invalidation is below 22700.
bear case: Bears are just not doing enough. Need something below 22700 and most likely an event to be the catalyst for it. I will leave it at that.
Invalidation is above 23500.
short term: Neutral until US-EU tariff shit show get’s a nice tweet or so. We will go down hard again. Be patient.
medium-long term - Update from 2024-06-29: No change in plans. I expect 20000 to get hit over the next 3 months and maybe 19000 again.
trade of the day: Long US open was a bit obvious but buying the huge drop was not.
How to Spot Flag Patterns on TradingViewLearn to identify and trade flag patterns in TradingView with this step-by-step tutorial from Optimus Futures. Flag patterns are continuation formations that help traders join existing trends by buying high and selling higher, or selling low and buying back lower.
What You'll Learn:
• How to identify bullish and bearish flag patterns on any timeframe
• Breaking down flag patterns into two parts: the flagpole and the flag
• Finding strong flagpole formations with fast, obvious price moves
• Spotting flag consolidation areas that form tight ranges
• Why flag patterns work: buyer and seller psychology explained
• Real chart examples showing how flag patterns develop and play out
This tutorial may help futures traders and technical analysts who want to trade with market trends rather than against them. The concepts covered could assist you in identifying opportunities to join strong price movements when they pause before continuing.
Learn more about futures trading with Tradingview: optimusfutures.com
Disclaimer:
There is a substantial risk of loss in futures trading. Past performance is not indicative of future results. Please trade only with risk capital. We are not responsible for any third-party links, comments, or content shared on TradingView. Any opinions, links, or messages posted by users on TradingView do not represent our views or recommendations. Please exercise your own judgment and due diligence when engaging with any external content or user commentary.
This video represents the opinion of Optimus Futures and is intended for educational purposes only. Chart interpretations are presented solely to illustrate objective technical concepts and should not be viewed as predictive of future market behavior. In our opinion, charts are analytical tools—not forecasting instruments. Market conditions are constantly evolving, and all trading decisions should be made independently, with careful consideration of individual risk tolerance and financial objectives.

Quick take o sugar futuresThe technical picture is starting to look quite interesting. Let's see if seasonality will kick in as well. Let's dig in.
MARKETSCOM:SUGAR
ICEUS:SB1!
Let us know what you think in the comments below.
Thank you.
75.2% of retail investor accounts lose money when trading CFDs with this provider. You should consider whether you understand how CFDs work and whether you can afford to take the high risk of losing your money. Past performance is not necessarily indicative of future results. The value of investments may fall as well as rise and the investor may not get back the amount initially invested. This content is not intended for nor applicable to residents of the UK. Cryptocurrency CFDs and spread bets are restricted in the UK for all retail clients.

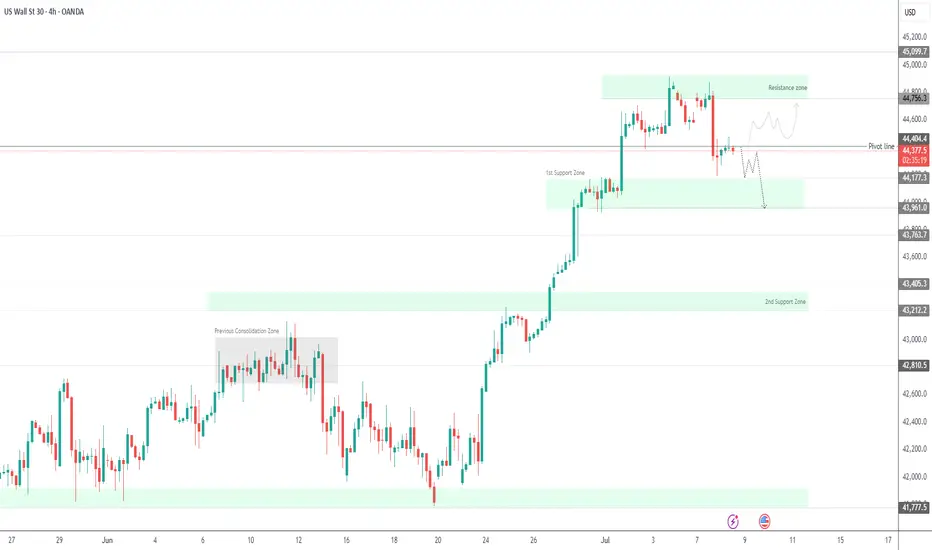
Dow Jones Below Key Pivot – Tariff Talks to Define Next MoveDow Jones – Overview
Fundamental Outlook:
In April, President Trump capped all so-called reciprocal tariffs at 10% until July 9, giving room for trade negotiations with key partners. That same month, the Nasdaq slipped into bear market territory, while the Dow and S&P 500 entered correction zones.
Since then, Wall Street has rebounded sharply. Last week, both the Nasdaq and S&P 500 surged to all-time highs, driven by a strong labor market that helped ease recession fears.
Technical Outlook:
Currently, Dow Jones is trading below the pivot level at 44410, which signals ongoing bearish momentum.
A sustained move below 44410 supports further downside toward 44180, with a break below this level opening the path to 43960.
However, if price reverses and closes above 44410 on the 1H or 4H timeframe, it may trigger a bullish move targeting 44750 and beyond.
Support: 44180 / 43960 / 43770
Resistance: 44515 / 44750 / 45100
Note:
Progress in tariff negotiations would likely support further upside in U.S. indices.
Lack of resolution may keep the Dow under bearish pressure in the short term.
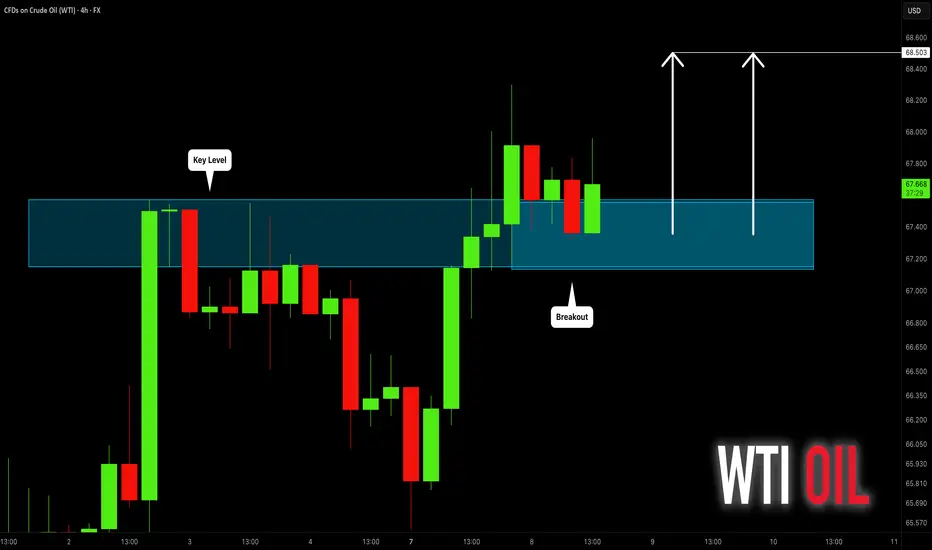
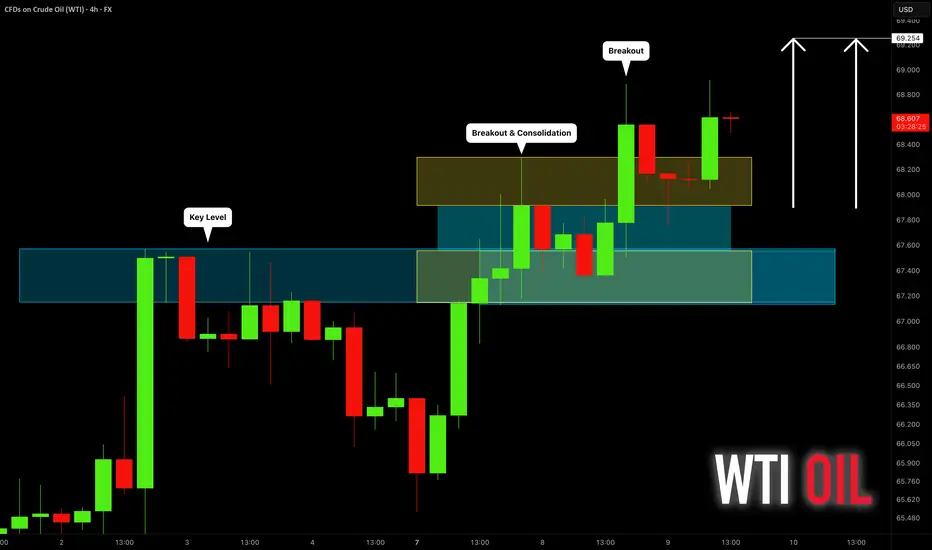
CRUDE OIL (WTI): Will It Rise More?
Quick update for my yesterday's analysis for WTI Crude Oil.
As I predicted yesterday, the price went up to the target.
We got one more strong bullish confirmation after a New York
session opening:
the price violated a resistance of a horizontal range on a 4H time frame.
I think that the market may rise even more and reach 69.25 level.
❤️Please, support my work with like, thank you!❤️
GOLD is in bearish conditions, pressured by aggressive tariffsOn Wednesday (July 9) in the Asian market, the spot OANDA:XAUUSD suddenly fell sharply in the short term, and the gold price just fell below 3,290 USD / ounce.
Although US President Trump announced that the first tariff letters had been sent to some US trading partners, the gold price fell below 3,290 USD / ounce due to the weakening demand for safe-haven gold. Trump postponed the tariff deadline to August 1, easing trade tensions.
The recovery in the dollar TVC:DXY and rising US Treasury yields also weighed on gold, sending prices sharply lower after hitting a high of $3,345 an ounce.
The yield on the 10-year US Treasury note TVC:US10Y rose to its highest in more than two weeks, making gold, which does not pay interest, less attractive as an investment.
The yield on the 10-year US Treasury note rose to 4.415%. The US real yield also rose 4 basis points to 2.073%.
TVC:DXY , which tracks the greenback's performance against a basket of currencies, rose 0.20% to 97.70. The rise in the Dollar Index means that gold priced in dollars has become less attractive because they are inversely correlated.
Japan and South Korea said on Tuesday they would try to speed up trade talks with the United States in a bid to soften President Donald Trump's stance on new tariffs set to take effect on August 1.
But optimism about a trade deal boosted market risk appetite, limiting gold's upside.
Traders are awaiting the release of the minutes of the Federal Reserve's latest meeting on Wednesday, followed by data on initial jobless claims for the week ended July 5.
Investors now expect the Fed to cut interest rates by 50 basis points before the end of the year, starting in October.
Technical Outlook Analysis OANDA:XAUUSD
On the daily chart, gold fell below the 3,300USD whole price point and the 0.382% Fibonacci retracement level, which are the initial conditions for gold prices to have a prospect for a bearish trend.
Currently, with the position below 3,300USD, gold may continue to decline with the next target around 3,246USD in the short term, more than the 0.50% Fibonacci retracement level.
The current resistances of gold prices are the pressure from the EMA21 line, followed by the 0.236% Fibonacci retracement. These are also the resistance positions that readers paid attention to in the previous issue.
In addition, the RSI is pointing down from 50, currently 50 is considered the nearest resistance and the fact that the RSI is pointing down is quite far from the oversold zone, indicating that there is still room for a decline ahead.
During the day, although the trend is not yet completely clear, gold is showing conditions that are more inclined towards a decline, along with that, the notable positions will be listed as follows.
Support: 3,292 - 3,246 USD
Resistance: 3,300 - 3,340 - 3,350 USD
SELL XAUUSD PRICE 3346 - 3344⚡️
↠↠ Stop Loss 3350
→Take Profit 1 3338
↨
→Take Profit 2 3332
BUY XAUUSD PRICE 3245 - 3247⚡️
↠↠ Stop Loss 3241
→Take Profit 1 3253
↨
→Take Profit 2 3259
Trump "stirred up" GOLD recovery but limited by USD appreciationSpot CAPITALCOM:GOLD has rebounded strongly from yesterday's lows, currently trading around $3,333/oz. The main reason is that US President Trump announced a 25% tariff on Japan and South Korea starting August 1, which boosted safe-haven demand. However, the strengthening US Dollar has also limited the broader recovery in gold prices.
On Monday local time, US President Trump sent letters to 14 countries including Japan, South Korea and South Africa threatening to impose tariffs. He then signed an executive order to extend the suspension of "reciprocal tariffs" until August 1.
Trump announced that he would impose a 25% tariff on imports from Japan and South Korea, effective August 1. In a letter to the leaders of Japan and South Korea, Trump said the tariffs would be imposed on August 1 because the two countries' trade relationship with the United States is "very unfair".
This is his first letter to major trading partners ahead of the July 9 deadline to reach a trade deal.
Trump said that despite the large trade deficits between the United States and South Korea and Japan, the United States has decided to continue to cooperate with the two countries. However, the United States has decided to move forward on the premise of more balanced and fair trade. Trump said that the trade deficit has posed a major threat to the US economy and even national security, so changes are needed. Starting August 1, 2025, the United States will impose a 25% tariff on all products from South Korea and Japan, regardless of the different tariffs by industry.
Additionally, any attempt to circumvent tariffs by shipping through a third country will also be subject to higher tariffs.
Trump said companies that choose to build factories or manufacture products in the United States will not have to pay the tariffs. Additionally, if South Korea and Japan decide to increase tariffs on the United States, the United States will impose additional tariffs of the same size on top of the current 25% tariff.
Official data released by the People's Bank of China on Monday showed that China's central bank increased its gold reserves in June, marking the eighth consecutive month of increase.
Bank of America said that central banks around the world are buying gold to diversify their foreign exchange reserves, thereby reducing their dependence on the US dollar and protecting against inflation and economic instability, and the trend is expected to continue.
Technical Outlook Analysis CAPITALCOM:GOLD
On the daily chart, gold has recovered from a key technical confluence area, which is the closest support area to note for readers in the weekly publication. The area from $3,292 – $3,300 is the confluence of the 0.382% Fibonacci retracement with the lower edge of the long-term rising price channel. However, the temporary recovery is being limited by the EMA21, the current closest resistance, followed by the 0.236% Fibonacci retracement level.
The recovery momentum is significant, but for gold to have enough technical bullish conditions, it needs to take price action above the EMA21, with a bullish breakout of the 0.236% Fibonacci retracement level then the prospect of a new bullish cycle will be opened.
If gold breaks above the 0.236% Fibonacci retracement level it will have the next target at the raw price point of $3,400 followed by horizontal resistance at $3,430.
During the day, the current gold price should still be assessed as a sideways accumulation trend, when the Relative Strength Index RSI sticks around 50, showing the market's hesitant sentiment.
A strong enough fundamental impact to change the structure will give a more specific technical trend in the coming time, and the notable positions will be listed as follows.
Support: 3,300 - 3,292 USD
Resistance: 3,350 - 3,371 - 3,400 USD
SELL XAUUSD PRICE 3366 - 3364⚡️
↠↠ Stop Loss 3370
→Take Profit 1 3358
↨
→Take Profit 2 3352
BUY XAUUSD PRICE 3294 - 3296⚡️
↠↠ Stop Loss 3290
→Take Profit 1 3302
↨
→Take Profit 2 3308
2025-07-08 - priceactiontds - daily update - daxGood Evening and I hope you are well.
comment: Not many times a month where the chart is as clear as this one. Every pattern can fail but you have to take these setups because they work more than they fail. Market is clearly refusing to go down, so don’t try to short it yet.
current market cycle: trading range - bull trend on the 1h tf
key levels: 23600 - 24700
bull case: Bulls want a retest of 24500+ and today they got a clear breakout above the prior high and stayed there. They have all the arguments on their side to test the ath. Only thing they could stop this is a news event.
Invalidation is below 23860.
bear case: Bears kinda gave up. Channel is tight and looking for shorts in these channels is not a good strategy. Above 24400 bears have to cover again since the obvious target is 24500+. Bears basically have nothing here. No matter what you think of we where should trade.
Invalidation is above 24400.
short term: Can only be bullish. Any long has stop 24170
medium-long term from 2025-06-29: Bull surprise last week but my targets for the second half of 2025 remain the same. I still expect at least 21000 to get hit again this year. As of now, bulls are favored until we drop below 23000
trade of the day: Buying any pullback was good. Most obvious one was the double bottom on EU open, right at the 1h 20ema.
US tariff deadline, GOLD expected to fluctuate very stronglyInvestors will be keeping an eye on tariff news from Washington this week as the temporary suspension of punitive import duties is set to expire. If trade tensions do not escalate further after Wednesday’s deadline, that could be good for the market, while downside risks are also a negative for OANDA:XAUUSD in particular.
News Around US Tariffs
To avoid higher tariffs, negotiators from more than a dozen major US trading partners are racing against time to negotiate with the Trump administration, trying to reach a deal before July 9. Trump and his team have continued to apply pressure in recent days.
Trump announced a deal with Vietnam to lower the 20% tariffs he had promised on many Vietnamese exports, while talks with Japan, the United States’ most important ally in Asia and sixth-largest trading partner, appeared to be stalled, even as Washington hinted it was close to a deal with India.
In data
Nonfarm payrolls data released Thursday showed the U.S. added 147,000 jobs in June, beating market expectations, and the unemployment rate fell to 4.1%.
Despite the slowdown in private-sector hiring, the overall strong report prompted markets to lower expectations for a Federal Reserve rate cut in July.
According to the CME FedWatch Tool, the probability of a rate cut has dropped sharply from 24% to 4.7%. Fed Chairman Powell reiterated that the central bank will not ease its stance until there are more signs of cooling in employment and inflation.
Personal Comments
The market is following a number of factors:
On the one hand, there is a countdown to Trump's "final blow" on tariffs, and on the other hand, the non-farm data has poured cold water once again. As the Fed's stance fluctuates, the US Dollar faces a tug-of-war between long and short positions, while gold continues to stabilize technically or has had significant price increases. July 9 of this month could be a key moment to really test the sustainability of gold in this recovery.
Technical Outlook Analysis OANDA:XAUUSD
Gold has recovered significantly over the past week, since finding support from the $3,250 area, but the temporary recovery is still limited by the EMA21 followed by the 0.236% Fibonacci retracement level.
However, sustained price action above the $3,300 raw price point should be viewed as a positive signal as it helps gold stabilize within the price channel.
If gold rises and breaks above the 0.236% Fibonacci retracement level, it will be eligible to continue rising with a short-term target of around $3,400 rather than a horizontal resistance of $3,430.
The indecision sentiment is shown by the RSI activity, which is mostly moving around the 50 level. RSI above 50 is considered a positive signal, while RSI below 50 is considered a negative signal, but gold is currently in the middle of this point.
Overall, gold has not yet had a short-term trend, but in the long-term, gold prices are still in an upward trend, which is noted by the price channel.
Finally, the notable positions will be listed as follows.
Support: 3,300 – 3,292 – 3,250USD
Resistance: 3,350 – 3,371 – 3,400USD
SELL XAUUSD PRICE 3334 - 3332⚡️
↠↠ Stop Loss 3338
→Take Profit 1 3326
↨
→Take Profit 2 3320
BUY XAUUSD PRICE 3275 - 3277⚡️
↠↠ Stop Loss 3271
→Take Profit 1 3283
↨
→Take Profit 2 3289
WTI CRUDE OIL (USOIL): More Growth Ahead
Crude Oil broke and closed above a significant resistance.
The price is now retesting that.
I think that the market is going to rise.
Next resistance - 68.5
❤️Please, support my work with like, thank you!❤️