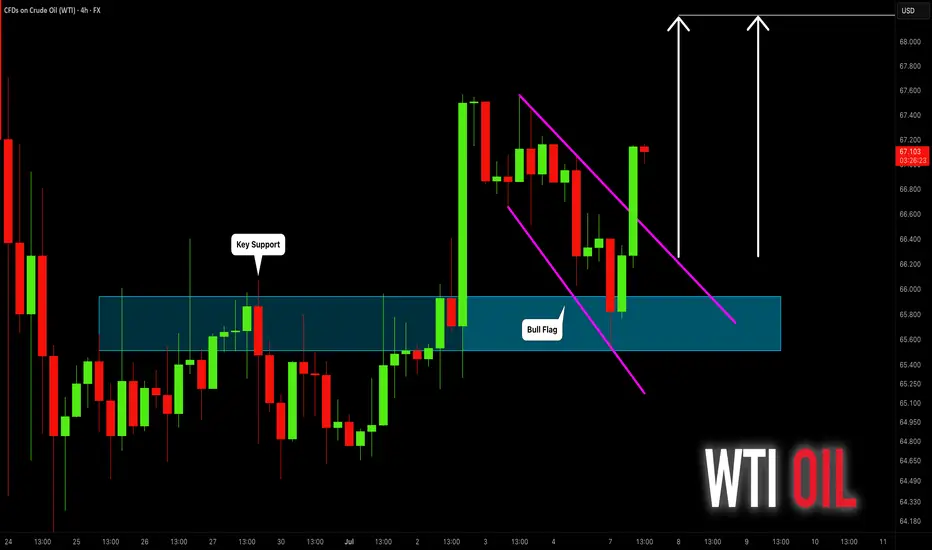
CRUDE OIL (WTI): Move Up Ahead!
Last week, I already shared a bullish setup on WTI Crude Oil
on a daily time frame.
I see a strong intraday bullish confirmation today.
After a test of an underlined blue support area,
the price went up strongly and violated a resistance line
of a bullish flag pattern on a 4H time frame.
The market is going to rise more.
Goal - 68.2
❤️Please, support my work with like, thank you!❤️
I am part of Trade Nation's Influencer program and receive a monthly fee for using their TradingView charts in my analysis.
Futures
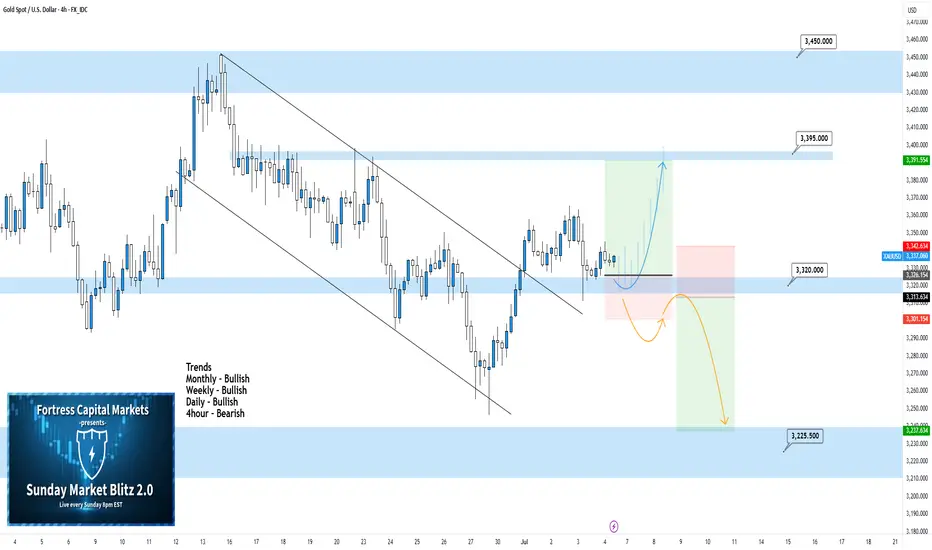
XAUUSD 4Hour TF - July 6th, 2025XAUUSD 7/6/2025
XAUUSD 4 hour Long Idea
Monthly - Bullish
Weekly - Bullish
Daily - Bullish
4hour - Bullish
Back to bullish here on Gold but that comes as no surprise when you look at the higher timeframe trends.
I’m mainly considering long scenarios for the week ahead but let's take a look at two for the week ahead:
4hour bearish continuation - Currently we can see price action broke above 3,320.00 resistance and is currently looking to find some footing. We’re keeping an eye out for higher lows at or near this level to then consider long scenarios. 3,395.000 seems like a good target but gold has potential to go higher.
4hour trend reversal - If we are to consider short positions on gold we would need to see a break back below our 3,320.000 zone. Look for confirmed lower highs below 3,320.000 and target lower key support levels if this happens.
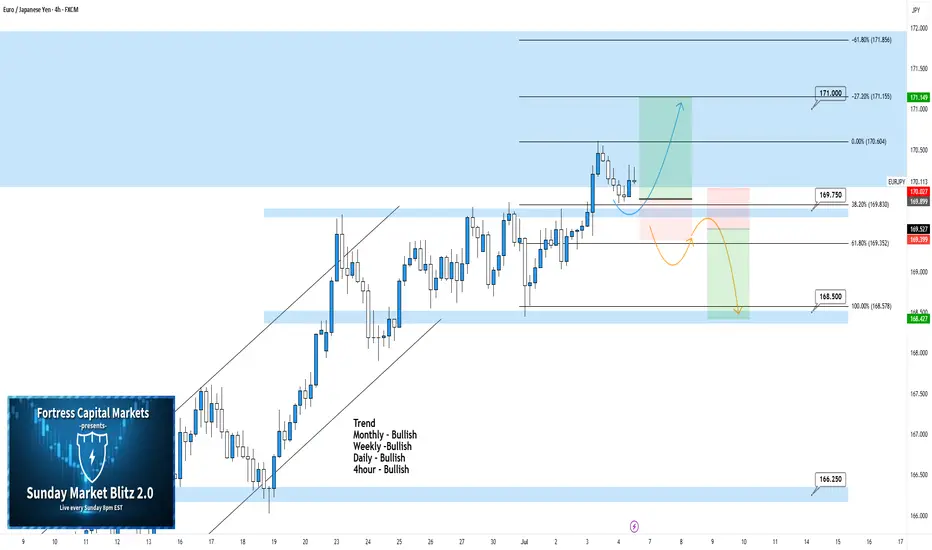
EURJPY 4Hour TF - July 6th, 2025EURJPY 7/6/2025
EURJPY 4hour Bullish Idea
Monthly - Bullish
Weekly - Bullish
Daily - Bullish
4hour - Bullish
EJ is doing it’s thing and sticking with it’s bullish trend for now. The only conflicting signal is this major monthly zone around the 171.000 area so we will have to be careful.
Let’s keep a look out for two potential scenarios going into this week:
Bullish Continuation - We just saw a break above the 169.750 4hour zone which is fairly significant and it is signaling new support for this currently forming higher low, which is great. From here we’re looking for this bullish trend to continue, look for strong bullish conviction coming off this 169.750 zone and look to target higher.
Trend Reversal - This is a possibility with our 171.000 looming overhead. If we start to see bearish rejection look for a lower high below 169.750 and look to target lower toward key support levels.
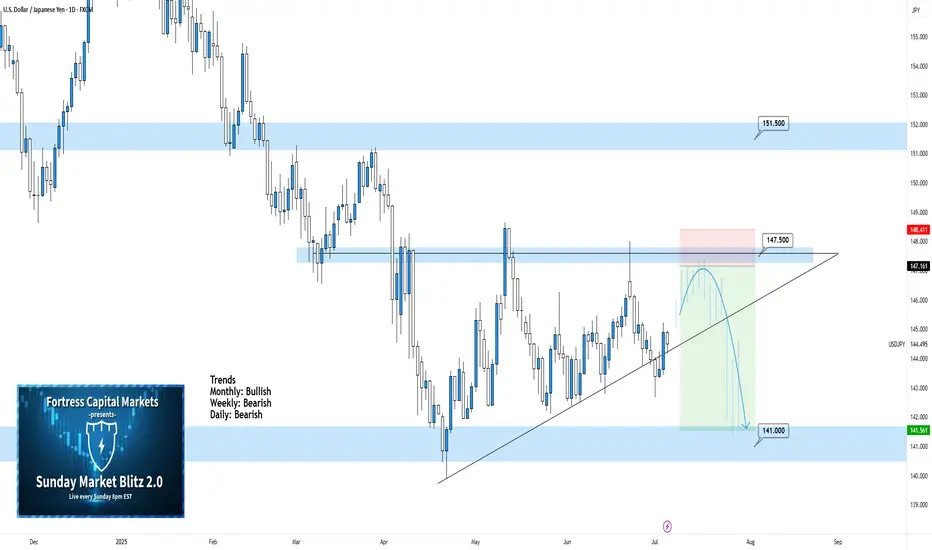
USDJPY Daily TF - July 6th, 2025USDJPY 7/6/2025
USDJPY Daily Neutral Idea
Monthly - Bullish
Weekly - Bearish
Daily - Bearish
We’re still on the daily timeframe with UJ as there is nothing worthwhile. We are clearly in some daily consolidation phase and price action has no clear direction from a swing perspective.
Bearish Continuation - For us to consider a bearish continuation, which is the most likely, we would like to see a retest of our 147.500 zone followed by strong bearish rejection. If we can spot rejection around the 147.500 zone it could present some decent short positions. I’d be looking to target lower toward key support levels.
Aside from this potential setup i’m not looking at any other scenarios for UJ.
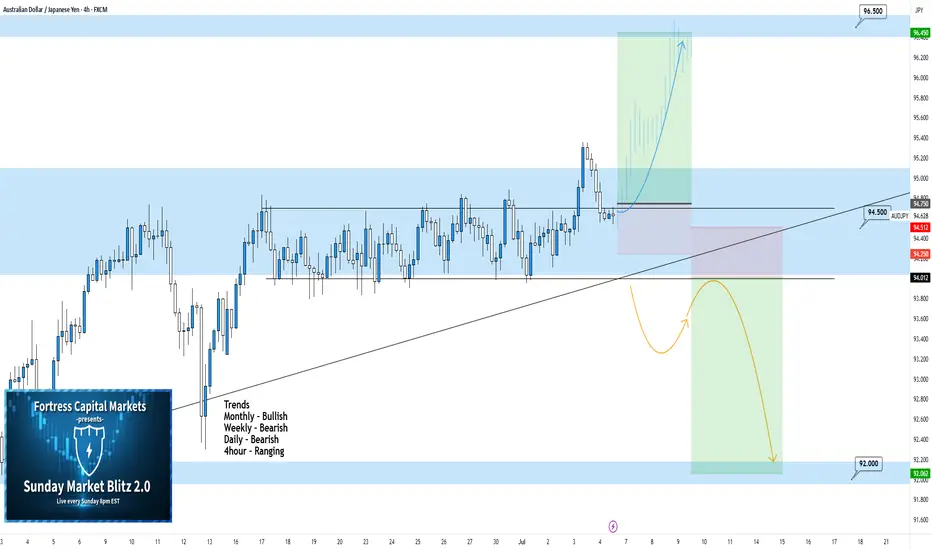
AUDJPY 4Hour TF - July 6th, 2025AUDJPY 7/6/2025
AUDJPY 4hour Neutral Idea
Monthly - Bullish
Weekly - Bearish
Dailly - Bearish
4hour - Ranging
We’re getting some mixed signals here on AJ so i’ll keep this as a neutral idea as we need more info from price action. Most of the major trends seem bearish but the 4hour trend seems to have some bullish pressure. Let’s see how this could play out this week:
Bullish Breakout - We already saw a pretty significant bullish attempt to break out of this range around 94.500. If we can spot some bullish conviction, now that we're retesting what seems to be a broken range, then we can confirm a bullish 4hour trend and prepare for potential long scenarios. I’ll be looking higher toward key resistance around 96.500 if this happens.
Bearish Breakout - For us to consider comfortable bearish scenarios, we would need to see price action fall back through our 94.500 zone and form a lower high. If we see structure formed below 94.500 we can begin targeting lower for potential short positions. Look toward key support levels as targets.
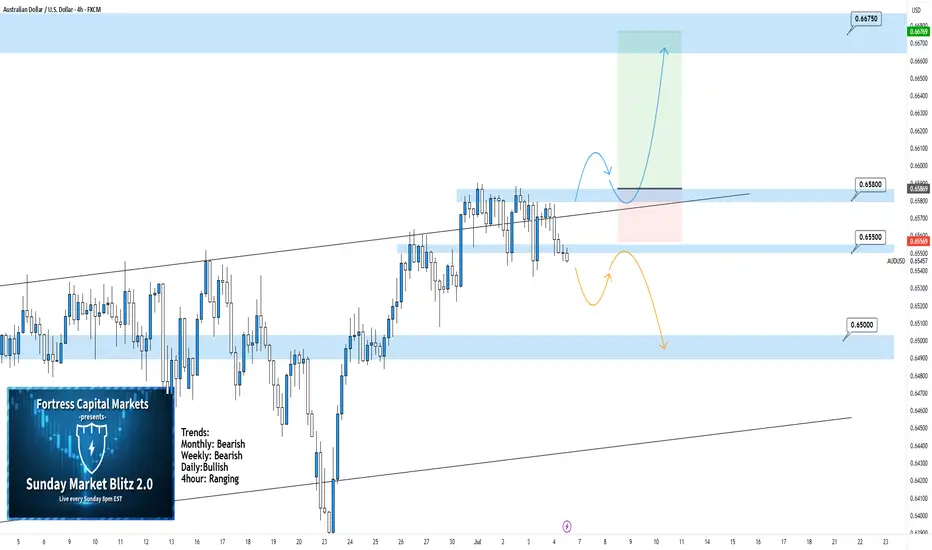
AUDUSD 4hour TF - July 6th, 2025AUDUSD 7/6/2025
AUDUSD 4hour Neutral idea
Monthly - Bearish
Weekly - Bearish
Dailly - Bullish
4hour - Ranging
We are still technically bullish overall but we can see here on the 4hour that AU is ranging between 0.65800 & 0.65500. This is a fairly small range so we’re not that interested in taking trades while price action is bouncing between these two zones.
We’re looking for conviction above 0.65800 or below 0.65500 before we can comfortably make a move. Let’s see what both of those situations would look like:
Bullish Continuation - Most of the trend data is suggesting AU is still bullish but we would need to see a strong push above resistance around 0.65800 with a confirmed higher low above before getting into any trades. If we do see this play out I'm looking toward 0.66750 resistance as a target.
Reversal back into channel - Price action seems to be poking out of the bottom of this range but we are still not convinced just yet. For us to strongly consider this a bearish move we would like to see a retest of 0.65500 as resistance followed by bearish conviction. Look for price action to move lower toward key support areas if this happens.
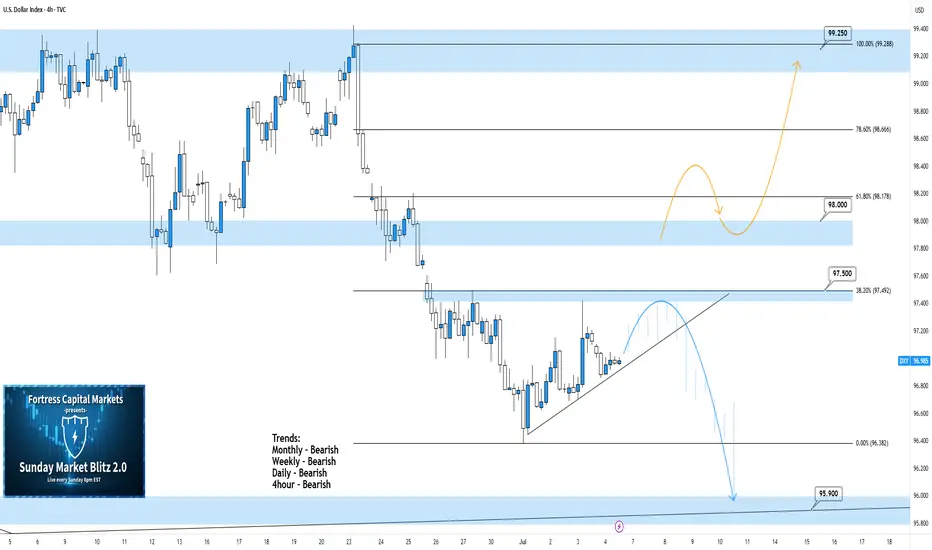
DXY 4Hour TF - July 6th, 2025DXY 7/6/2025
DXY 4hour Bearish Idea
Monthly - Bearish
Weekly - Bearish
Dailly - Bearish
4hour - Bearish
All timeframes are suggesting we are sitll very much bearish. Going into this week we can spot two scenarios that will consider DXY either bullish or bearish.
Bearish Continuation - Ideally we can see price action stay below our 97.500 resistance zone which is also our 38.2% fib level. Look for price action to reject 97.500 with strong bearish conviction. This will most likely confirm a bearish dollar for the week ahead. Keep in mind, price action can push up to the 98.000 zone and still remain bearish.
Reversal - This is the less likely move for the week ahead but not impossible. For us to consider DXY bullish again on the 4hour timeframe we would need to see price action push above our 98.000 resistance area with a confirmed higher low above. Look for strong bullish rejection above & off of 98.000 acting as support. This is the first step for DXY in becoming bullish again.
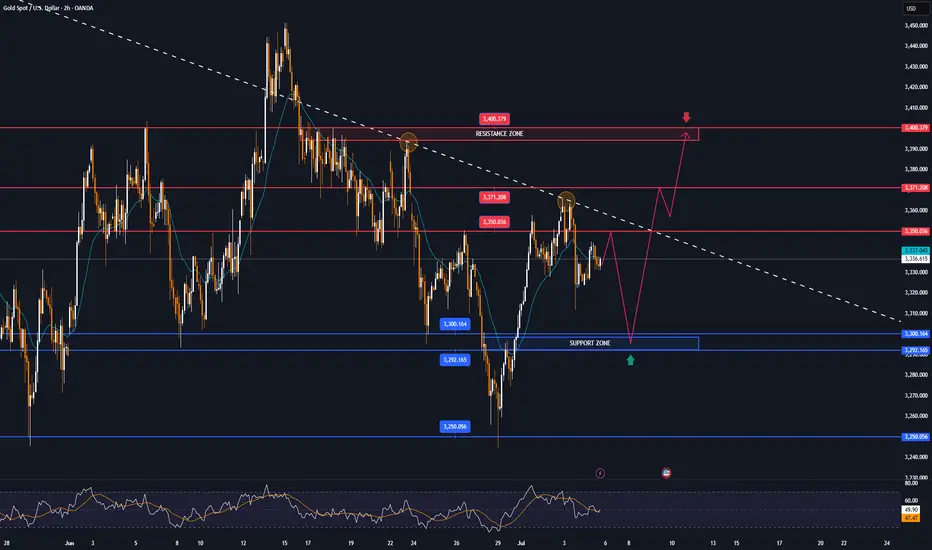
GOLD MARKET ANALYSIS AND COMMENTARY - [Jul 07 - Jul 11]OANDA:XAUUSD opened the week at $3,246/oz due to low summer liquidity, easing recession fears and easing geopolitical tensions. However, they later recovered to $3,365/oz due to concerns about a possible re-escalation of the trade war, as some countries faced obstacles in negotiations with the US ahead of the July 9 tariff delay deadline. By the end of the week, prices had adjusted to $3,311/oz and closed at $3,335/oz.
In addition, the US Senate has passed the OBBBA tax cut and spending bill proposed by President Donald Trump. While it helps prevent the risk of a short-term default, the bill could increase the US public debt by more than $3,000 billion over the next 10 years, putting pressure on the bond market and raising concerns about the increasing supply of government bonds while demand is weakening.
However, US economic data over the weekend put downward pressure on gold. Specifically, the June employment report showed that the number of non-farm jobs (NFP) reached 147,000, exceeding the forecast of 111,000. The unemployment rate fell to 4.1%, lower than the expected 4.3%. At the same time, NFP data for April and May were also adjusted up to 158,000 and 144,000 jobs, respectively.
These positive numbers almost erased the expectation that the FED would cut interest rates in July. The FED also reaffirmed its stance on maintaining the current policy due to rising inflationary pressures.
Overall, gold prices are still stuck in a range, and a clearer prospect of interest rate cuts from the FED is needed to make a strong breakthrough in the near future.
📌Technically, the $3,310/oz level is now acting as an important support zone for gold prices next week. If this level is broken, prices may continue to fall further to the $3,245/oz area or even lower.
On the other hand, the $3,365/oz level is a strong resistance. If gold prices break through this area, there is a high possibility that they will approach the $3,400/oz mark. However, the upward momentum may be restrained afterwards due to profit-taking pressure from investors, especially when the US-China trade negotiations are still ongoing and have not reached a final agreement. Investors tend to be cautious, waiting for clearer signals before opening new positions.
Notable technical levels are listed below.
Support: 3,300 – 3,292 – 3,250USD
Resistance: 3,350 – 3,371 – 3,400USD
SELL XAUUSD PRICE 3401 - 3399⚡️
↠↠ Stop Loss 3405
BUY XAUUSD PRICE 3294 - 3296⚡️
↠↠ Stop Loss 3290
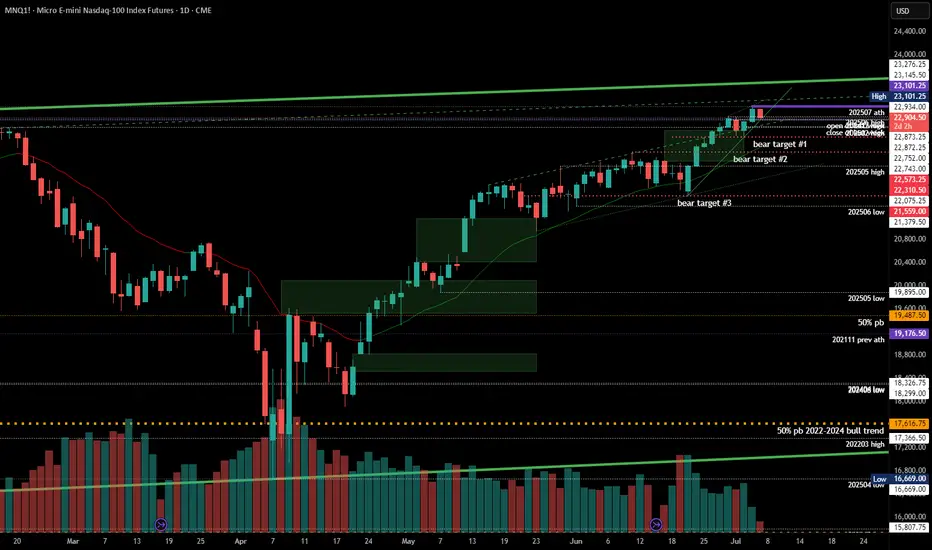
#202527 - priceactiontds - weekly update - nasdaq
Good Day and I hope you are well.
comment: Neutral. Chart is still max bullish but I have no more targets above and I’m fine with this going without me. Below 22600 I will start looking for lower targets. Until then best bears can get is sideways around 23000 but we will get a big move Monday/Tuesday once we have an answer on the US-EU tariff shit show. A good start for the bears is any price below 22584.
current market cycle: resumption of the bull trend but likely the final flag and we most likely will top out here around/under 23000
key levels for next week: 22000 - 23000
bull case: Bulls obviously still in full control. 2 bear bars out of the past 9 is a strong bull trend. Until we see much bigger selling pressure, technically we can only expect higher prices. Bulls broke above the bull channel from 21000 late may and confirmed the breakout now. The issues against the bulls are also the same arguments as for them. It’s overbought, climactic and very very late in the trend. This strong selling this late is something that usually happens before we turn,
Invalidation is below 22600
bear case: Just to make this clear again, bears have nothing right now. This chart is as bullish as it gets, that is why you can not look to short this yet. With that disclaimer, I also think it’s a bad buy. We are beyond overbought on many many economic indicators worsening and this trend is trying to accelerate. This is the time where weak/late bulls come around with the “this time it’s different” and "valuations don’t matter. We will again sell off big time this year but it’s stupid to trying to pick the top here.
Invalidation is above 23200 (any number I write here is stupid because it’s top picking. It could easily go to 23500 given the strength of this move)
short term: Neutral. No interest in buying but too early for shorts. Let’s see what the US-EU trade “talks” bring next week.
medium-long term - Update from 2024-06-29: No change in plans. I expect 20000 to get hit over the next 3 months and maybe 19000 again.
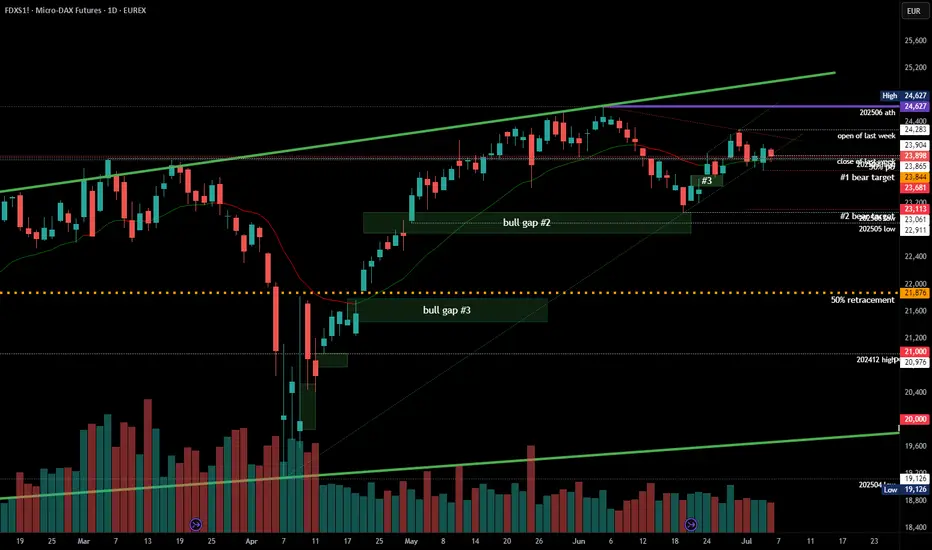
#202527 - priceactiontds - weekly update - daxGood Day and I hope you are well.
comment: Neutral. Clear triangle on the daily chart and mid point is 23850. Week closed at 23900. Market is in balance and I think it’s completely 50/50 for both sides where the breakout will happen. Given the tariff shit show, I would wait for it to happen and be flat until then. If they apply 10%+ tariffs on EU imports, we go down, if they postpone, we rally further. I trade only technicals but this is one of the few moments per year where news will completely determine where the markets will breakout out next.
Big if. If orange face does another TACO move, momentum is strong enough for markets to keep going and squeeze further. We need a very strong daily bear bar to kill it.
current market cycle: trading range - triangle
key levels for next week: 23500 - 24300 (above 24300, 500 comes into play and also likely 600+)
bull case: Bulls made a higher low but barely. This is a bad looking bull trend from the 23061 low and market is currently in breakout mode to decide where we go next. The 24283 high is a reasonable high to turn lower but as longs as bulls stay above 23600, there is a chance of this doing another try at 23300 and above the ugly bull channel is confirmed and higher prices are likely.
Invalidation is below 23500
bear case: Bears keeping it below 24000 is good but they are not doing enough or we would have made lower lows below 23600. Everything depends on the US-EU tariffs over the next days. Technically all bullish targets are met and the 24283 was high enough to qualify as a re-test. Market is free to go down again, it just needs a catalyst.
Invalidation is above 24300
short term: Neutral. I won’t gamble on the trade talk outcome but I am much more eager to sell this on bad news than to buy it on not-too-bad news.
medium-long term from 2025-06-29: Bull surprise last week but my targets for the second half of 2025 remain the same. I still expect at least 21000 to get hit again this year. As of now, bulls are favored until we drop below 23000.
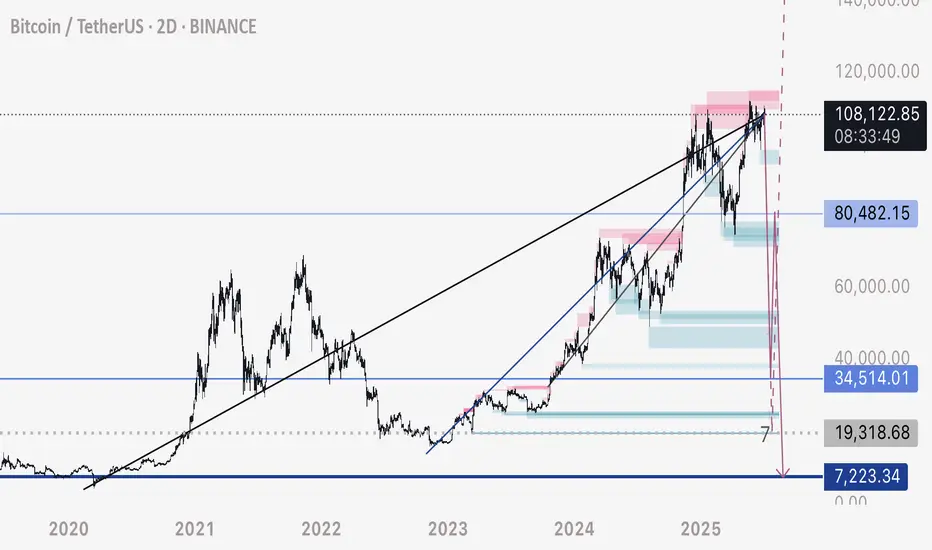
BTC - Zoomed Out ScenarioAs predicted DXY has broken down a major monthly bearish trendline - currently finishing a bearish retest before further free fall.
If this plays out we have 2-3 years of a weakening / correcting dollar, and a strengthening investment in assets such as Bitcoin.
This means an extended bull market spanning 2-4 years on Bitcoin and equities.
However - there is a mass amount of liquidity to the uber lows towards 10,000 on BTC.
Market is showing manipulated intention to hit these lows by keeping the price below this bearish cross section - and that’s why bitcoin hasn’t been moving up yet.
This tells me this is more likely than we all think to play out.
I’m trading the following:
Short - 108,200 to 35,000
Long - 35,000 to 80,000
Short - 80,000 to 10,000
Will update accordingly if the plan changes.
Happy trading.
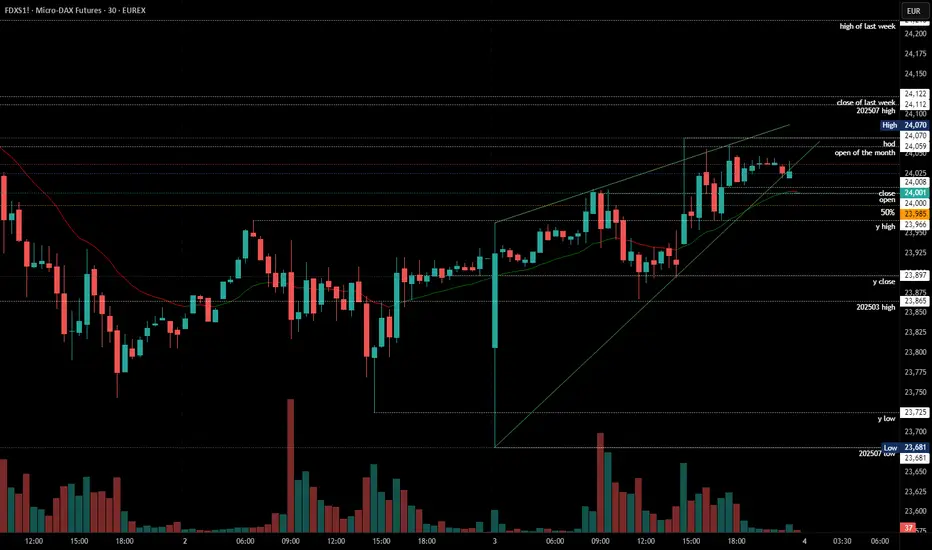
2025-07-03 - priceactiontds - daily update - daxGood Evening and I hope you are well.
comment: On my weekly chart I think this W4 was too deep to be part of a strong bull trend. 24000 is a decent spot to go sideways rather than up but above 24100 means I’m likely wrong and bears could give up for 24500+. I would not look for shorts until we see better selling pressure again. The Globex spike from 23681 to 23963 was beyond weird. It’s a bull wedge but will likely break out sideways in Globex session. 50/50 for both sides I think.
current market cycle: unclear. bull trend could continue but trading range is most likely
key levels: 23600 - 24500
bull case: Bulls want a retest of 24500+ but they find no buyers around 24000. They tried so many times to print 24000 and today they finally did it again but they would need to stay above 23900 and go sideways until bears give up. Markets can poke at a price long enough until one sides gives up.
Invalidation is below 23860.
bear case: Bears need lower lows again and if they can get below 23860, many bulls could cover in fear of a bigger pullback down to 23700. As of now bears have zero arguments since we only made higher lows since Globex low but we are also barely making higher highs and if we do, they have tails above.
Invalidation is above 24100.
short term: Completely neutral. Can go both way. US markets are overbought and once the profit taking starts, Dax won’t hold up either. Not much interest in guessing which way we go from 24000. Best to sit on hands and wait for a clear and strong signal.
medium-long term from 2025-06-29: Bull surprise last week but my targets for the second half of 2025 remain the same. I still expect at least 21000 to get hit again this year. As of now, bulls are favored until we drop below 23000
trade of the day: Longs since the giant Globex bull spike but had to have wide stops and scale in. Not an easy day.
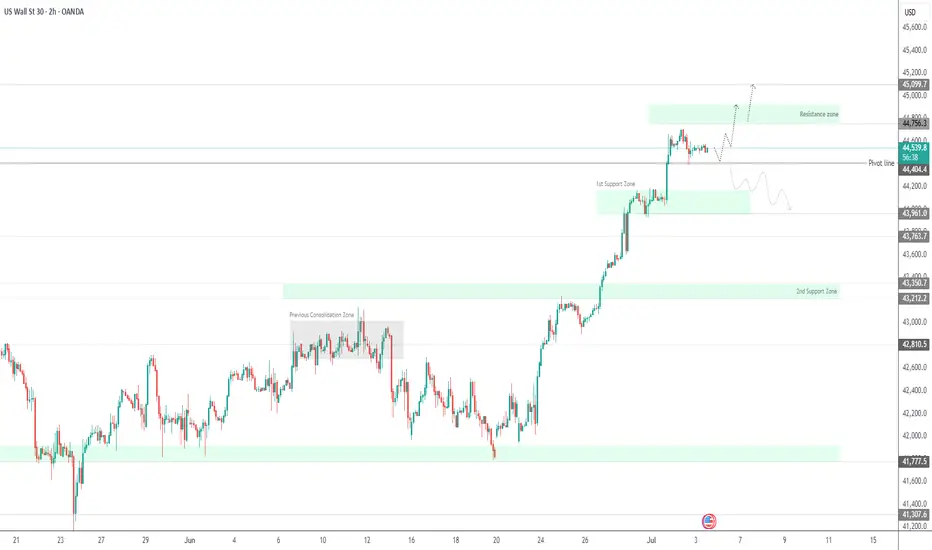
US30 Awaits NFP – Bullish Above 44,410, Volatility Expected US30 (Dow Jones) – NFP Volatility in Focus
Today’s session is expected to be volatile due to the upcoming NFP report. Based on current forecasts, the outlook remains broadly positive for U.S. indices, though intraday swings are likely.
Technical Outlook:
As long as the price holds above 44,410, the bullish momentum remains intact, with potential upside targets at 44,750 and 44,910
A pullback toward 44,410 remains possible before any continuation higher.
However, a confirmed 4H close below 44,400 would shift the short-term structure to bearish, opening the door toward the 1st support zone around 44,180.
Key Levels:
• Resistance: 44,750 / 44,910 / 45,090
• Support: 44,410 / 44,180 / 43,970
Stay cautious — volatility is expected to spike around the release of the jobs data.
USDJPY; Heikin Ashi Trade IdeaOANDA:USDJPY
In this video, I’ll be sharing my analysis of USDJPY, using FXAN's proprietary algo indicators with my unique Heikin Ashi strategy. I’ll walk you through the reasoning behind my trade setup and highlight key areas where I’m anticipating potential opportunities.
I’m always happy to receive any feedback.
Like, share and comment! ❤️
Thank you for watching my videos! 🙏

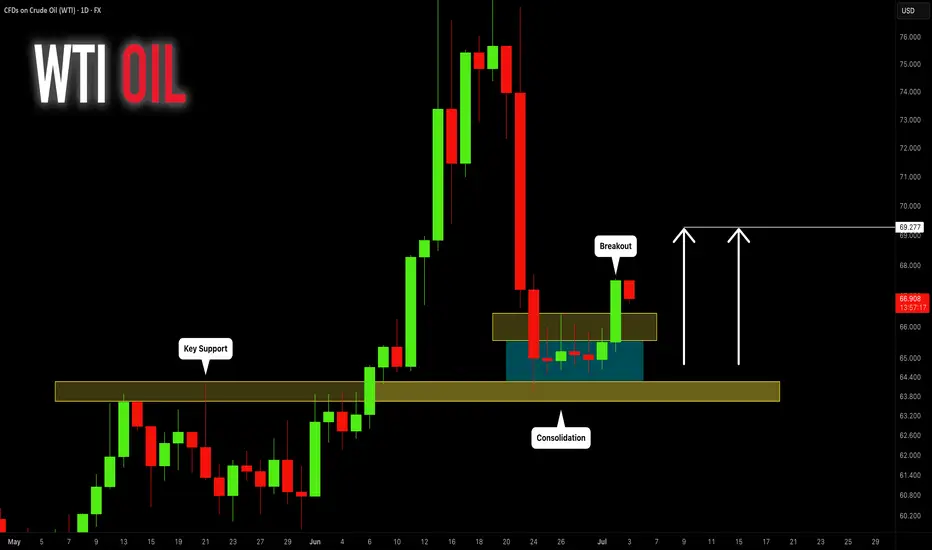
CRUDE OIL (WTI): Consolidation is Over
Crude Oil was consolidating for 6 trading days in a row
after a test of a key daily support.
The yesterday's Crude Oil Inventories data made the market bullish
and the price successfully violated a minor resistance of a sideways movement.
We can expect that the market will grow more.
Next resistance - 69.27
❤️Please, support my work with like, thank you!❤️
2025-07-02 - priceactiontds - daily update - nasdaqGood Evening and I hope you are well.
comment: Big down, big up. Clear trading range. Play it until broken.
current market cycle: bull trend on higher tf but trading range on the 1h tf
key levels: 22500 - 23000
bull case: Bulls want 23000. Nothing changed. Bulls buy every dip below 22670 and until that stops, we stay at the highs and chances of higher prices are greater than a deeper pullback. I have no targets above 23000 though.
Invalidation is below 22500.
bear case: Bears not doing enough and have to scalp out or their profits disappear. They need a strong 1h close below 22500 for more downside but for now markets are continuing to ignore every bad news and the structure is as bullish as it gets on the daily tf. Bears are barely making money, so try to look for easy longs.
Invalidation is above 23200.
short term: Neutral but I still expect 23000 to get hit and maybe some more squeeze above. Zero interest in shorts and longs only for scalps and small. It’s still overbought and a deeper pullback is expected over the next days.
medium-long term - Update from 2024-06-29: No change in plans. I expect 20000 to get hit over the next 3 months and maybe 19000 again.
trade of the day: Longs below 22670 have been amazing since Friday.

2025-07-01 - priceactiontds - daily update - daxGood Evening and I hope you are well.
comment: If I had longs for 24400+ I would really doubt my position right now. Problem for the bears is, that it’s not low enough to be definitive. Only below 23600 we are making lower lows again and those can not happen in bull trends. Strong enough selling but I have my doubts that bears get follow-through tomorrow. Especially when other markets are rallying instead of selling. Above 24000 we likely see more upside but if bears are strong, they keep the market below and continue lower.
current market cycle: unclear. bull trend could continue but trading range is most likely
key levels: 23100 - 24500
bull case: Bulls need to stay above 23700 bad and continue higher for 24000. If they manage to break above 24k and the bear trend line, there is no reason why we can’t have another strong leg up. Until the bear channel is broken, they are not favored for anything. This could have been a retest of the daily 20ema, but only if we move strongly higher tomorrow.
Invalidation is below 23600.
bear case: Bears need follow-through below 23600 and close the gap to 23540. Then they have a good argument to trade down to 23100 or lower. Right now I would not short the lows because the risk of trading back up to 24000 is too big. The bear channel is clear and valid until broken.
Invalidation is above 24050ish.
short term: Slightly bullish that we bottom out above 23750 and trade back up to 24000 but I would only do small scalps here. Anything below 23700 would surprise me more than 24000.
medium-long term from 2025-06-29: Bull surprise last week but my targets for the second half of 2025 remain the same. I still expect at least 21000 to get hit again this year. As of now, bulls are favored until we drop below 23000
trade of the day: Short from EU open.

How to Trade Double Tops & Bottoms in TradingViewLearn how to identify, validate, and trade double top and double bottom reversal patterns using TradingView's charting tools in this comprehensive tutorial from Optimus Futures. Understanding these classic chart formations can help you spot potential trend reversals and capitalize on contrarian trading opportunities in the futures markets.
What You'll Learn:
• Understanding contrarian vs. continuation trading strategies and when to use each approach
• The psychology behind buying low and selling high through reversal pattern trading
• How to identify double top and double bottom formations on any timeframe
• Key characteristics of valid double tops and bottoms, including volume confirmation
• Using TradingView's XABCD pattern tool to validate potential double top/bottom setups
• Real-world example analysis using crude oil futures charts
• Risk management techniques for trading reversal patterns
• How to calculate appropriate entry points, stop losses, and profit targets
• Setting up 1:1 risk-reward ratios for mathematical trading edge
• Understanding win rate requirements for profitable pattern trading
• How double bottom patterns work as the inverse of double top formations
This tutorial may benefit futures traders, swing traders, and technical analysts interested in contrarian trading strategies and reversal pattern recognition. The concepts covered could help you identify potential turning points in market trends and develop systematic approaches to trading these classic chart formations.
Visit Optimus Futures to learn more about trading futures with TradingView: optimusfutures.com/Platforms/TradingView.php
Disclaimer:
There is a substantial risk of loss in futures trading. Past performance is not indicative of future results. Please trade only with risk capital. We are not responsible for any third-party links, comments, or content shared on TradingView. Any opinions, links, or messages posted by users on TradingView do not represent our views or recommendations. Please exercise your own judgment and due diligence when engaging with any external content or user commentary.
This video represents the opinion of Optimus Futures and is intended for educational purposes only. Chart interpretations are presented solely to illustrate objective technical concepts and should not be viewed as predictive of future market behavior. In our opinion, charts are analytical tools—not forecasting instruments. Market conditions are constantly evolving, and all trading decisions should be made independently, with careful consideration of individual risk tolerance and financial objectives.

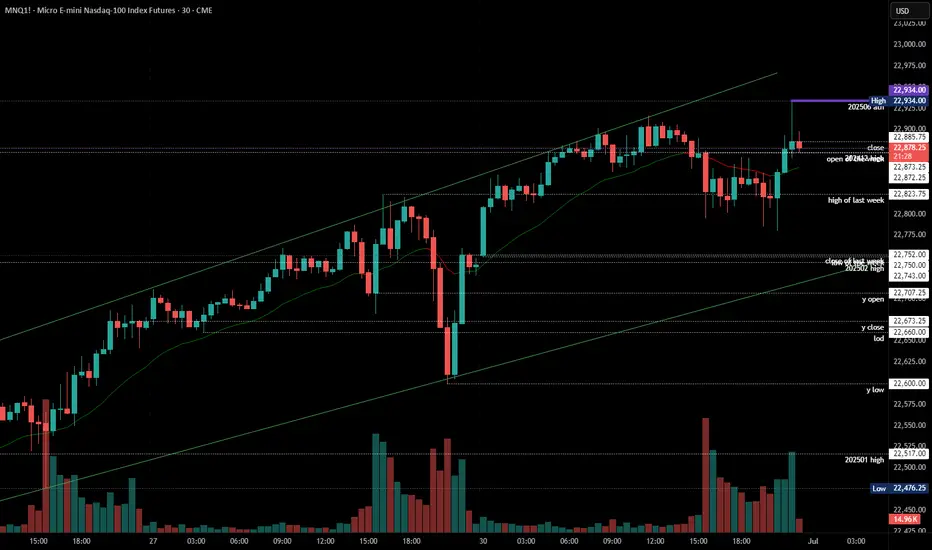
2025-06-30 - priceactiontds - daily update - nasdaqGood Evening and I hope you are well.
comment: Closing this high at the end of the month is as bullish as it gets. We are close to 23000 that I expect it to get hit. You never know where the top will be, so don’t try to pick it. Market is bullish and bullish only. Even if we print -2% tomorrow, there was no setup and no pattern for you to trade it on. It would be a huge bear surprise and you should never worry about them. Look for the path of least resistance and that is still long. At least for scalps. Bull channel is also still valid until clearly broken, which means a strong print below 22700 would do.
current market cycle: bull trend
key levels: 22600 - 23000
bull case: Bulls want 23000. Market is overbought but that does not matter if we can’t get more selling pressure. Long the pullbacks until it stops working. I can see this going to 23500 but it’s a rough guess and you should not trade based on those.
Invalidation is below 22200.
bear case: Bears got nothing. Don’t look for shorts. Daily close below 22600, then we can start thinking about lower prices again. I still expect this breakout to fail but as of now, we are only going up.
Invalidation is above 23500.
short term: Neutral but I will only scalp long until we see much much bigger selling pressure. 23000 is the obvious target and bears need something below 23700.
medium-long term - Update from 2024-06-29: No change in plans. I expect 20000 to get hit over the next 3 months and maybe 19000 again.
trade of the day: Any long around the high of last week (22823) has been profitable. It was a tight trading range but with a heavy bullish bias going in to today, long scalps were the obvious choice.
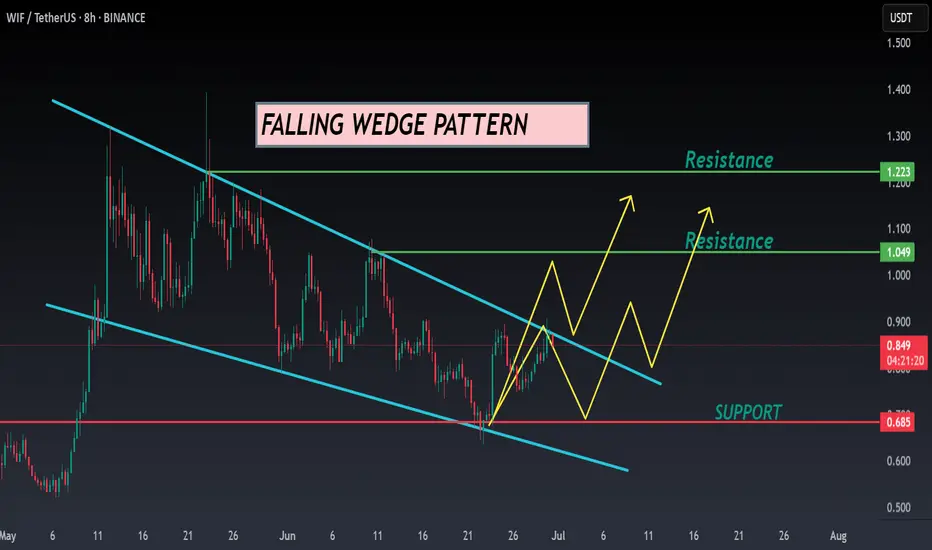
WIF ANALYSIS🔮 #WIF Analysis - Update 🚀🚀
💲 We can see that there is a formation of Falling Wedge Wedge Pattern in #WIF and we can see a bullish movement after a good breakout. Before that we would see a little retest and and then a bullish movement.
💸Current Price -- $0.848
📈Target Price -- $1.049
⁉️ What to do?
- We have marked crucial levels in the chart . We can trade according to the chart and make some profits. 🚀💸
#WIF #Cryptocurrency #Breakout #DYOR
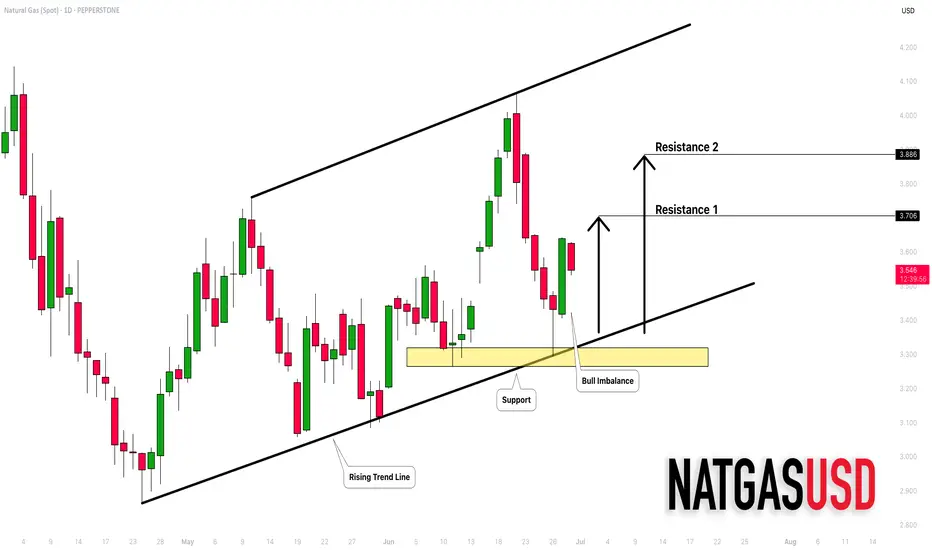
NATURAL GAS (NATGASUSD): Bullish Outlook Explained
Natural Gas is trading in a mid-term bullish trend on a daily.
The price updates higher highs and higher lows after each
test of a rising support line.
Its last test made the market form a strong rejection first
and a bullish engulfing candle then.
The market may continue growing and reach at least 3.7 resistance soon.
❤️Please, support my work with like, thank you!❤️
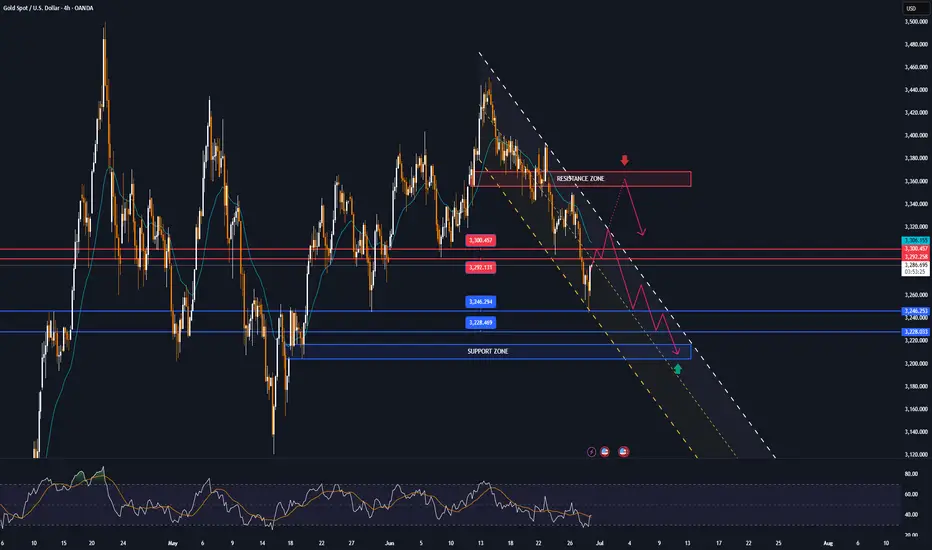
GOLD MARKET ANALYSIS AND COMMENTARY - [Jun 30 - Jul 04]Last week, OANDA:XAUUSD fell sharply from an opening price of $3,392/oz to a low of $3,255/oz and closed at $3,274/oz. The reason was that Israel and Iran had officially ceased fire, although negotiations with the US remained difficult. In addition, FED Chairman Jerome Powell reaffirmed that there was no rush to cut interest rates due to high inflation risks. In addition, summer is a period of weak demand for physical gold, continuing to put pressure on gold prices.
In addition, summer is typically the low season for physical gold demand, which could continue to weigh on gold prices.
In addition to the seasonal lull in trading that has affected the gold market, improving economic sentiment as the Trump administration has said there is progress in trade agreements, especially the framework agreement on trade with China, will also continue to negatively impact gold prices next week.
Thus, gold prices next week may continue to be under downward pressure, but the decline may not be too large as gold prices next week are still supported by some fundamental factors.
This week, the US will release the non-farm payrolls (NFP) report and the unemployment rate for June. According to forecasts, NFP may reach 120,000 jobs. If NFP increases higher than expected, the FED will continue to delay cutting interest rates, negatively affecting gold prices next week. On the contrary, if NFP drops sharply below 100,000 jobs, it will increase the possibility of the FED cutting interest rates, helping gold prices rise again next week, but not too strongly.
📌Technically, the gold price closed below $3,300/oz this week, which could pave the way for a drop to $3,200/oz next week, or below that to $3,120/oz. If the gold price rebounds above $3,300/oz next week, it could trigger a recovery to $3,330-$3,360/oz.
Notable technical levels are listed below.
Support: 3,246 – 3,228USD
Resistance: 3,292 – 3,300USD
SELL XAUUSD PRICE 3367 - 3365⚡️
↠↠ Stop Loss 3371
BUY XAUUSD PRICE 3178 - 3180⚡️
↠↠ Stop Loss 3174
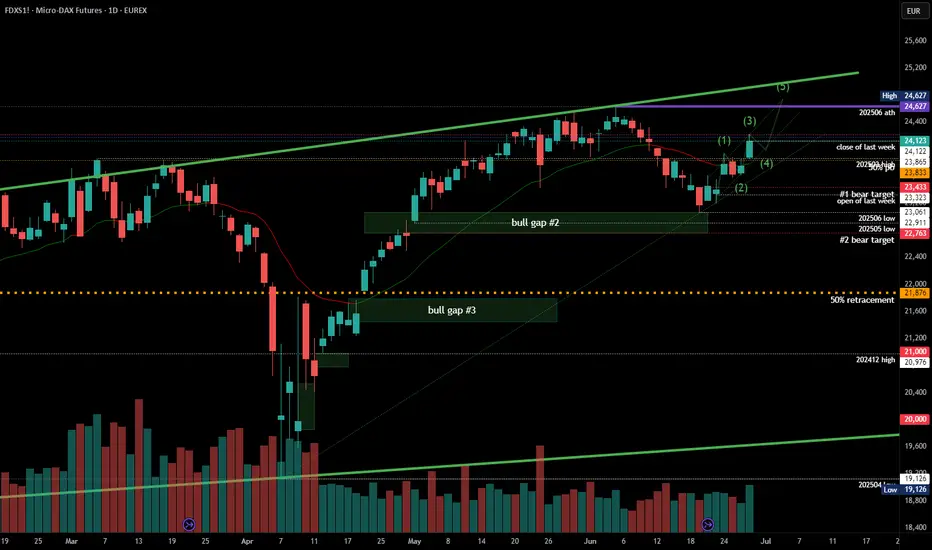
#202526 - priceactiontds - weekly update - daxGood Evening and I hope you are well.
comment: Monday was neutral and the warning to bears that the markets do not care about the risk at hand. Tuesday’s gap up then was the sign of bull strength and defending the Globex gap was the sure sign we are going higher. Thursday was the bears giving up and since we have a measured move target up to 24700. I have drawn my 5-wave thesis on the chart, which I think is currently the most likely outcome. All depends if the US markets continue the squeeze as well. There is always the possibility that Friday marked the highs but that is very low and in the absence of bear bars, we can only assume higher prices.
current market cycle: trading range
key levels for next week: 23500 - 25000
bull case: Bulls made the bears give up on Thursday and since we have been going only up. The obvious next targets are 24500 and then 25000. As of now, there is absolutely no reason to assume we reverse from here and print lower lows again. Bulls took over control of the market again and we have two clear legs up, with a third one we may do a new ath but as always, every pattern can fail.
Invalidation is below 23500
bear case: Not much. A pullback is expected but so is the third leg up for W5 and everything below 23500 would be a huge bear surprise and cut this short. As of now I don’t think this chart can lead you to looking for shorts. We would need a break of two bull trend lines and prices below 23500 before you should think bearish again.
Invalidation is above 24400
short term: Bearish was the obvious read last weekend and when bears failed on Monday, it set the stage for an explosive move to the upside. That can always happen since we are in a profession where you play odds.
medium-long term from 2025-06-29: Bull surprise last week but my targets for the second half of 2025 remain the same. I still expect at least 21000 to get hit again this year. As of now, bulls are favored until we drop below 23000