AUDUSD 4hour TF - June 29th, 2025AUDUSD 4hour Neutral idea
Monthly - Bearish
Weekly - Bearish
Dailly - Bullish
4hour - Bullish
AU has been in this subtle bullish channel since late April 2025, just above major monthly support at 0.63250 area.
We also have some conflicting trends and we need to see some conviction before we can comfortably follow price action. We do have some alignment with a bearish USD but at the moment we have two options:
Bullish Continuation - This is the most likely scenario based on what we’re seeing and where price action is. Ideally, we see some rejection from our 4hour 0.65000 support area followed by bullish conviction. If this happens look for price action to touch or break the top of this channel and continue bullish for the week ahead.
Reversal back into channel - If we fail to see bullish presence we could see price action fall back into the channel. The key indication of this would be a break below our 0.65000 support area followed by a retest and bearish conviction.
Futures

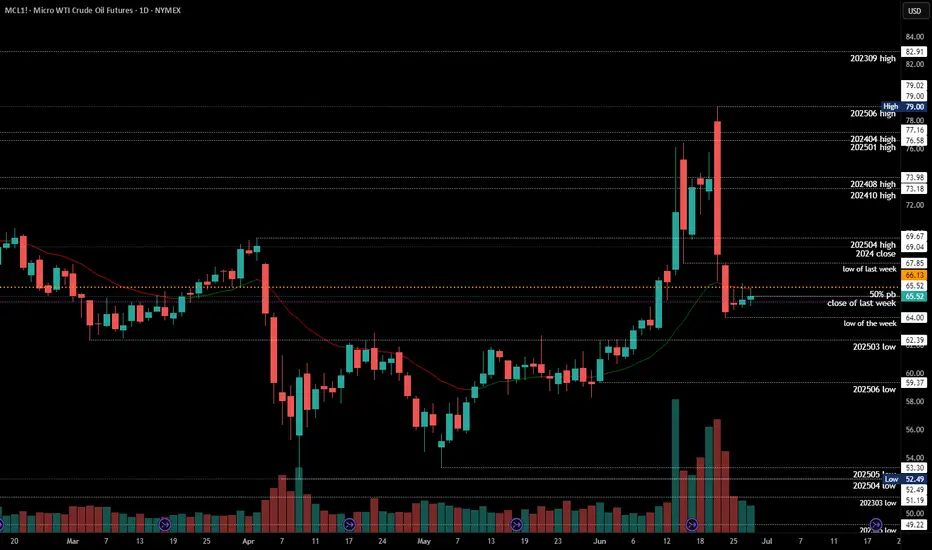
#202526 - priceactiontds - weekly update - wti crude oil futuresGood Day and I hope you are well.
#mcl1 - wti crude oil futures
comment: Yeah I don’t know about this one. Your guess is as good as mine. I could even see this touching 63 before going higher again. Most erratic and extreme price action the past 2 weeks, so maybe wait a bit before jumping the train here.
current market cycle: trading range
key levels: 63 - 80
bull case: Bulls don’t have much. They could not close one decent bar at the high since 2025-06-11 and despite all the bull spikes, we only sold afterwards and are back below 65 where the extreme breakout happened. Best guess here is that we stay above 63 and go sideways. Sideways up to where? No idea. Could be 68, could be 70.
Invalidation is below 63
bear case: Too extreme. Both sides have to take quick profits or the next spike will take them away again. So most likely sideways in a range until a newsbomb hit again. Range could be 63 - 68.
Invalidation is above 79
short term: Neutral. Not touching this unless someone threatens me with a gun.
medium-long term - Update from 2025-06-22: Let’s leave this as “todo” for now. No read on this and I won’t make stuff up just to post something.
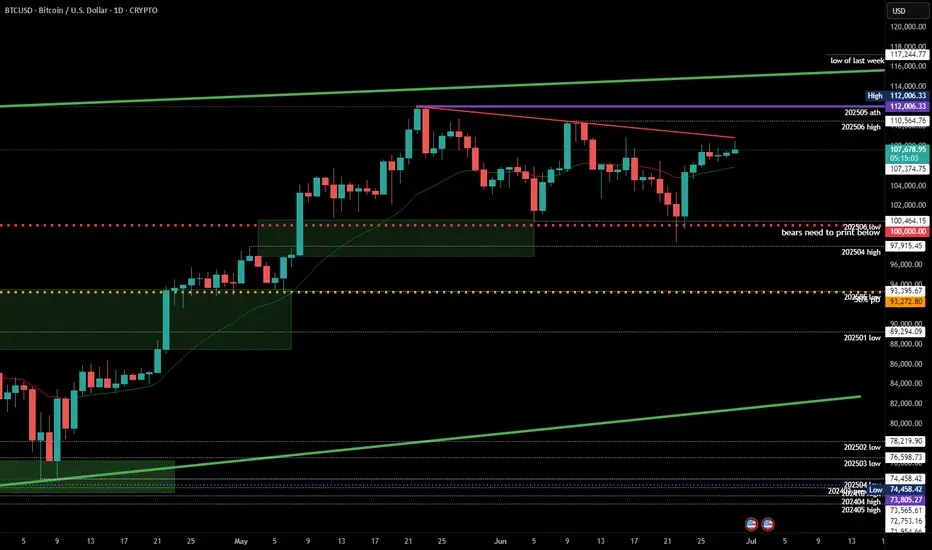
#202526 - priceactiontds - weekly update - bitcoinGood Day and I hope you are well.
#btcusd - bitcoin
comment: Neutral since bears fumbled it again. Range is clear, don’t have much else to say about this. Bulls want 113k+ and bears need a strong daily close below 100k for more downside.
current market cycle: trading range
key levels: 100k - 115k
bull case: Bulls are still hopeful, that’s why we are still above 110k but the next touch could break it and I doubt many will hold long or scale into new ones there. Best bulls can get right now is to go sideways for longer and stay above 100k. I mean… Staying above 100k is as bullish as it get’s if you be honest. Same as last week since nothing has changed for the bulls. Trading range since mid May.
Invalidation is a strong daily close below 100k
bear case: Bears fumbled it again. Strong daily close below 100k or we won’t go lower. Right now odds favor the bears to go down from 107k to 100k but need more selling pressure.
Invalidation is above 110k
short term: As neutral as can be.
medium-long term - Update from 2025-06-29: Strong daily close below 100k will be the confirmation for more downside. First target below 100k is 97k the breakout retest and after that is the 50% retracement around 93k. I have no bullish for the next weeks/months. Once the gap to 97k closes we are likely in a bear trend again and I expect to hit at least 85k over the summer.
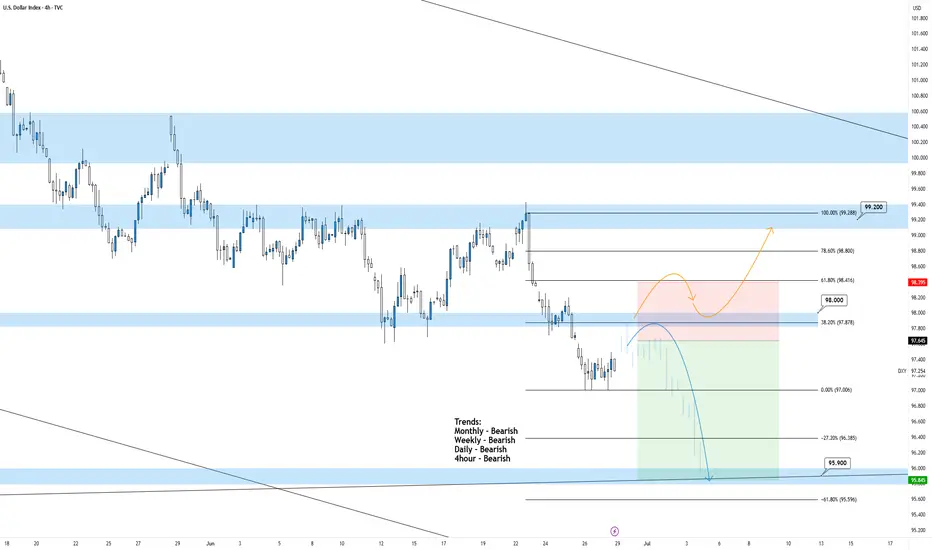
DXY 4hour TF - June 29th, 2025DXY 6/29/25
DXY Bearish Idea
All significant timeframes (monthly,weekly,daily 4hr) appear bearish for now.
Last week on June 25th, 2025 we saw price action break through our 98.000 zone confirming more bearish movement. This week we have two likely options that we will wait for confirmation on.
Bearish Continuation - Ideally we keep with the trend and look for lower highs below 98.000 for further confirmation. If we can spot rejection from this zone it is likely we will see DXY continue bearish for the week ahead.
Reversal - This is less likely but still possible. Price action could punch back through the 98.000 resistance and begin retesting previous highs. If this happens look for candlestick confirmation above 98.000 and expect a more bullish DXY for the week ahead.
GOLD recovers, capped by $3,350, trend viewOANDA:XAUUSD recovered then weakened as it failed to break above $3,350, supported by a weaker dollar and market uncertainty sparked by reports that U.S. President Donald Trump could replace Federal Reserve Chairman Jerome Powell in September or October. The reports raised concerns about the future independence of the Federal Reserve, boosting demand for safe-haven gold.
On Wednesday, Trump called Powell “terrible” and said he was considering three or four candidates to replace him. Meanwhile, the Wall Street Journal reported that Trump was even considering announcing a potential successor as early as September or October.
The current market narrative is that once Trump nominates a new Fed chair, market expectations will tend to favor a more “dovish” Fed. This could lead to a weaker US dollar, higher long-term US Treasury yields and higher stock prices.
Forexlive points out that this story may be more an emotional reaction than a result of objective and rational thinking. The policy of the FOMC (Federal Open Market Committee) is decided not only by the Fed Chairman but also by a majority vote of the 12 voting members (including 7 directors and 5 regional Fed presidents). The Fed Chairman does have a lot of influence, but he does not have absolute control over monetary policy. The Fed was originally designed to be independent of political pressure.
Moreover, even if Trump nominates the next chairman, there is no guarantee that this will automatically lead to a rate cut. In fact, Powell was also nominated by Trump, but his monetary policy decisions are still based on professional judgment rather than serving Trump's wishes.
So, in the worst case, the market could face policy uncertainty as differences between FOMC members increase and more disagreements emerge. Currently, there are fewer moderate members on the committee, while neutral or hawkish members dominate.
Markets are now focused on personal consumption expenditure (PCE) data due later today (Friday) for further clues on whether the Federal Reserve will cut interest rates.
On the geopolitical front, a ceasefire between Israel and Iran appeared to be in place on Wednesday after Trump hailed a swift end to the 12-day conflict at the NATO summit and said he would seek a commitment from Iran to abandon its nuclear ambitions in talks next week.
Technical Outlook Analysis OANDA:XAUUSD
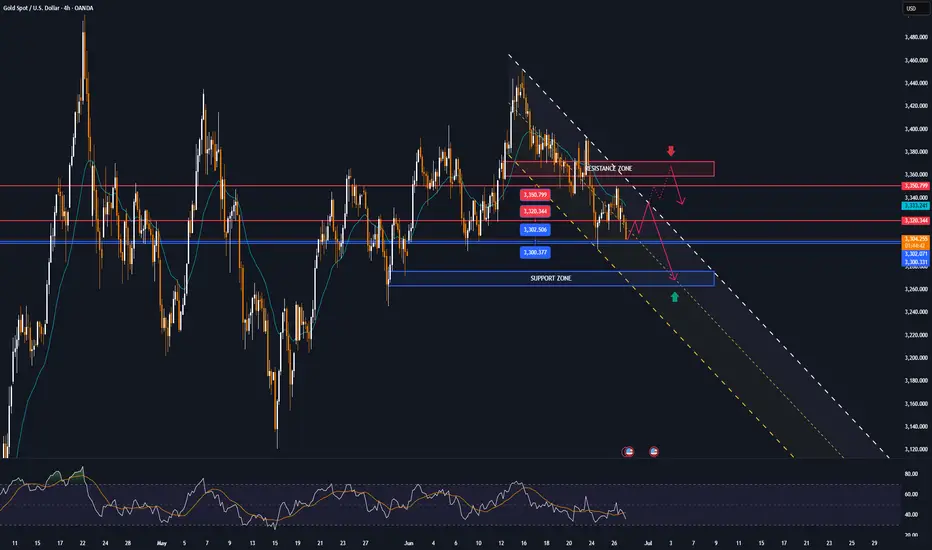
On the daily chart, after gold recovered and reached the initial target at 3,350 USD, the nearest resistance is also the price point of the EMA21 noted for readers in the previous publication.
However, the recovery momentum is currently weakening, specifically at the time of writing, the gold price is falling below 3,320 USD. Gold falling below 3,320 USD provides conditions for a possible decline with the next target around 3,302 - 3,300 USD, which is the area of the 0.382% Fibonacci retracement confluence with the lower edge of the price channel.
In terms of momentum, the RSI is heading down and breaking below 50, which should be considered an initial bearish signal.
Overall, gold does not have a clear long-term trend as the uptrend is still the main trend, while the momentum is showing signs of decline.
But personally, I am still leaning towards the uptrend, and continue to look for positions to buy.
Finally, the notable positions will be listed as follows.
Support: 3,302 – 3,300 USD
Resistance: 3,320 – 3,350 – 3,371 USD
SELL XAUUSD PRICE 3367 - 3365⚡️
↠↠ Stop Loss 3371
→Take Profit 1 3359
↨
→Take Profit 2 3353
BUY XAUUSD PRICE 3272 - 3274⚡️
↠↠ Stop Loss 3268
→Take Profit 1 3280
↨
→Take Profit 2 3286
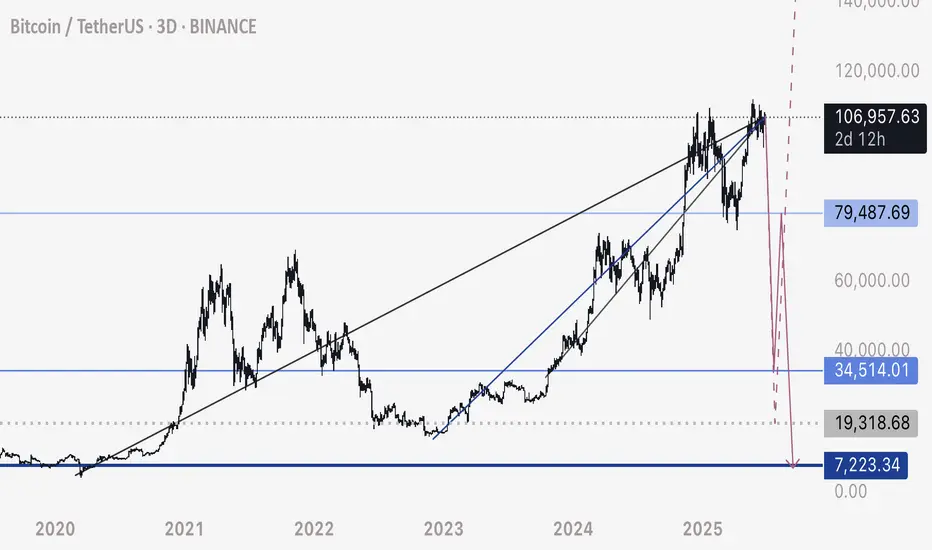
Why BTC hasn’t moved up recentlyBTC has been bobbing above and below this bearish triple crossover the past few months. What we see as consolidation is rather price getting stuck around these resistance levels.
The only reason why this would be occurring in my view, is due to the market makers having intention to allow this drop to play out.
The resistance is located at around 107,000 to 107,400 - watch this zone closely for a hold below / rejection and fast drop.
Scenario 1 marked with solid red line.
Scenario 2 marked with dotted red line.
Little update for y’all. Happy weekend trading.
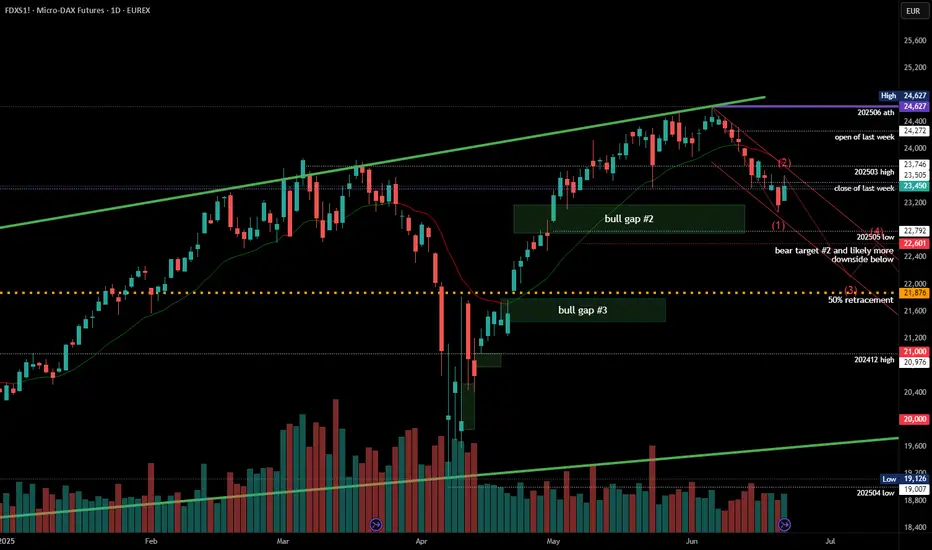
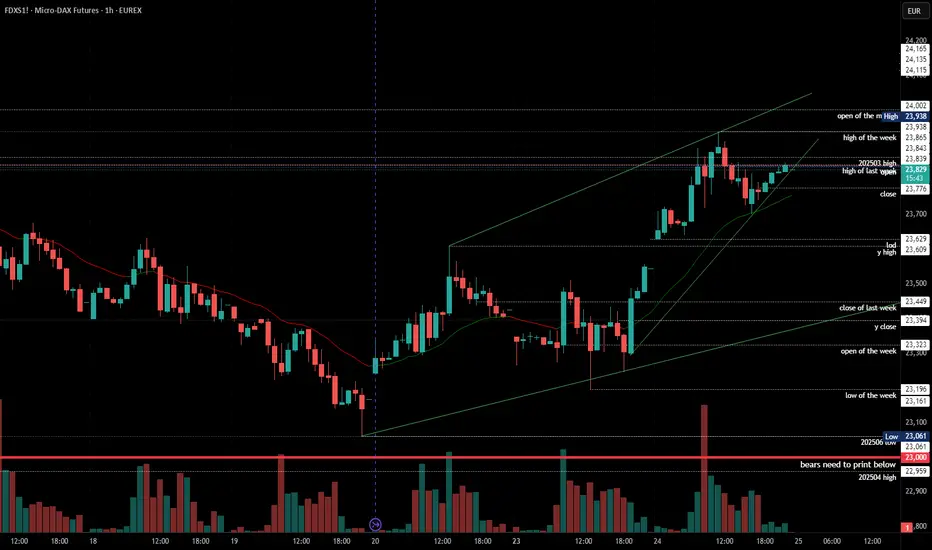
2025-06-26 - priceactiontds - daily update - daxGood Evening and I hope you are well.
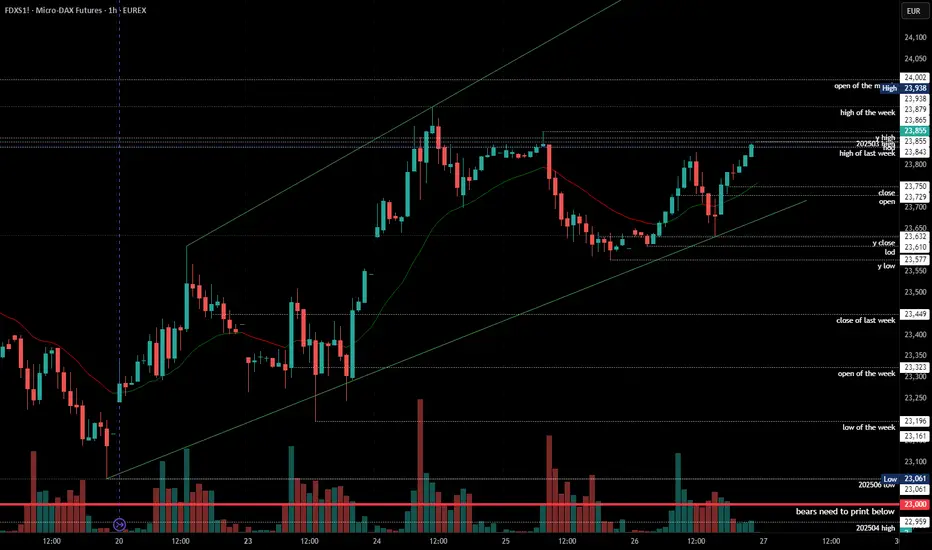
comment: Is this a bigger two-legged pullback to the 4h ema and now we strongly break above 23900 to go for 24200+ again? It’s my most likely case. It’s still not a good trade to buy above 23800 since that trapped you two times this week for 230 and 300 point pullbacks.
current market cycle: broad bull channel on the weekly chart. Daily chart is in a trading range 23000 - 24500
key levels: 23500 - 24500
bull case: Everything aligns for the bulls. They need the breakout above Tuesday’s high and then we go for the obvious big round number 24000 but I doubt we will stop here. Once the bears who sold above 23800 this week give up, I doubt there will be much resistance until maybe 24300 or higher. Anything below 23600 would be a huge bear surprise tomorrow and my bullish bias is likely wrong.
Invalidation is below 23000.
bear case: Bears don’t have much until they print below 23600 again. Can they hold the market below 24000 and keep this trading range alive? I doubt it. Bears tried 3 times this week and the bull gap to 23550 stayed open.
Invalidation is above 24100.
short term: Bullish. Still expecting 24000 and no print below 23600 tomorrow. Everything else would be a big bear surprise and we could go much lower than 23500 but this is the most unlikely scenario.
medium-long term from 2025-06-22: New bear trend has likely started on 2025-06-05 and we saw W2 conclude on Friday. Daily close below 23000 will be the confirmation for the bears and I have drawn 2 potential final W5 targets. I have written that we will see 20000/21000 again over the summer for many weeks/months now, this even is just another excuse for “analysts” to justify the move down.
trade of the day: Longs close to 23600 were the obvious trade today. The selling for 198 was at least 100 points stronger than I expected and stopped me out but I immediately went long again on the very strong buying below 23650 and closed the day with profits.
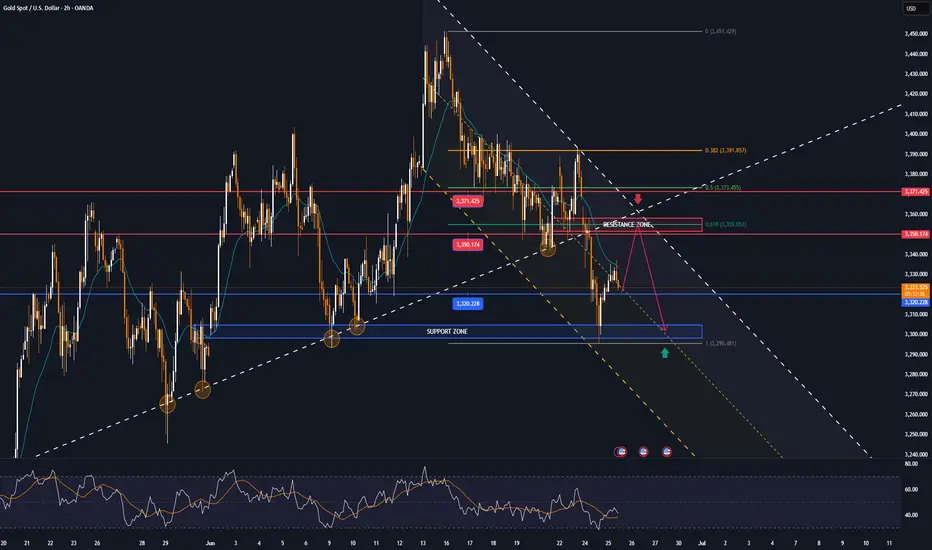
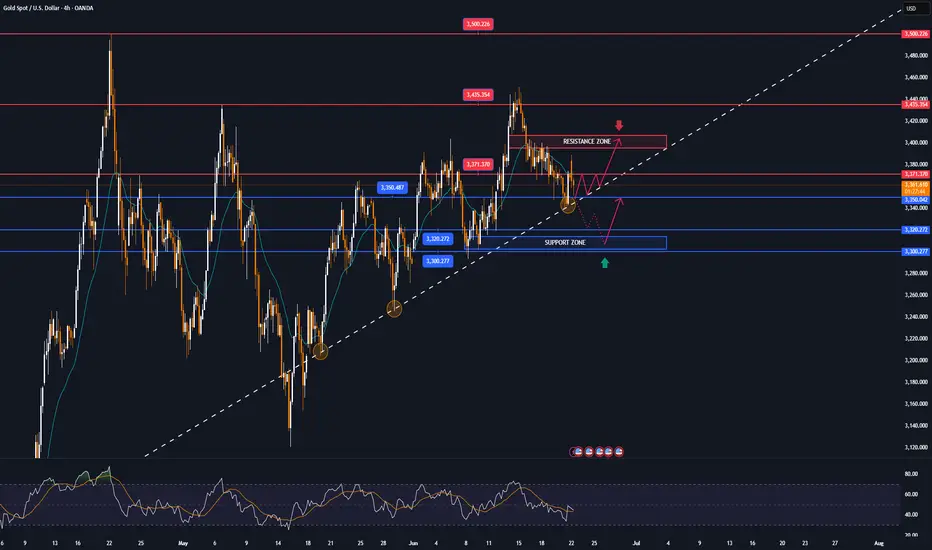
GOLD recovers from around $3,300 area, short-term targetsOANDA:XAUUSD has recovered slightly and is currently trading around $3,332/oz, supported by a decline in the US dollar and US bond yields. The market is closely watching the fragile ceasefire between Israel and Iran.
The US Dollar Index TVC:DXY is near a one-week low, making dollar-priced gold more attractive to holders of other currencies. The benchmark 10-year US Treasury yield is holding near its lowest in more than a month.
As the conflict between Israel and Iran ends, geopolitical risk levels have disappeared, safe-haven funds have flowed back and thus gold is under pressure.
From a more macro perspective, gold remains in an uptrend and real yields are expected to fall further amid continued Fed easing. In the short term, if the market reprices rate cut expectations to become hawkish, this could trigger a technical correction in gold.
Economic data in the coming months will be particularly important for the gold market. If inflation data remains weak or the labor market deteriorates further, Fed officials could cut rates sooner or more significantly than expected.
A ceasefire between Iran and Israel brokered by U.S. President Donald Trump appeared to have taken effect on Wednesday, a day after both countries signaled a temporary end to their conflicting air strikes.
WASHINGTON (Reuters) - U.S. consumer confidence unexpectedly fell in June, reflecting growing concerns among households about job prospects and another sign of a weakening labor market amid uncertainty over Trump’s tariffs.
Federal Reserve Chairman Jerome Powell told Congress on Tuesday that higher tariffs could start to push up inflation this summer, a key period when the Fed considers whether to cut interest rates.
Traders of federal funds futures are currently pricing in a cumulative 60 basis points of rate cuts through 2025, with the first cut likely to come in September.
Technical Outlook Analysis OANDA:XAUUSD
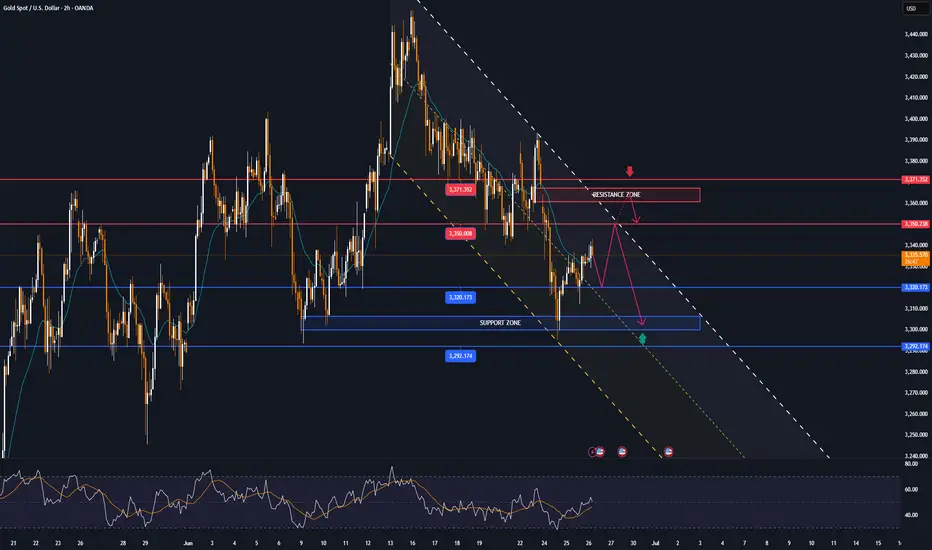
Gold has recovered slightly after testing the important support area noted by readers in yesterday's edition, around the raw price point of $3,300. However, the temporary recovery is being limited by the EMA21 moving average, followed by the 0.236% Fibonacci retracement level, which can also be considered as upside targets for the time being.
In terms of overall structure, gold is still in an uptrend with the price channel as the main trend. On the other hand, RSI is also hovering around 50, indicating that the market sentiment is still hesitant and does not have enough momentum for a complete trend.
Intraday, gold still has a bullish technical outlook, but a sell-off that takes gold below the 0.382% Fibonacci retracement level would be a bearish signal in the near term. Therefore, long positions should be opened near the $3,300 area, with protective levels behind the 0.382% Fibonacci retracement.
Notable positions will also be listed as follows.
Support: $3,320 – $3,300 – $3,292
Resistance: $3,350 – $3,371
SELL XAUUSD PRICE 3367 - 3365⚡️
↠↠ Stop Loss 3371
→Take Profit 1 3359
↨
→Take Profit 2 3353
BUY XAUUSD PRICE 3301 - 3303⚡️
↠↠ Stop Loss 3297
→Take Profit 1 3309
↨
→Take Profit 2 3315
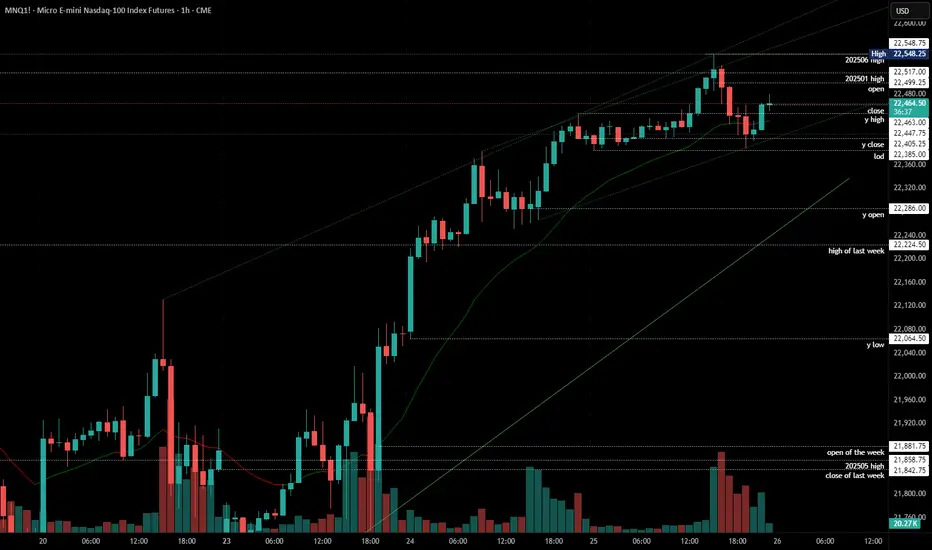
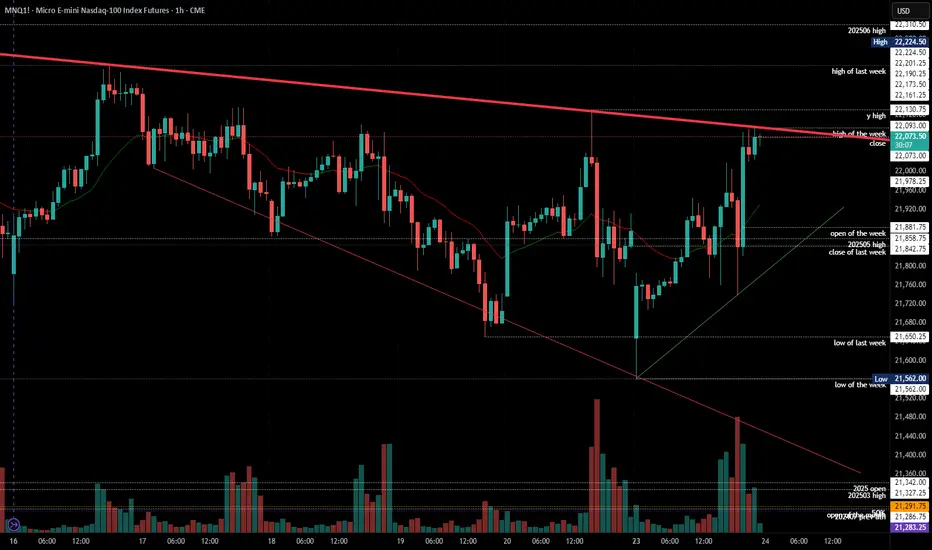
2025-06-25 - priceactiontds - daily update - nasdaq e-mini
Good Evening and I hope you are well.
comment: Market is leaving behind gaps and breakout prices are tested but we stay above. Also higher highs and higher lows. Max bullish for new ath still.
current market cycle: trading range
key levels: 21500 - 22300
bull case: Bulls want 23000. They have to keep it above 22400 to keep the max bullish momentum going for tomorrow. Below 22400 we could test down to 22200 before another leg up. Multiple way to draw the trend lines, all are correct until broken. So draw them and watch what market does when it gets near them.
Invalidation is below 22200.
bear case: Bears actually made money selling 22500, which was a surprise to me. Especially that we stay below the open price. Bad session for me today. I still got nothing for the bears until they print below 22200 again. Everything on this chart is bullish. Best bears can hope for is another pullback below 22500 and go sideways.
Invalidation is above 22550.
short term: Max bullish for 22800 or 23000.
medium-long term - Update from 2024-06-22: Daily close below 21500 is my validation for the new bear trend which has the first bigger target at 21000 but I think we will printed below 20000 again this year. Structure is obviously not yet bearish, so don’t be early if you want confirmation and can’t/won’t scale in to shorts higher. Getting into longer term shorts above 21500 seems like the banger trade right now.
trade of the day: Buying the double bottom 22390 or any long close to it. Wasn’t the trade with most profit but the most obvious one.
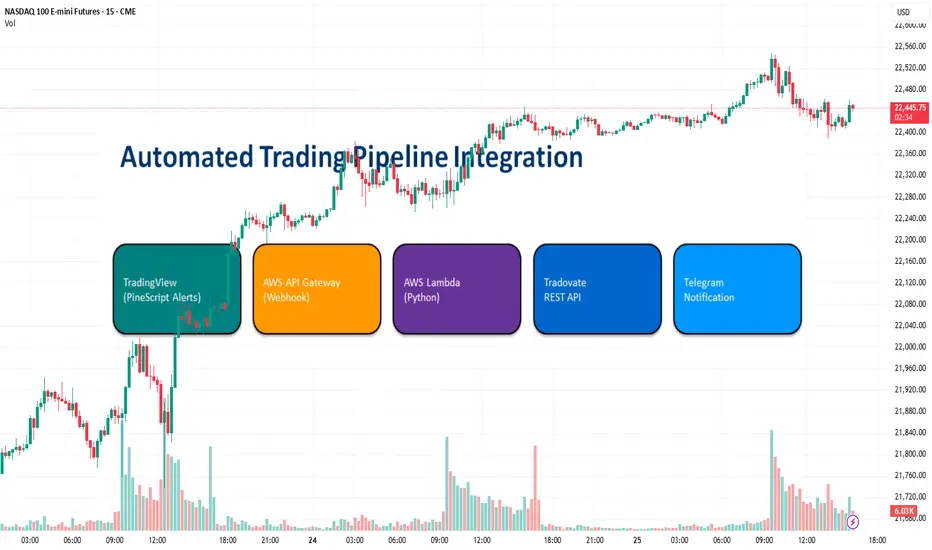
Automating Your Trading Pipeline: Series Overview
Hello fellow traders!
Over the next week I’ll be rolling out a short series on how to take your TradingView alerts all the way through to live orders—fully automated—using AWS and the Tradovate API.
Today’s post is just the big-picture overview. In the days ahead we’ll peel back the layers and show you exactly how each piece fits together:
TradingView PineScript Alerts: how to craft alert payloads in Pine.
AWS API Gateway web-hook: receiving and validating your alerts.
AWS Lambda Python – processing payloads & calculating SL and TP.
Tradovate REST API – placing bracket (OCO) orders.
Telegram Notifications – real-time trade confirmations to your phone.
At the end of this series you’ll have a fully-automated end-to-end pipeline, no more manual order entry!
Stay tuned for Part 2 , when we’ll dive into crafting precise JSON alerts in PineScript.
How to Spot Head & Shoulders Patterns in TradingViewDiscover how to identify and validate Head & Shoulders patterns using TradingView's built-in pattern recognition tools in this detailed tutorial from Optimus Futures. Chart patterns are essential tools for many futures traders, and the Head & Shoulders formation is among the most recognized reversal patterns in technical analysis.
What You'll Learn:
• Understanding the Head & Shoulders pattern: a key reversal formation in technical analysis
• How to access and use TradingView's pattern drawing tools and objects
• Step-by-step process for identifying potential Head & Shoulders formations on any timeframe
• Techniques for spotting the "head" by locating the highest high or lowest low pivot points
• How to identify matching "shoulders" on either side of the head formation
• Validating your pattern identification using TradingView's drawing tools
• Real-world example using crude oil futures on an hourly chart from October 2024
• Key characteristics that distinguish bearish Head & Shoulders reversal patterns
• Best practices for using pivot points and swing analysis in pattern recognition
This tutorial may benefit futures traders, swing traders, and technical analysts who want to improve their chart pattern recognition skills in TradingView. The techniques demonstrated could help you identify potential reversal opportunities and make more informed trading decisions when these classic formations appear on your charts.
Keywords: Head and Shoulders pattern, TradingView tutorial, chart patterns, technical analysis, reversal patterns, futures trading, pivot points, swing analysis, pattern recognition, trading education
Visit Optimus Futures to learn more about trading futures with TradingView:
optimusfutures.com
Disclaimer:
There is a substantial risk of loss in futures trading. Past performance is not indicative of future results. Please trade only with risk capital. We are not responsible for any third-party links, comments, or content shared on TradingView. Any opinions, links, or messages posted by users on TradingView do not represent our views or recommendations. Please exercise your own judgment and due diligence when engaging with any external content or user commentary.
This video represents the opinion of Optimus Futures and is intended for educational purposes only. Chart interpretations are presented solely to illustrate objective technical concepts and should not be viewed as predictive of future market behavior. In our opinion, charts are analytical tools—not forecasting instruments. Market conditions are constantly evolving, and all trading decisions should be made independently, with careful consideration of individual risk tolerance and financial objectives.

GOLD recovers from 2-week low, short-term neutral biasOANDA:XAUUSD hit a two-week low in yesterday's trading session before recovering, currently trading around $3,330/oz, up slightly by about 0.14% on the day.
The main reason was the ceasefire between Iran and Israel, which curbed demand for safe-haven gold. In addition, Federal Reserve Chairman Powell made hawkish comments, which also affected the gold price trend.
Israel and Iran reach ceasefire agreement
A ceasefire came into effect on Tuesday under pressure from US President Donald Trump, raising optimism that the biggest military conflict between the two arch-rivals in the Middle East may be coming to an end.
The easing of tensions in the Middle East has been a major factor in the pressure on gold. Risk sentiment has weakened and the market has entered risk-on mode.
US President Trump announced on Monday evening that Israel and Iran had reached an agreement on a “complete and total ceasefire”. Iran’s state TV officially announced on Tuesday that Iran had ceased fire with Israel.
Israeli Defense Minister Israel Katz announced earlier Tuesday that the Israeli military would launch a new wave of strikes on targets in Tehran in retaliation for Iran's missile launch and "blatant violation" of the ceasefire.
The Israeli government said that Israel would hold off on further strikes on Iran after Prime Minister Benjamin Netanyahu spoke with US President Trump.
Powell sends important signal
Federal Reserve Chairman Powell will testify before the House Financial Services Committee on Tuesday and deliver a report on the Fed’s monetary policy. Powell will also testify before the Senate Banking Committee today (Wednesday).
In congressional testimony on Tuesday, Powell said the Fed needs more time to see whether tariffs are causing inflation to rise further before considering cutting interest rates.
In congressional testimony, Powell said he and most Fed officials expect inflation to rise soon and that the Fed is in no rush to cut rates before then.
“We are now in a very good position to wait and see what the likely path of the economy is before considering whether to adjust the policy stance,” Powell said.
Markets generally believe that the July 29-30 meeting is unlikely to result in a rate cut, with the first rate cut expected in September.
Technical Outlook Analysis OANDA:XAUUSD
With the current technical position, gold has not yet had a complete short-term trend as the price action is still around the EMA21 moving average, and the RSI is operating around the 50 level.
With the current price action showing that the market is still hesitant, gold may enter a sideways accumulation phase.
However, in terms of the long-term trend, gold is still in a long-term uptrend channel with the case for a complete downtrend to occur is the condition that the price action is taken below the raw price point of 3,300 USD. Then the downside target is the 0.50% Fibonacci retracement level in the short term.
During the day, the trend of gold is neutral with the expected operating range between 3,350 – 3,300 USD.
Notable positions will also be listed as follows.
Support: 3,320 – 3,300 USD
Resistance: 3,350 – 3,371 USD
SELL XAUUSD PRICE 3349 - 3347⚡️
↠↠ Stop Loss 3353
→Take Profit 1 3341
↨
→Take Profit 2 3335
BUY XAUUSD PRICE 3301 - 3303⚡️
↠↠ Stop Loss 3297
→Take Profit 1 3309
↨
→Take Profit 2 3315
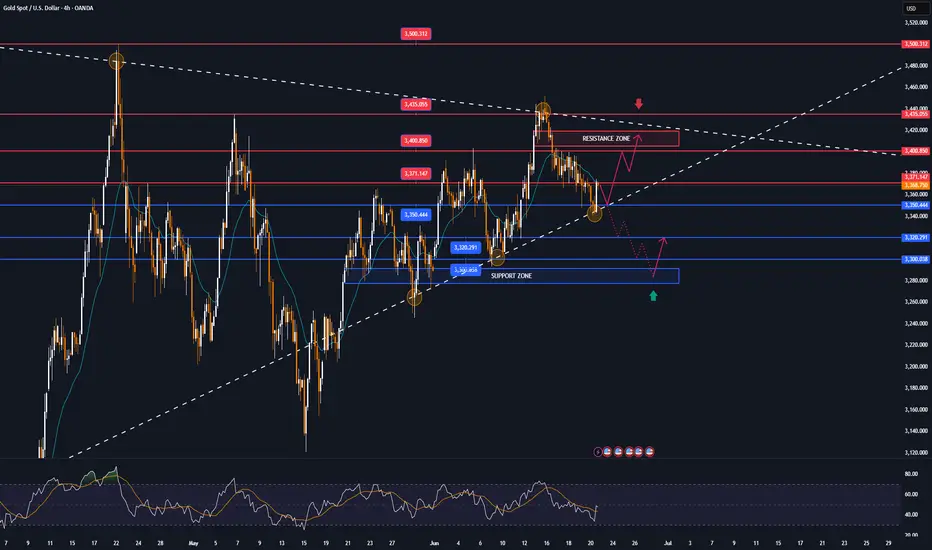
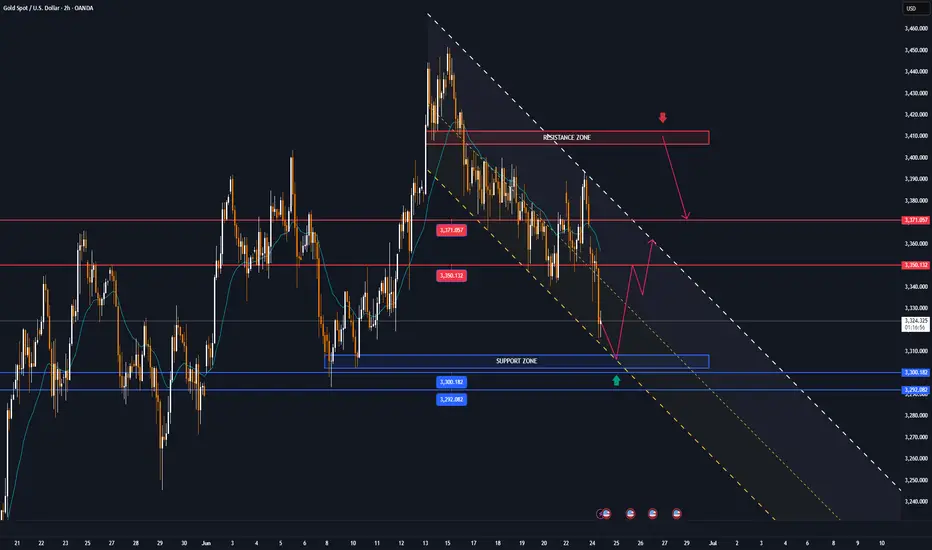
GOLD MARKET ANALYSIS AND COMMENTARY - [Jun 23 - Jun 27]This week, after opening at $3,369/oz, OANDA:XAUUSD prices fluctuated within a fairly narrow range, from only $3,340-$3,374/oz, and closed at $3,368/oz. The fact that gold prices closed this week close to the opening price shows that investors are hesitant in the current context.
The reason why gold prices are still fluctuating within a narrow range this week is because US President Donald Trump gave Iran a 2-week deadline to consider negotiating an end to the conflict with Israel, even though the Israel-Iran conflict is still raging.
In addition, on June 12, the Fed kept interest rates unchanged at 4.25% - 4.5%, while adjusting its forecast for US GDP growth lower and raising its estimate for near-term inflation. Fed Chairman Jerome Powell acknowledged that tariffs would push up prices and weigh on economic activity. Although two rate cuts are expected before the end of the year, Powell said the Fed may wait for more clarity before cutting rates.
Next week, the Fed Chairman will hold two semiannual monetary policy hearings before the US House and Senate committees on Tuesday and Wednesday. If Fed Chairman Powell hints at a rate cut in September 2025, the USD could fall against other major currencies, causing gold prices to rise next week. Conversely, if the Fed Chairman emphasizes that they will continue to prioritize controlling inflation and is in no hurry to cut interest rates, the USD will rise, thereby pushing gold prices down next week.
📌Technically, the gold price on the H4 and D1 charts is stuck between the range of 3295-3450, which is an important support level around 3295, and the resistance level at 3450.
The current price is moving sideways and accumulating in smaller time frames, and the trend has not been clearly defined when it has not broken through the above two resistance levels.
There are two scenarios for gold.
In the long-term framework, if it breaks through the 3450 zone and breaks the trend at the same time, it is expected that the gold price will set a new high.
In the case that the gold price trades below the 3300 round resistance, and at the same time the 3295 support zone is broken, it is easy to form a head and shoulders pattern on the H4 chart.
Notable technical levels are listed below.
Support: 3,350 – 3,320 – 3,300USD
Resistance: 3,371 – 3,400 – 3,435 – 3,500USD
SELL XAUUSD PRICE 3412 - 3410⚡️
↠↠ Stop Loss 3416
BUY XAUUSD PRICE 3294 - 3296⚡️
↠↠ Stop Loss 3290
2025-06-24 - priceactiontds - daily update - daxGood Evening and I hope you are well.
comment: Market stalled exactly at the 50% retracement from the bear leg 24627 down to 23061. I highly doubt we top out here but 24000 is a possible target for the high. Issue for the bears is that this is as bullish as it get’s right now. All markets printing big green candles and bears gave up. US markets are heading for new ath and they will likely print new ones this week. So thinking about topping out is dumb as of now. Will only look for longs closer to the 1h ema until we see much much bigger selling pressure and prices below 23500.
current market cycle: broad bull channel on the weekly chart. Daily chart is in a trading range 23000 - 24500
key levels: 23500 - 24000
bull case: Big Globex gap up, retest and go. Market is leaving gaps below and until they close, we are in a max bullish market. 24000 is the obvious target but we can do more. Any pullback now has to stay above 23700 or bears might come around again.
Invalidation is below 23000.
bear case: There is a tiny chance for the bears that this is just a retest of 24000 and the breakout price area and also the daily 20ema. Tiny. Don’t bet on it. You can not look for shorts until we close the next gap down to 23550ish.
Invalidation is above 24100.
short term: Bullish af. 24000 I see as given unless a newsbomb hits. Market should not drop below 23690 if bulls want to continue higher.
medium-long term from 2025-06-22: New bear trend has likely started on 2025-06-05 and we saw W2 conclude on Friday. Daily close below 23000 will be the confirmation for the bears and I have drawn 2 potential final W5 targets. I have written that we will see 20000/21000 again over the summer for many weeks/months now, this even is just another excuse for “analysts” to justify the move down.
trade of the day: Long on Globex or buying pullbacks near the 15m or 60m ema. All were profitable at least for scalps. When you see this much buying during Globex session and a perfect double bottom above a big bull gap, chances that this day is bearish are abysmally low so don’t look for shorts.
GOLD falls after Trump's statement, but skepticism remainsOn Tuesday (June 24) in the Asian market, spot OANDA:XAUUSD continued to decline. The current price of gold is around 3,340 USD/ounce, down sharply by about 30 USD. Gold traders are awaiting congressional testimony from Fed Chairman Jerome Powell as the ceasefire between Iran and Israel takes place.
On Monday evening local time, US President Trump announced that Israel and Iran have reached a complete agreement to achieve a comprehensive ceasefire. After Trump announced the news, spot gold prices fell sharply by more than 30 USD in the early morning trading session in Asia on Tuesday, which lasted until the time of writing.
Federal Reserve Chairman Jerome Powell will deliver his semiannual monetary policy report before the House Financial Services Committee on Tuesday.
Looking ahead, all eyes will be on Federal Reserve Chairman Jerome Powell’s two-day congressional testimony starting on Tuesday for fresh clues on the timing of the next rate cut.
The market is now pricing in a 21% chance of a Fed rate cut next month, up from a 14.5% chance on Friday, according to CME Group’s FedWatch tool.
Additionally, markets will continue to closely monitor the Iran-Israel conflict to see if the ceasefire can hold. The Israeli military continues to report that Iran has launched ballistic missiles into Israel.
Technical Outlook Analysis OANDA:XAUUSD
Gold is down and operating around the EMA21 moving average and technically, gold is currently in the best support area. Specifically, gold is operating at the EMA21, the technical indicator is noted as an important support for the short-term uptrend, followed by the horizontal support of 3,320 USD. Combined with the price action position, the Relative Strength Index (RSI) is above 50, and 50 is now acting as a support in terms of momentum for the possibility of price increase.
However, if gold sells below the 0.382% Fibonacci retracement level, it could be bearish, with the next target being the 0.50% Fibonacci retracement level at $3,228. Therefore, the area of the $3,300 base point is a very important support area for the long-term uptrend.
Intraday, with the current position, gold can still increase in price with the short-term target at $3,371 followed by the $3,400 base point.
Notable positions will also be listed as follows.
Support: $3,300 – $3,292
Resistance: $3,350 – $3,371
SELL XAUUSD PRICE 3407 - 3405⚡️
↠↠ Stop Loss 3411
→Take Profit 1 3399
↨
→Take Profit 2 3393
BUY XAUUSD PRICE 3304 - 3306⚡️
↠↠ Stop Loss 3300
→Take Profit 1 3312
↨
→Take Profit 2 3318
Gold GC1! heading to $3,476 next with a 4.15R long trade TVC:GOLD Gold/ COMEX:GC1! hit the 0.705 fib level right between the 0.618 and 0.786 what I like to call the sweet spot for fibonacci tools. If it misses the 0.618 then the 0.705 is just as good, signals are showing a bottom forming and slowly but sure the rsi is about to cross up over 50, it should pump hard this time
-4.15R trade
-1.5% capital risk
-as soon as gold starts to move, we'll drag our stop loss to or even past break even if it really pops up hard...

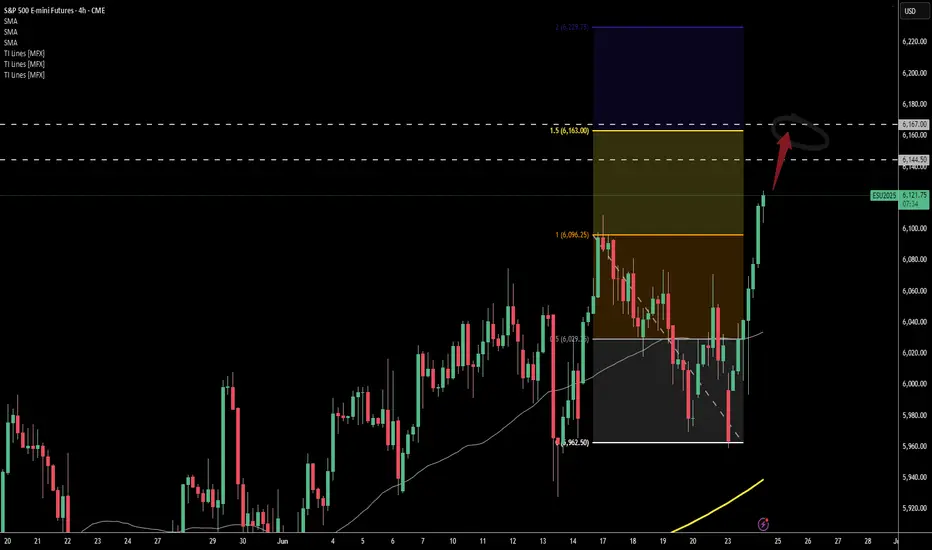
PREVIEW LONDON SESSION - Tue 24th June 2025 --- LONGWe had one demand filled day.
And I don't see it stopping. We have blown through 100 and 125 projections and I predict 150 will be reached soon. SO, after london open I will be looking for LONG discounts on the 5m/15m charts and targeting 6162.50 (poc strike) that coincides with 150 (PINS OFF) projection.
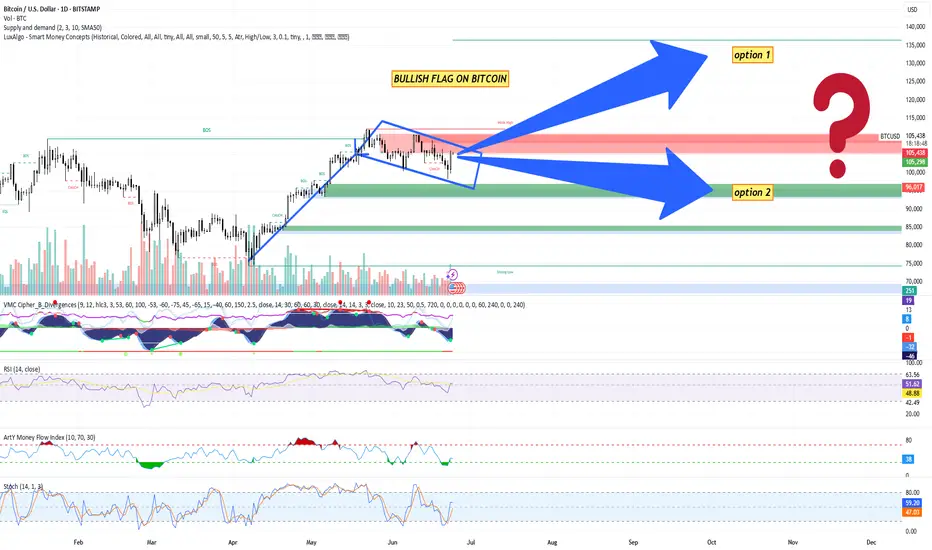
Bitcoin (BTC/USD) Technical Analysis + trade planBitcoin (BTC/USD) Technical Analysis – June 24, 2025
Pattern Identified: Bullish Flag Formation
A clear upward impulse leg followed by a downward-sloping consolidation (flag) indicates a continuation pattern.
The flag is bounded within a descending parallel channel, suggesting a potential breakout to the upside.
Break of Structure (BOS): Multiple BOS signals indicate strong market structure shifts favoring bullish continuation.
Change of Character (CHOCH): Minor CHOCH noted inside the flag, indicating local liquidity grabs but no trend reversal yet.
Key Levels
Current Price: ~$105,126
Flag Resistance: ~$105,291 (watch for breakout)
Major Supply Zone (Resistance): ~$115,000 (red zone)
Demand Zones (Supports):
$96,000 (minor)
$85,000 (medium strength)
$75,000 - $70,000 (strong low / high-confluence area)
Volume Analysis
Declining volume during flag formation supports the bullish flag hypothesis (low-volume pullback).
Anticipate increased volume on breakout for confirmation.
Indicators Summary
1. VMC Cipher B
Green dots signal potential local bottoms.
Wave trends support bullish reversal setup, though momentum still neutral.
2. RSI (14)
Current RSI: ~50.76
Neutral zone; not overbought/oversold – provides room for upside movement.
3. Money Flow Index (Art’y)
Positive inflow recovering, signaling accumulation phase.
4. Stochastic RSI
Blue line crossing above orange around 46. Indicates bullish crossover from the oversold region – early entry signal.
Bitcoin Trading Plan
Trading Bias: Bullish (Contingent on Flag Breakout)
Entry Plan
Breakout Entry: Enter long above $105,300 with confirmation (4H or daily candle close).
Aggressive Entry: Pre-breakout entry inside the flag at ~$104,000–$105,000, anticipating breakout.
Stop Loss
Conservative: Below $96,000 (below key support + 50 SMA).
Aggressive: Below $102,500 (inside flag, tighter stop).
Take Profit Levels
TP1: $110,000 (local high)
TP2: $115,000 (strong resistance zone)
TP3: $123,000–$125,000 (measured move from flag breakout target)
Measured Move Target: Height of the pole ($25K) added to the breakout zone ($105K) = Target zone: $130,000 (theoretical).
Alternative Scenario – Bearish Breakdown
If BTC breaks below $96,000, the bullish structure is invalidated.
In that case:
Look for short entries below $95,500.
Target zone: $85,000 – $75,000.
SL above $98,000.
Risk Management Guidelines
Risk per trade: 1–2% of capital
Use position sizing tools to determine trade size.
Monitor macroeconomic news (Fed, inflation, ETF flows) and crypto market sentiment.
To sum up things:
BTC is consolidating within a textbook bullish flag.
Momentum indicators align with a potential breakout.
Caution warranted until clear breakout occurs – volume confirmation is key.
Keep alert for fakeouts due to low summer volatility.
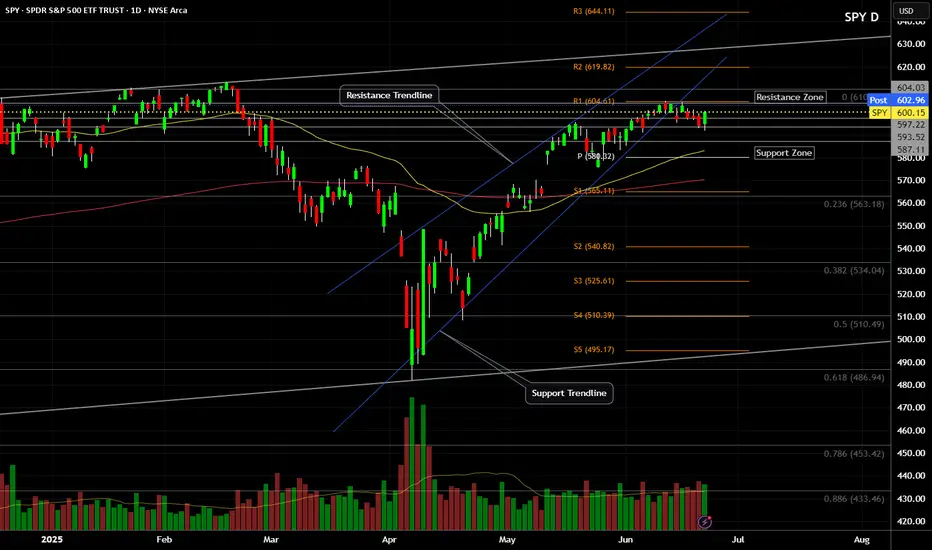
SPY (S&P500 ETF) - Price Bouncing Up from Support after NewsSPY (S&P500 ETF) price has bounced up from the $593 support level after recent global news (de-escalation news).
Price action has slowed and consolidated in June 2025, and the S&P500 is still maintaining a price uptrend.
The 50EMA and 20EMA Golden Cross is still active and in progress (since May 2025).
The next stock market earnings season is not for another 3 months. Inflation, interest rate news, global events, government news, corporate news will continue to affect price volatility this summer.
Resistance Levels: $604, $610, $612, $619.
Support Levels: $600, $593, $586, $579.
2025-06-23 - priceactiontds - daily update - nasdaq e-miniGood Evening and I hope you are well.
comment: Not even the US President joining a war can start the selling. Truly a special time. Above 22130 there is no reason this can’t test 22300 or higher. Market clearly does not care about the event and the pain trade seems up. Can’t hold bearish thoughts after today’s reversals. Very small chance that if we stay below 22130, bears come around and we test down to 21800 or lower.
current market cycle: trading range
key levels: 21500 - 22300
bull case: Bulls had the following legs up today: 380, 260, 350 points from swing lows to highs. On such a day, this is as bullish as it gets. They now need to print a higher high and then there is no more obvious reason why we can’t test back up to 22300 or higher.
Invalidation is below 21900.
bear case: Bears vanished after the double bottom in the US session and market closed at the high. Which is worst case for bears. Above 21130 they have to cover and I expect an acceleration upwards. If they somehow come around strongly and we go below 21950, then chances are decent that we can test down to 21800 again. Bears need to sell it early tomorrow or the bear trend line is gone and we could go much higher.
Invalidation is above 22130.
short term: Neutral. Only interested in shorts if we stay below 22130. I still think markets are grossly miss-priced and complacent but for now that thesis is wrong.
medium-long term - Update from 2024-06-22: Daily close below 21500 is my validation for the new bear trend which has the first bigger target at 21000 but I think we will printed below 20000 again this year. Structure is obviously not yet bearish, so don’t be early if you want confirmation and can’t/won’t scale in to shorts higher. Getting into longer term shorts above 21500 seems like the banger trade right now.
trade of the day: Buying literally every dip was good.
Futures Watchlist for week ending 6/27/2025Come join as i go through the future tickers that im watching this week and where i see them going. With war talks filling up on social media this will add to our volatility and we will look at key levels to capitalize off of it! Let me know your thoughts on these tickers. Also let me know if there is another symbol futures or stocks that you want me to breakdown for you!

GOLD recovers market overview, key outlookOANDA:XAUUSD is under downward pressure, and ended last week's trading session with a decline. With tensions in the Middle East easing slightly and the Federal Reserve giving a hawkish signal, the safe-haven demand in the gold market tends to weaken, and investors' profit-taking intentions increase, these are the main reasons why gold recorded a significant correction this week.
Gold prices fell last week as safe-haven demand weakened as tensions in the Middle East temporarily eased. President Trump said he would decide on military action against Iran in the next two weeks, a concession that helped ease fears of an escalation. Although Iran continued to launch missiles at Israel, the situation has not spread. However, the Middle East conflict remains risky and is unlikely to end completely.
Gold prices are under pressure due to the Fed's hawkish tone. Although the Fed kept interest rates unchanged, Chairman Powell warned of inflation risks, especially from Trump's new tax policies. At the same time, Mr. Chris Waller's statement showed that the possibility of a July interest rate cut also depends on the inflation situation, causing market expectations to decrease and negatively affecting gold - a non-interest-bearing asset.
Central banks and institutions maintain bullish medium- and long-term expectations
Despite short-term pressures, most institutions maintain positive medium-term expectations for gold. Goldman Sachs reiterated its target of $4,000/oz by 2025, while Citigroup believes gold could fall below $3,000/oz by 2026.
Technical Outlook Analysis OANDA:XAUUSD
Gold has once again bounced from the EMA21 and reached its initial upside target at the 0.236% Fibonacci retracement of $3,371, as noted in previous editions. For now, for gold to qualify for its next upside target at the raw price of $3,400, it needs to sustain price action above the 0.236% Fibonacci level, which means the 0.236% Fibonacci level is also the closest resistance at present.
Once gold breaks above the raw price point of $3,400, it will be in a position to continue its short-term rally with a target of around $3,435, rather than the all-time high of $3,500.
In terms of overall structure, gold still has a bullish outlook with the price channel as the main trend and RSI remaining above 50 and well away from the overbought zone, suggesting that there is still plenty of upside ahead.
In the case of a sell-off, if gold is sold below the EMA21, it could test the $3,320 support in the short term, more so the 0.382% Fibonacci retracement level converging with the lower edge of the price channel. Therefore, early long positions may be considered in terms of volume as well as protection of open positions.
Finally, technically, gold is still trending with an overall bullish outlook, with notable positions listed as follows.
Support: $3,350 – $3,320 – $3,300
Resistance: $3,371 – $3,400 – $3,435 – $3,500
SELL XAUUSD PRICE 3406 - 3404⚡️
↠↠ Stop Loss 3410
→Take Profit 1 3398
↨
→Take Profit 2 3392
BUY XAUUSD PRICE 3312 - 3314⚡️
↠↠ Stop Loss 3308
→Take Profit 1 3320
↨
→Take Profit 2 3326
#202525 - priceactiontds - weekly update - dax futuresGood Day and I hope you are well.
comment: Full bear mode. Bulls tried 3 times to get some pullback going but only huge rejections on every try and since we have crossed the daily ema, we have not touched it or came close to it. Maybe we see some sideways movement around 23000 but given my uber bearish expectation due to US bombs on Iran, I can see a giant move down to 22000 and some stalling around it. Any price above 23700 means I am wrong and markets continue to ignore every risk under the sun.
1500 points down by the bears in two weeks is decent enough for a first leg. I market two potential W5 targets for the next weeks.
current market cycle: most likely new bear trend which can bring us to 21k or 20k over the next weeks
key levels for next week: 22000 - 23700
bull case: Can they try another “ignore the risk” move after the weekend news? I doubt it but anything can happen, so my invalidation for the bears is 23700. If they print it, we move sideways but I can not, for the life of me, see this printing new highs. If you are still holding long term longs on anything, I think you are late on running for the exit.
Invalidation is below 22900
bear case: Bears have been given another gift by orange face. The selling started two weeks ago, so it has nothing to do with Iran but it will likely help in confirming the trend and maybe accelerate it. The drawn channel is a rough guess for now. We have seen slow and steady liquidation the past 2 weeks and now we could see a shift to a huge “run for the exits” and type of “liberation-day” markets. 22000 is the big next target for bears since I expect 23000 or lower to get hit immediately on futures open.
Invalidation is above 23700
short term: Full bear mode. 23000 is almost a given and we could move quickly to 22000 over the next days. If we produce an island gap with the previous bull gap 22800-23100 (don’t take those numbers per tick value, this is not an exact science, many algos see the gap differently) it’s a huge confirmation and it could not be closed for months. If we do a big gap down and bulls close it, much less chance for the bears to continue down faster.
medium-long term from 2025-06-22: New bear trend has likely started on 2025-06-05 and we saw W2 conclude on Friday. Daily close below 23000 will be the confirmation for the bears and I have drawn 2 potential final W5 targets. I have written that we will see 20000/21000 again over the summer for many weeks/months now, this even is just another excuse for “analysts” to justify the move down.