HOOD (Robinhood) - Price Above Bollinger Band and Shooting StarsHOOD (Robinhood) stock price has been in an uptrend since May 2025.
Recent fundamentals such as corporate earnings, EPS, Revenue, Acquisitions have been good in Q2 2025.
However currently, HOOD price has printed 2 shooting stars above the upper bollinger band and linear regression lines (blue arrow).
Potential selling and profit-taking could occur, especially if there is a significant bearish catalyst or news in the stock market.
A -4% or -8% move selloff could occur over time if the price gaps up to an overextended level too fast, such as $80 to $85.
Both the weekly and daily charts are starting to show bearish divergence so I am watching both the technicals and fundamentals this month.
Futures

SPY (S&P500 ETF) - Price Attempting Breakout Above ResistanceSPY (S&P500 ETF) price is attempting to breakout above Daily resistance levels of $594 and $597.
SPY ETF has been in an uptrend since May 2025. A Golden Cross also occured on May 19th 2025, signaling that a potential longer term bullish rally could occur.
Friday's candle closed as a Doji signaling some potential indecision after recent price volatility.
SPY price is not at any extreme level on the Daily chart.
If SPY price ever gaps up and rallies up to the $612 to $620 resistance zone, price could sell off stronger (short-term).
In June 2025, trade deal and inflation news will most likely be the catalyst for further volatility, in addition to government news announcements.
#202523 - priceactiontds - weekly update - dax futuresGood Day and I hope you are well.
comment: Last week I wrongly wrote that earnings season will start in June, sorry about that. It’s mid July. So what to do at 24300? Market finds acceptance above 24000 but we have made 500 points to the upside in the past 3 weeks. At some point bulls will let it go and reality will set in. Market is holding above the daily 20ema and until that changes, bears are not favored for anything. Be that as it may, I would rather look for some short scalps closer to 24400/24500 than longing above 24200. For next week I expect 24500 to get hit again, as well as 24000. Anything below 23800 would be a huge surprise though.
current market cycle: bull wedge and on the weekly tf it’s a broad bull channel and we are at the very top
key levels for next week: 23000 - 25000
bull case: Nothing changed so my comment remains the same.
25000 is the next big round number but I highly doubt we get there. I was wrong last week and until we leave bear gaps behind us, bulls are favored for everything because the reality is that buying every dip has been profitable for months now. Bulls have to keep printing higher lows though.
Invalidation is below 23700
bear case: We are basically where we were one week ago, so my comment from last week also applies to the bears.
I doubt we have much more upside in store but we could very well spike to 25000 before we can expect more bulls to stop buying every dip. Bears get spikes and zero follow-through, which leads to many bear traps. Scalping both sides was fine the past 2 weeks but bears have to take quick profits or they vanish quickly. Bears need a daily close below 23700 for more downside and until then, swing shorts are account destroyers. We need a big gap down which does not close to stop the BTFD crowd. So if we get a decent one next week and market only corrects sideways, that will be the trigger for more selling.
One thing that changed is that the current wedge has not a lot more room to go and I think if bulls fail to print 25000 next week (will align with all markets ripping higher), they likely won’t get it,
Invalidation is above 24550
short term: Neutral. Still scalping both sides. Best bears can get is a trading range 23500 - 24500 and anything outside of this range is a surprise. 24550 and higher would be less of a surprise though.
medium-long term from 2025-05-25: My rough guess from early May was down over the summer and up into year end. POTUS certainly helped with the 50% tariffs. Markets were not positioned for any risk what so ever. Now we got the atomic trade bomb. This view has not changed, just the time horizon which aligns better with Q2 earnings and my expectation that we will see the tariff madness coming through. Markets can ignore risks for longer than you can maintain your account but that does not change the reality and if you think this tariff war has a happy ending, you have not paid attention to anyone but the US government or their echo chamber.
#202523 - priceactiontds - weekly update - nasdaq e-mini futuresGood Day and I hope you are well.
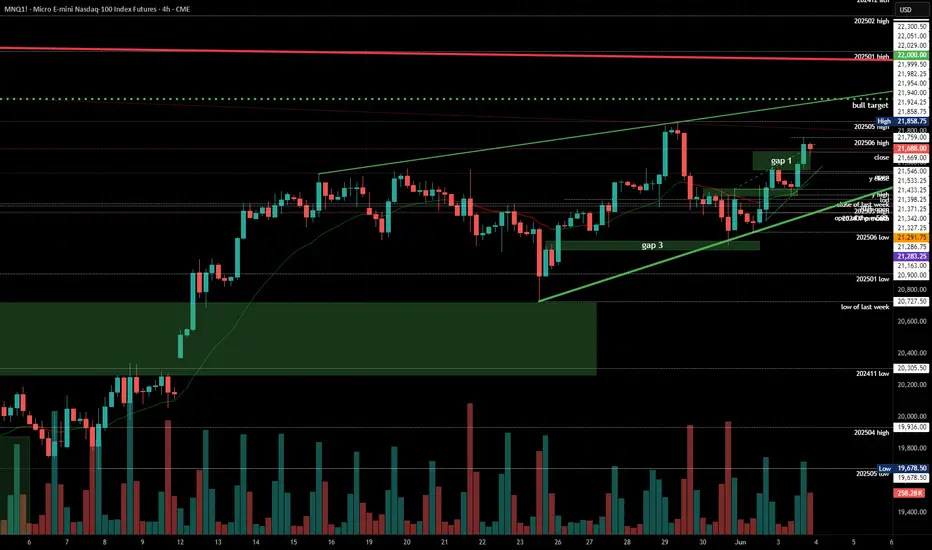
comment: Same as last week, markets are all very similar. Nq is also in a wedge right under the big round number. I doubt bears can prevent the bulls from printing 22000 but bulls have certainly tried long enough now. Either they get it next week, or it won’t happen for couple of weeks/months.
current market cycle: trading range on the weekly tf, bull wedge on the daily tf
key levels for next week: 20700 - 22000
bull case: Can bulls find enough buyers above 21900 next week to push for 22000 or even a new ath above 22656? Right now bulls are still favored for everything but that does not mean buying above 21500 is a good trade. If you were to buy right now at 21789, your stop has to be 21720 or better 21655. You would be buying at the very top of an ascending triangle we have been in since Thursday. It’s certainly not a good short but I wouldn’t buy it either.
Invalidation is below 21300
bear case: Bears need to close the gap down to 21300 and then we can talk about the highs being in, maybe. For now they fail at making lower lows and letting the bulls make higher highs. They are selling new highs but market is still grinding higher. For couple of weeks now I have been writing that for bears to change the character of the market, they would need a strong gap down or sell spike and leave an open gap. I do think it’s not bad by the bears that we have still not printed 22000, which everyone expected on Thursday but instead bulls had to give up again and we sold for 700 points. Long story short, bears have nothing and no one would be surprised if we print 23000 next week.
Invalidation is above 22100
short term: Neutral around 21800. Longs closer to the wedge trend line 21600 are likely decent. I expect at least 22000 to get hit before we could maybe turn. Most insane thing would be to see a giant melt-up next week and continuing for 23000 over the next 2-3 weeks. Certainly much higher possibility of that happening than a weekly close below 21000.
medium-long term - Update from 2024-06-07: Market is refusing to go down but I can not see this going much more up. Maybe we hit 22000 maybe we don’t. My assumption is still that latest around mid/end of July we begin to decline over the summer.
#202523 - priceactiontds - weekly update - wti crude oilGood Day and I hope you are well.
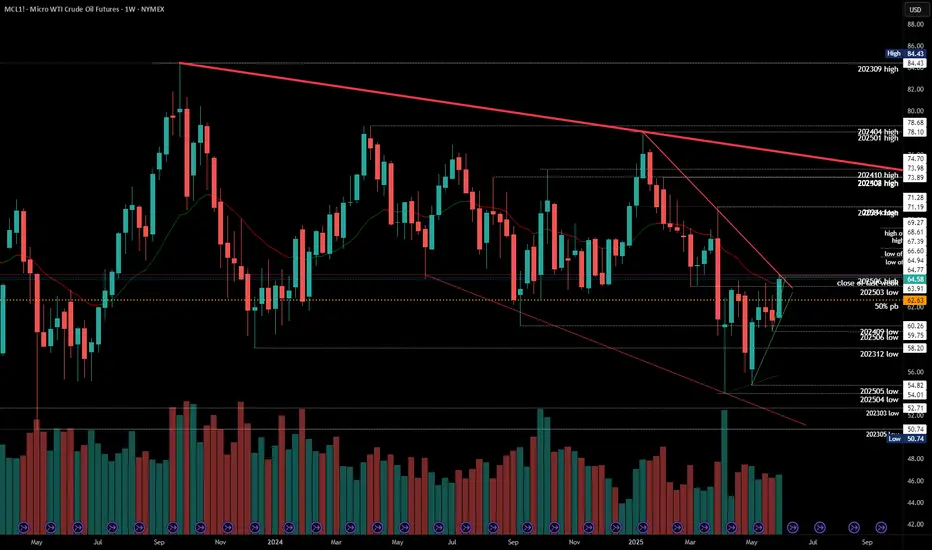
comment: Time to be very cautious as a bear and hopeful as a bull. 3 clear legs down and the third could not make a new low. Now the market closed at the weekly high and it’s a fitting place for a reversal. 65 should be the highest bears should allow it. If bulls get follow-through beyond, this is a buy with stop 59.5. The target above 65 is obviously 70 and maybe even the bigger bear trend line around 73.
current market cycle: monthly time frame is a broad bear channel - weekly tf is a bear wedge - daily is a trading range
key levels: 59 - 65
bull case: Bulls got their first daily close above the weekly20 ema since February. Bears tried to get the market below 60 but failed to keep it below - 3 times now since April. Markets will try one thing only so much until they try something else. 65 is the next target which will likely get hit early next week but I expect a bit more sideways until one side clearly gives up. Technically this is a double bottom April/May lows and now a higher low and bulls want to get the major trend reversal.
Invalidation is below 65.5
bear case: Bears are hopeful that the bear wedge is still enough resistance that we test down to 60 but they need a strong reversal below 65 to make it happen and when a weekly bar closes at the very high, it’s probably not a good time to be a bear. Best bears can hope for here is to stay below 65 and continue inside the current range 60-65.
Invalidation is above 65.5
short term: Bullish. I think a bull breakout is much more likely than hitting 60 again. Buying 64.58 with a stop 59.5 is likely a decent trade already. Confirmation for the breakout is 65.5ish.
medium-long term - Update from 2025-06-08: Market finds no acceptance below 60 since 2021 and now we have 3 clear legs down, a higher low and a breakout above prior high with a weekly close at the highs and the weekly 20ema. This is likely as good of a swing long as you can get.
GOLD MARKET ANALYSIS AND COMMENTARY - [Jun 09 - Jun 13]OANDA:XAUUSD fell more than 1% on Friday (June 6) due to the unexpected US non-farm payrolls data for May. Spot gold closed at $3,309.84/oz, up 0.8% on the week.
Although gold failed to break above the $3,400/oz resistance and may fluctuate in the $3,300-$3,400/oz range in the short term, the market's resilience and long-term uptrend remain solid.
Meanwhile, silver and platinum outperformed, hitting 13-year and 3-year highs, respectively, on investment demand and expectations of supply shortages.
Gold prices rose significantly on Monday last week and hovered at highs ahead of the release of non-farm payrolls data from Tuesday to Friday, reaching $3,403.48 an ounce on Thursday.
The latest data showed that the US added 139,000 non-farm payrolls in May, beating market expectations of 130,000, the unemployment rate held steady at 4.2% and wage growth beat expectations.
This reduced the likelihood of the Federal Reserve cutting interest rates in the near future, pushing the US dollar and US bond yields higher and putting pressure on gold prices.
OANDA:XAUUSD received initial support above 3,300 USD/ounce, indicating that the market still has buying support, but the resistance level of 3,400 USD/ounce is difficult to overcome in the short term and 3,200 USD/ounce is the main support level, more detailed technical analysis will be sent to readers in the following part of the article. However, since the raw price points are still related to fundamental analysis, I personally think that the price declines can be seen as an opportunity for gold to hold at lower prices, the long-term uptrend is fundamentally unchanged and central bank gold buying and a weaker dollar will continue to support gold prices.
Despite the rise in risk assets such as stocks, gold has shown resilience. Central bank demand for diversified reserves and market risk appetite will continue to support gold prices, underscoring its appeal as a safe-haven asset.
Market Background and Outlook
The labor market is slowing steadily and the Federal Reserve is likely to continue to wait and see, with the likelihood of a near-term rate cut low. The May CPI data next Wednesday (June 11) will be in focus. If CPI rises, it will push the US Dollar higher and further depress gold prices. If CPI is weak, it could help push gold prices higher.
Geopolitical and trade factors: Trump's call with Xi Jinping on Thursday did not bring any clear progress on trade. If the tariff news worsens, this could boost demand for gold as a safe haven.
On the other hand, the outlook for the Middle East-US, Ukraine-Russia talks is also not getting any better, any negative signs on the geopolitical front next week will also boost gold prices to recover.
Economic data and events next week
Wednesday: US Consumer Price Index (CPI)
Thursday: US Producer Price Index (PPI), Weekly Jobless Claims
Friday: University of Michigan Consumer Sentiment Index
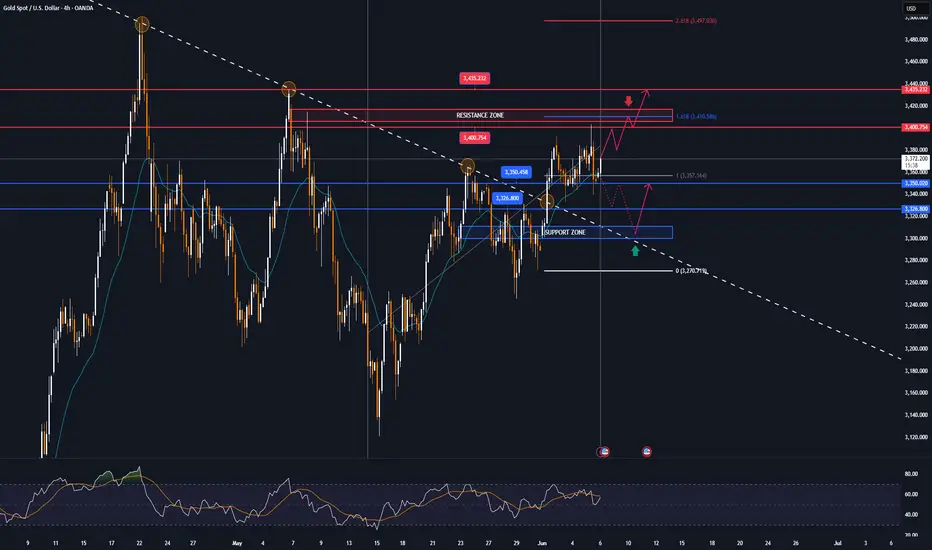
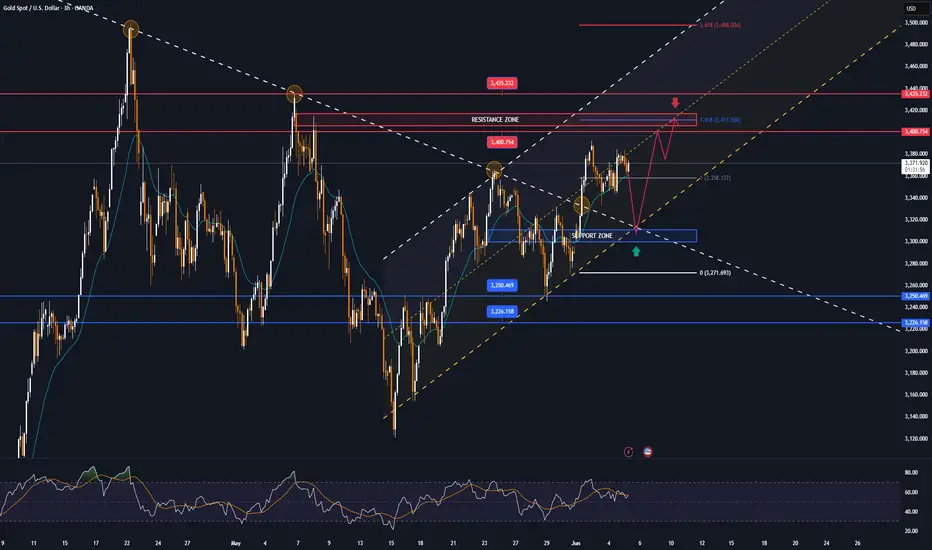
📌Gold prices fell sharply on Friday as it retested the $3,371 target level, which is the 0.236% Fibonacci retracement level, but failed to break it. The bearish momentum took gold towards an area where there are several important supports such as the $3,300 price point and the confluence of the 0.382% Fibonacci retracement level with the 21-day EMA.
Although gold has fallen, its current position still has enough conditions for bullish expectations in the near term. And in terms of momentum, the Relative Strength Index (RSI) is still above 50, and in this case, 50 is considered the nearest momentum support.
As long as gold remains in/above the price channel, its main long-term trend is still bullish, in the short term if gold remains above the base price of 3,300 USD, it still has an upside target at 3,371 USD followed by the base price of 3,400 USD.
Notable technical levels are listed below.
Support: 3,300 – 3,292USD
Resistance: 3,350 – 3,371 – 3,400USD
SELL XAUUSD PRICE 3345 - 3343⚡️
↠↠ Stop Loss 3449
BUY XAUUSD PRICE 3227 - 3229⚡️
↠↠ Stop Loss 3223

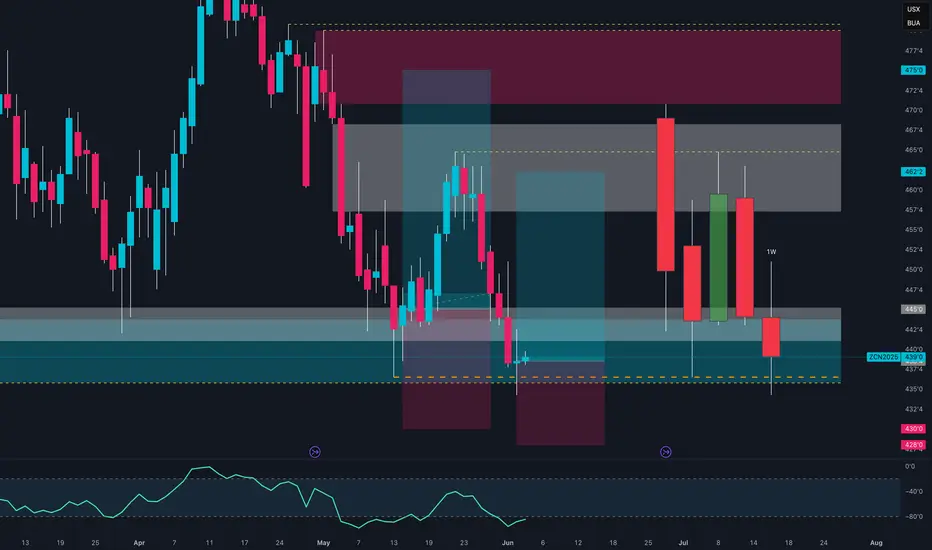
Corn at the Cliff Edge: Bearish Breakdown or Smart Money Trap?📉 1. Price Action & Technical Context (Weekly Chart – ZC1!)
Price is currently sitting around 439'0, after rejecting the 462'2 supply zone (gray block) and confirming rejection from the macro supply area between 472'6–480'0 (red block).
The last four weekly candles show a failed recovery attempt (three green candles trapped between two strong red ones), culminating in a bearish breakout below the intermediate demand zone (445'0–442'0).
Now, price is back inside the key demand zone between 439'0–433'4, an area with heavy volume and previous significant lows.
🔍 Technical takeaway: Bearish breakout confirmed. Price is testing the last major weekly support before opening the door toward the yearly lows (~420'0).
📊 2. Commitment of Traders (COT Report – May 27, 2025)
Non-Commercials (Speculators):
Long: 324,377 (▼ -17,952)
Short: 344,710 (▼ -9,171)
Net Position: -20,333 → Bearish, but the unwinding of both sides suggests profit-taking.
Commercials (Institutions):
Long: 766,211 (▲ +12,588)
Short: 713,647 (▼ -962)
Net Position: +52,564 → Increasing → Institutional accumulation.
🔎 Key observation: Commercials are increasing their net longs, while speculators are reducing exposure. This diverges from price action and may signal institutional accumulation under 440.
📉 3. Net Positioning vs Price (COT Chart)
The chart shows a clear decline in speculative longs since March, with a new low this week.
Meanwhile, commercials are gradually increasing their long exposure, positioning themselves against the current bearish trend.
💡 Combined view: While price keeps dropping, the "smart money" is accumulating → possible bottom forming, though not yet confirmed technically.
🌾 4. Seasonality
June Performance:
20-Year Avg: -4.25%
15-Year Avg: +12.31%
5-Year Avg: +1.15%
2-Year Avg: +28.61%
📈 Seasonal Conclusion: The seasonal bias has turned strongly bullish in the last 2–5 years. June–July is often a rally period for Corn following the late-May bottoms — likely tied to U.S. planting season dynamics.
BTC Under Major Resistance HereBitcoin has shown strength towards playing out these ideas, as unrealistic as it may seem.
The interactions at specific levels have shown these trendlines to be valid.
I see two scenarios if BTC holds below its resistance at 104,550 to 105,000
104,600 to 35,000
35,000 retrace to 75,000
75,000 to 7,000
Alternatively:
104,600 to 20,000
Up from 20,000
While these seem like macro projections, per my previous posts and explanations - it’s possible to see this occur in a very small period of time. IE flash crash, stop hunt, etc.
Happy trading.

GOLD recovers to $3,371, biggest data day of the weekOANDA:XAUUSD maintained its intraday recovery trend and the current gold price is around 3,371 USD/ounce, retesting the initial target increase sent to readers in the weekly publication. In this trading day, investors will focus on the US non-farm payroll data, which is expected to trigger major market movements.
Today (Friday), the US Bureau of Labor Statistics will release the highly anticipated non-farm payroll data for May. The market expects 130,000 new jobs and the unemployment rate to remain unchanged at 4.2%.
On Wednesday, the ADP jobs report, also known as the “mini-non-farm,” showed the smallest number of jobs created by the U.S. private sector in two years. The report could be a precursor to a negative non-farm payrolls report.
Payroll processor ADP reported on Wednesday that private sector payrolls increased by just 37,000 in May, down from a revised 60,000 in April and below the Dow Jones forecast of 110,000. It was the smallest monthly job gain since March 2023, according to ADP.
The U.S. Department of Labor reported on Thursday that initial jobless claims unexpectedly rose last week as concerns about the labor market mounted. The data showed initial jobless claims hit 247,000 in the week ended May 31, up 8,000 from the previous week and above the 236,000 expected in a Dow Jones survey.
If non-farm payrolls data released today is much worse than expected, it could weigh on the U.S. dollar and send gold prices soaring.
Technical Outlook Analysis OANDA:XAUUSD
On the daily chart, after making a fresh weekly high and correcting lower yesterday, gold has recovered to reach its initial target at $3,371, the price point of the 0.236% Fibonacci retracement.
Following the uptrend, gold is likely to head towards the full price point of $3,400 in the short term, rather than $3,435.
Currently, the technical structure has not changed much with the uptrend completely dominating the technical chart. And the notable price points will also be listed as follows.
Support: 3,350 – 3,326 – 3,300USD
Resistance: 3,400 – 3,435USD
SELL XAUUSD PRICE 3412 - 3410⚡️
↠↠ Stop Loss 3416
→Take Profit 1 3404
↨
→Take Profit 2 3398
BUY XAUUSD PRICE 3301 - 3303⚡️
↠↠ Stop Loss 3297
→Take Profit 1 3309
↨
→Take Profit 2 3315
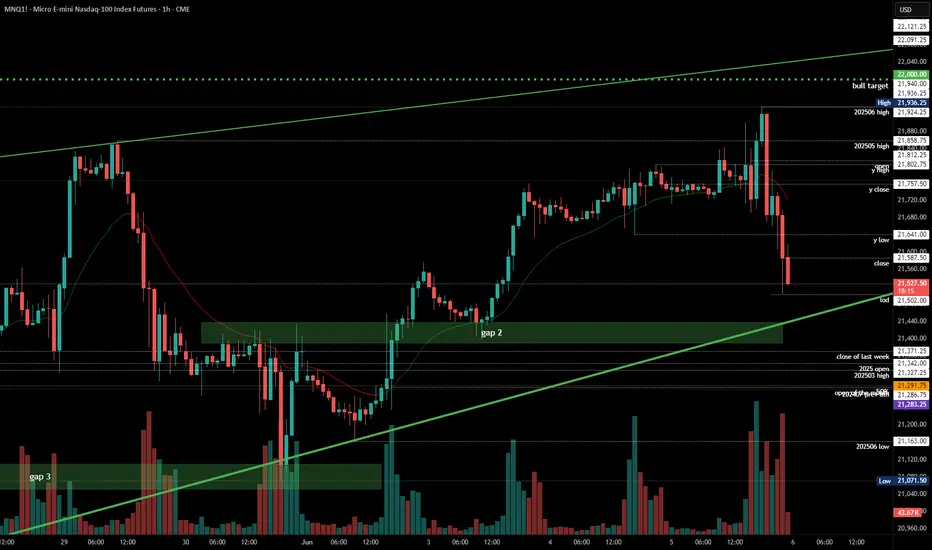
2025-06-05 - priceactiontds - daily update - nasdaqGood Evening and I hope you are well.
comment: Good day for the bears but if you look at the daily or 4h chart, do you really want to sell this? Of course not. Most traders will wait and see where the bears fail to long this for another try at 22000. Technically we had at least 3 legs up in this wedge and 21936 qualifies as a top. I would still not sell this yet. Favoring the bulls for some bounce, can be higher or lower high. Below 21390 I would be neutral and we could try to test down to 21200 or 21000.
current market cycle: trading range
key levels: 20700 - 22000
bull case: Bulls will likely be eager to buy close to the bull trend line which we have not touched since early Monday. Question then is, will we get a lower high or finally the 22000 print? You never know in advance. What you can know is that selling below 21600 is most likely a bad trade.
Invalidation is below 21390.
bear case: Bears getting more confident in shorting new highs since they make decent money doing so. Until we see 21000 again, they will still likely only scalp and not hold on to positions for longer. The bull wedge is too obvious to hold short and pray for a break. If bears would stay below 21700 tomorrow, that would certainly change their outlook and more bulls would start doubting that we can get to 22000. Daily 20ema is around 21200 and the bull trend line around 21400, those are the next targets for bears.
Invalidation is above 22100.
short term: Neutral but if I had to have a position, I’d be long with stop 21050. I will sit on hands and wait for bears to give up and scalp some longs tomorrow. If bears continue down, it will be without me because I don't like getting trapped.
medium-long term - Update from 2024-05-24: Will update this section more after the coming week but in general the thesis is as for dax. Down over the summer and sideways to up into year end. I don’t think the lows for this year are in.
trade of the day: Longing 21700 was a good trade a couple of times today. You could have made decent money doing so and then getting stopped out on the break below 21630 but that would have been still a profitable day. Get comfortable losing.
GOLD trades around target of 3,371 USD, positive outlookOANDA:XAUUSD rose significantly, retesting the $3,371 target as weak US economic data and a weaker dollar were the main reasons for the rise in gold prices.
The market is also struggling to cope with growing political and economic uncertainties.
OANDA:XAUUSD recovered from yesterday's session low of $3,343/oz after ISM and ADP reports confirmed a slowdown in the US economy. Meanwhile, US President Donald Trump signed an executive order to increase tariffs on steel and aluminum from 25% to 50%, effective from June 4, escalating trade tensions.
Federal Reserve officials remain cautious on easing policy; markets await initial jobless claims and nonfarm payrolls data for further policy clues.
The first major data release on Wednesday, the ADP jobs report, dubbed the “mini-nonfarm,” showed the number of private jobs created in the United States was the lowest in two years.
Payroll processor ADP reported on Wednesday that private-sector job creation nearly stalled in May, hitting its lowest level in more than two years amid signs of labor market weakness.
Jobs increased by just 37,000 in the month, down from a revised 60,000 in April and below Dow Jones' forecast of 110,000.
This was the lowest monthly job gain since March 2023, according to ADP statistics. Following the ADP private sector jobs report, US President Trump immediately urged Federal Reserve Chairman Powell to cut interest rates in a furious manner.
Trump posted on Truth Social: "ADP data is out!!! Powell, who is 'too late', must cut interest rates now."
Trump's order to double tariffs on steel and aluminum imports has taken effect, and the White House has confirmed rumors that it has asked trading partners to submit their "best offer" by Wednesday to avoid higher tariffs.
Gold is considered a safe haven from political and economic uncertainty and typically performs well in low-interest-rate environments.
This Friday, the US Bureau of Labor Statistics will release its highly anticipated non-farm payrolls data, with markets expecting 125,000 new jobs and the unemployment rate to remain unchanged at 4.2%.
Technical Outlook Analysis OANDA:XAUUSD
Gold continues to hit the first bullish target of note to readers in the past 2 weeks at $3,371, the price point of the 0.236% Fibonacci retracement.
Currently, gold is also trading around this level, with price action above $3,371 opening the door for a new bullish outlook and the next target around $3,400 in the short term.
In terms of momentum, gold still has a lot of room to rise as the RSI is operating above 50 pointing upwards but still far from overbought territory, which should be considered a bullish signal in the coming trading session.
There are no technical factors that suggest the possibility of a decline becoming a specific trend, the declines as long as gold remains within/above the price channel should only be considered as a short-term correction or a buying opportunity. Meanwhile, the nearest support is the confluence of the EMA21 with the 0.382% Fibonacci retracement and the short-term trend is highlighted by the price channel.
Finally, the bullish outlook for gold prices during the day will be highlighted by the following positions.
Support: 3,350 – 3,326 USD
Resistance: 3,400 – 3,435 USD
SELL XAUUSD PRICE 3412 - 3410⚡️
↠↠ Stop Loss 3416
→Take Profit 1 3404
↨
→Take Profit 2 3398
BUY XAUUSD PRICE 3299 - 3301⚡️
↠↠ Stop Loss 3295
→Take Profit 1 3307
↨
→Take Profit 2 3313
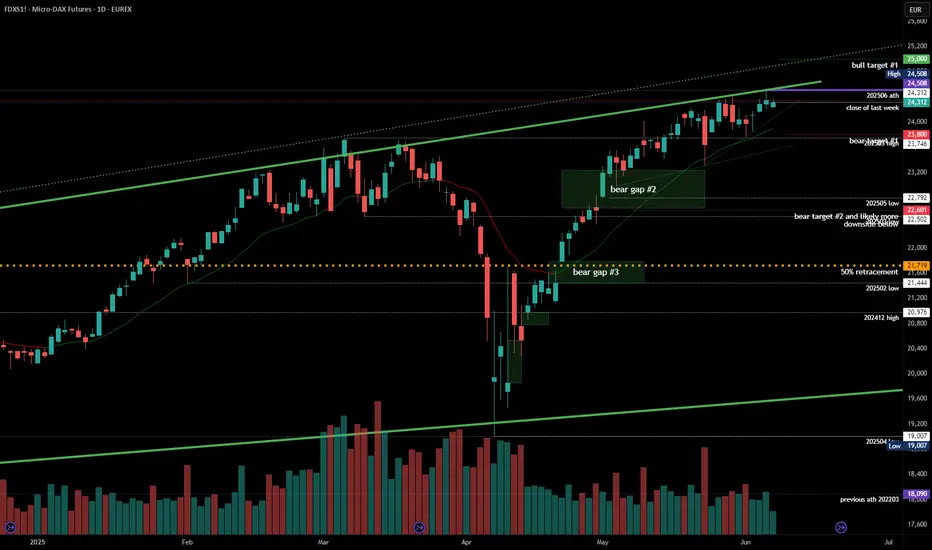
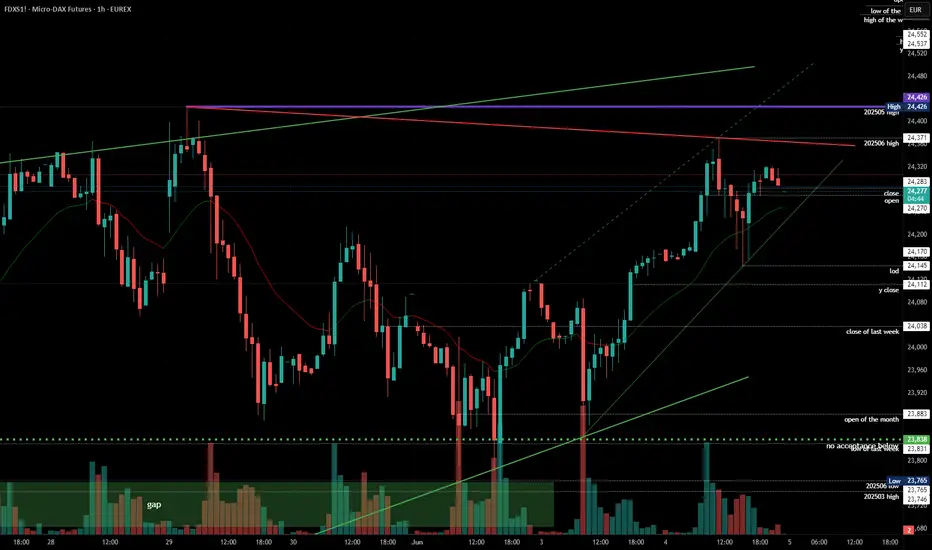
2025-06-04 - priceactiontds - daily update - daxGood Evening and I hope you are well.
comment: When in doubt, zoom out. Market is leaving gaps below and daily bar closed at the high (at least for futures). Bulls will likely get another spike above 24430 to run the stops but I don’t know if they can get more. Buying above 24200 is there but lackluster but that’s still enough for the bulls because bears are not doing anything, so do not look for shorts. I think we are days away from the top but it’s a rough guess.
current market cycle: broad bull channel
key levels: 23700 - 24500
bull case: Bulls remain in control. There are making higher highs and higher lows. That’s all you need to understand about the current price action. Do not sell this unless you are really really good at reversals. The easy money is buying pullbacks. Do that until we make lower lows. Next targets are 24430 and then 24500.
Invalidation is below 24130.
bear case: Even if bears get below 24130, we have another trend line around 24000 and for now we can not expect bears to just appear. They will likely need an event or market has to spend more time building a credible top before we can reverse.
Invalidation is above 24550.
short term: Neutral. Bulls remain in full control but buying up here is just too easy to get trapped and I will rather wait. 24500 is the next obvious target. I think it’s more likely we are in a trading range 23700 -24500 than getting another strong move above 24500.
medium-long term from 2025-05-25: My rough guess from early May was down over the summer and up into year end. POTUS certainly helped with the 50% tariffs. I need to see market reaction next week and if there is no 180° reversal until Friday, they will become reality the week after and dax should do 20-30% down over the next months. Markets were not positioned for any risk what so ever. Now we got the atomic trade bomb.
trade of the day: Long overnight or EU session for 24400. The short from 24371 was not obvious nor easy to take. Also went much further than I expected it to go. Buying the double bottom 24160 was the second best trade. Market found not acceptance below the 1h 20ema and it was also the Globex low.
GOLD falls then recovers slightly, markets eye jobs dataMainly due to the strengthening of the TVC:DXY , OANDA:XAUUSD have fallen sharply from a near four-week high, with a one-day drop of nearly $30 on Tuesday and a slight recovery in today's Asian trading session on Wednesday, June 4.
DXY rebounded from its lowest level in more than a month hit earlier in the session on Tuesday and ended the day up 0.6%, which put some minor pressure on gold in yesterday's session. The U.S. Bureau of Labor Statistics' Employment and Labor Turnover Survey (JOLTS) released on Tuesday showed that total job vacancies in the United States reached 7.39 million in April, up from 7.2 million in March. Economists had expected job vacancies in the United States to be 7.1 million in April.
OANDA:XAUUSD fell on Tuesday as a surprise rise in U.S. job vacancies boosted risk appetite and helped the dollar strengthen, according to Bloomberg. The rise in job vacancies encouraged investors to believe that the U.S. economy remains resilient despite the threat of U.S. President Trump’s tariff agenda.
Looking ahead, U.S. employment data, including Friday’s May nonfarm payrolls report, could help guide the Federal Reserve’s monetary policy, Bloomberg said. Lower interest rates are generally good for non-interest-bearing gold.
Gold traders will be looking ahead to key employment data, including the ADP and nonfarm payrolls reports, to determine the Fed’s policy path.
In terms of technical structure, there are no changes to the chart or previous analysis so readers can review it in the previous publication.
SELL XAUUSD PRICE 3412 - 3410⚡️
↠↠ Stop Loss 3416
→Take Profit 1 3404
↨
→Take Profit 2 3398
BUY XAUUSD PRICE 3299 - 3301⚡️
↠↠ Stop Loss 3295
→Take Profit 1 3307
↨
→Take Profit 2 3313
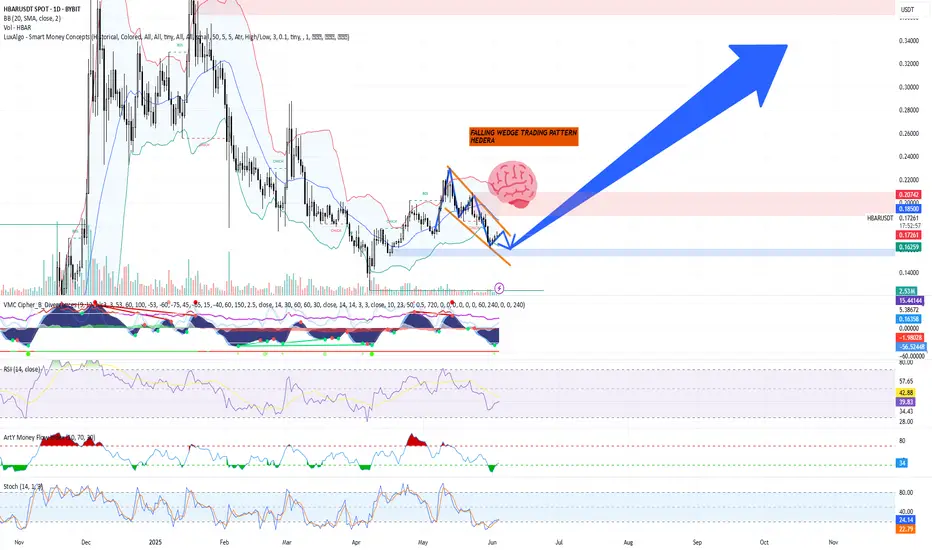
Technical Analysis – HBAR/USDT + TRADE PLANTechnical Analysis – HBAR/USDT (Daily Chart as of June 4, 2025)
Chart Pattern: Falling Wedge (Bullish)
The chart indicates a classic falling wedge pattern, often interpreted as a bullish reversal signal.
This pattern is marked by descending converging trendlines, suggesting declining volatility and potential breakout.
Breakout point is illustrated just above the wedge’s resistance line, with a bullish breakout expected.
Key Support & Resistance Levels
Immediate Support Zone: $0.1625 – $0.1723 (blue zone)
Primary Resistance Targets:
Short-term: $0.1849 (top of Bollinger Band)
Mid-term: $0.2070 – $0.2200
Long-term: $0.3400 (strong historical resistance)
Indicators Summary
Bollinger Bands: Price near the lower band, indicating potential upside volatility.
Volume Profile: Slightly increasing near wedge apex, often a precursor to a breakout.
VMC Cipher_B: Multiple green dots signal bullish divergence; momentum may be reversing upward.
RSI (14): Currently recovering from oversold territory (~39.5), suggesting bullish momentum building.
Money Flow Index (ArTy): Moving back into the green, indicating capital inflow and potential accumulation.
Stochastic RSI: Crossed upward from oversold zone (currently ~23), a common signal for trend reversal.
Trading Plan
Long Position Setup (Swing Trade)
Entry Zone:
$0.1650 – $0.1725 (upon retest of breakout from wedge or candle close above wedge resistance)
Stop-Loss:
$0.1580 (below wedge support and key structure low)
Take-Profit Targets:
TP1: $0.1850 (Bollinger Band and resistance zone)
TP2: $0.2070 (resistance from March 2025)
TP3: $0.2200 – $0.2400 (target zone for full wedge breakout)
TP4: $0.3400 (macro-level resistance, if rally continues)
Risk-to-Reward:
Minimum R:R of 1:2.5 to 1:5 depending on TP level.
⚠️ Risk Management & Strategy Notes
Wait for confirmation breakout candle with strong volume above wedge resistance before entering.
Scale in gradually between $0.1650–$0.1725 if confirmed.
Trail stop-loss after reaching TP1 to lock in profits.
Monitor Bitcoin price trend and overall market sentiment—HBAR tends to follow macro market structure.
The combination of the falling wedge, bullish divergence, and oversold momentum indicators supports a strong potential for bullish continuation. However, conservative confirmation is essential before committing capital.
Outlook: Bullish bias, pending confirmation breakout above the wedge resistance.
Technical Analysis – Velas (VLX/USD) + TRADE PLANTechnical Analysis – Velas (VLX/USD) + TRADE PLAN
Date of Analysis: June 4, 2025
Timeframe: 4-hour (H4)
Current Price: $0.0023541
Chart Pattern: Falling Wedge (Bullish Reversal Potential)
Pattern Description: The price is consolidating within a falling wedge formation — historically a bullish reversal pattern.
Breakout Potential: If price breaks upward through the wedge resistance, strong momentum could follow.
Support Zone: $0.0020 – $0.0022 (Weekly low zone, strong historical support)
Resistance Zones:
Immediate: $0.00339 – $0.00397
Secondary: $0.00444 – $0.00513
Major: $0.00707 (high target zone)
Indicators Overview
VMC Cipher_B (Momentum Oscillator):
Momentum is deep in the red, approaching oversold territory.
Green dots signal potential bullish divergence forming (trend exhaustion).
RSI (14):
Current: 13.30 → Oversold, significant bounce potential.
Last low this deep preceded a strong rally — suggesting a possible bottom.
Arty Money Flow Index (MFI):
Shows low volume inflows → not ideal, but can turn quickly on bullish reversal.
Stochastic RSI:
Crossing upwards from deep oversold (<15).
Bullish crossover forming → early sign of reversal.
Two Scenarios – Trading Plan
Scenario A: Bullish Breakout (Primary Scenario)
Entry: On confirmed breakout of falling wedge → above $0.0026 with volume
Targets:
TP1: $0.00339
TP2: $0.00444
TP3: $0.00513
TP4 (Moon Target): $0.00707
Stop Loss: $0.00215 (below wedge bottom)
Risk/Reward: 1:3 to 1:5 depending on TP level
Confidence: 4/5 (RSI + Wedge support)
Scenario B: Bearish Continuation (Fails to Break Out)
Trigger: Break below $0.00215 with volume
Action:
Short-term panic sell possible down to $0.0015 – $0.0012
Watch for capitulation wick and rapid V-recovery
Re-entry Opportunity: If oversold bounces with large green engulfing or V-bottom reversal
🧠 Strategic Notes:
Velas is at a make-or-break point. Fundamentally, adoption and development updates from the team (esp. Alex & Co.) will heavily influence investor confidence.
DYOR Reminder: This is a highly speculative coin in an oversold state. Best used for swing trades or speculative long-term entries with tight risk control.

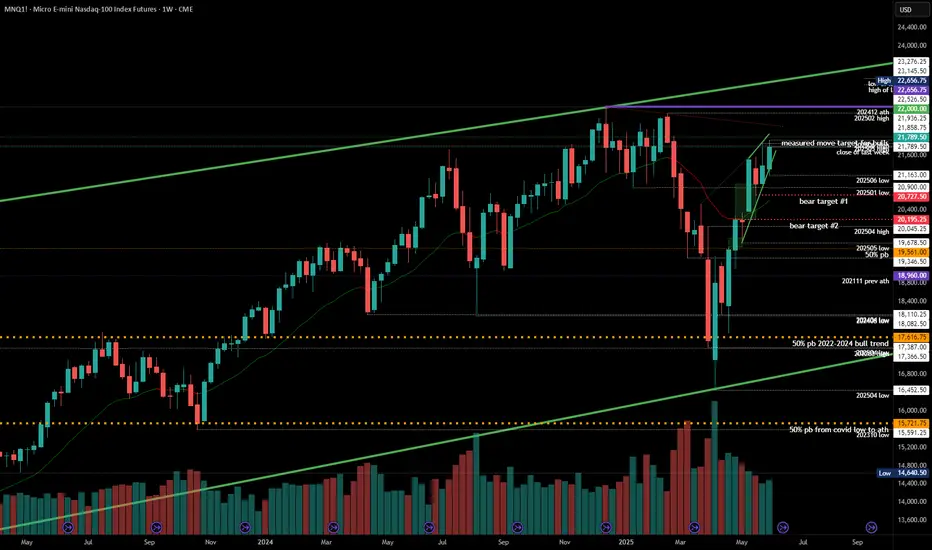
2025-06-03 - priceactiontds - daily update - nasdaqGood Evening and I hope you are well.
comment: Bulls buy every dip and so should you, until it stops working. Clear target above and also clear invalidation level below us. Trade the wedge.
current market cycle: trading range
key levels: 20700 - 22000
bull case: Bulls will likely get a third leg up tomorrow and if they want it bad, we could accelerate upwards for 22000. Right now the wedge is clear but if we get so close to 22000, I doubt market will hesitate to print it. Bulls have to stay above 21500 or risk a deeper pullback to 21300 and I don’t know if they could do 22000 afterwards. If we print below 21500, I think I’d expect a lower high below 21800 but for now they are in full control and are favored for 22000.
Invalidation is below 21500.
bear case: Literally the exact same play every day. Globex and EU sell it, US session pumps. Don’t fight it. Will end soon but just don’t be early. Below 21500 would be a start but only a daily close below 21000 will make me turn bear.
Invalidation is above 22100.
short term: Neutral because longs above 21650 are bad. Wait for a pullback to 21600 or 21550. Can you make them work? Sure but you would have to have a stop at least 21400 and scale in. Bears have nothing for now.
medium-long term - Update from 2024-05-24: Will update this section more after the coming week but in general the thesis is as for dax. Down over the summer and sideways to up into year end. I don’t think the lows for this year are in.
trade of the day: Longing the double bottom on the 15m tf on US open at 24500.
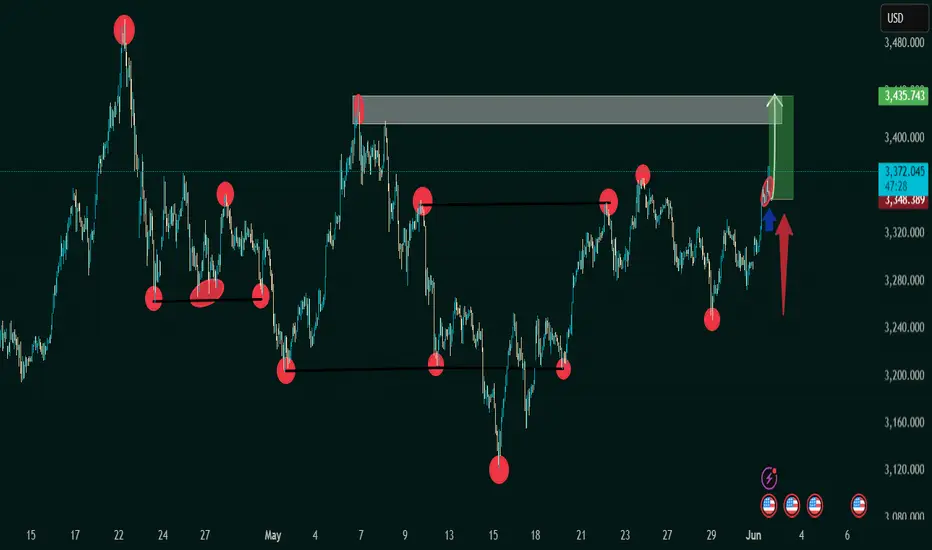
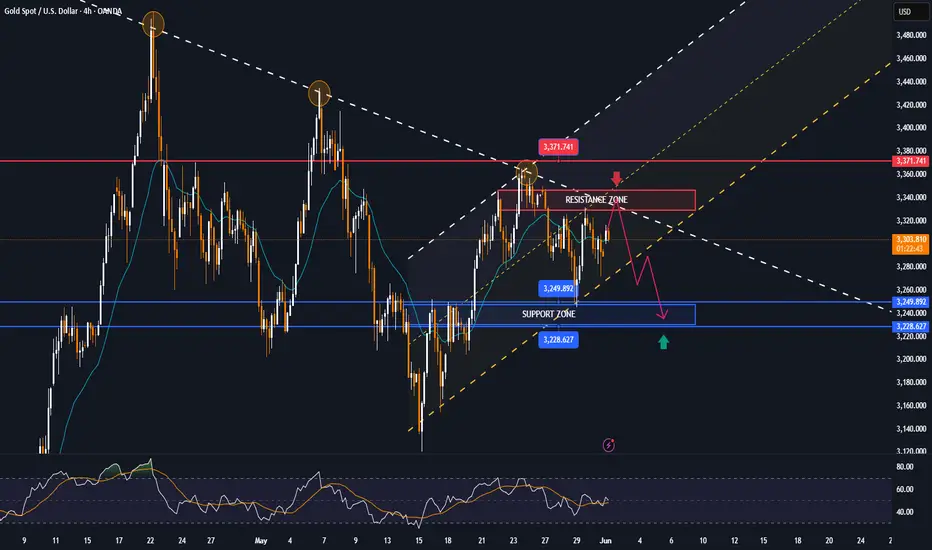
XAU/USD (Gold vs US Dollar) 1h timeframe 1. "Bullish Breakout Anticipation: Gold Eyes $3,435 Zone"
This title emphasizes the potential breakout scenario:
The chart shows price pushing into a previous supply zone (highlighted rectangle).
The green box and arrow indicate a bullish target near $3,435.
Key resistance has been tested multiple times (red circles), suggesting weakening seller control.
📈 2. "Double Bottom Reversal Validates Bullish Momentum in XAU/USD"
This reflects a technical pattern recognition:
A potential double bottom forms near the May 15th and late May lows.
The breakout from the neckline (around $3,350–$3,370) confirms the reversal.
Red-to-green zone suggests the projected move post-breakout.
🔄 3. "Range Consolidation Broken: XAU/USD Breaks Key Resistance"
Focuses on market structure:
Horizontal support/resistance lines indicate a range-bound market.
The recent move above previous highs signals a range breakout.
Blue arrow suggests a retest could offer a long entry point.
💡 4. "Buy Opportunity Triggered on Retest: Targeting Supply Zone Break"
This suits a trading plan scenario:
Red and blue arrows suggest a pullback-and-go trade setup.
The price may revisit the breakout level (~$3,348) before heading higher.
The green zone is the profit target area.
⚔️ 5. "Battle of Supply and Demand: Bulls Gaining Control Above $3,370"
Captures the market sentiment shift:
Multiple failed attempts to break lower (marked with red circles).
Final bullish breakout shows momentum shift to buyers.
If volume confirms, the breakout could be strong and sustained.
Crude oil futures Trade the range In this video I look at the current range that we are in and I have laid out a plan in the scenario that we break that range to the upside and what we could possibly expect .
I have given some reaction zones where I anticipate price to react when we reach there .
I have used Fibonacci, volume profile, and vwap in this video .
Thankyou for your support

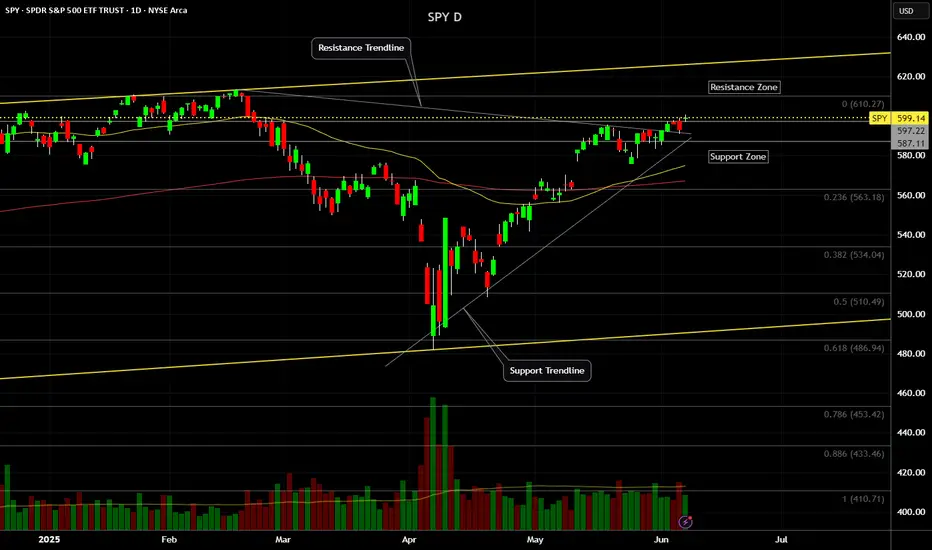
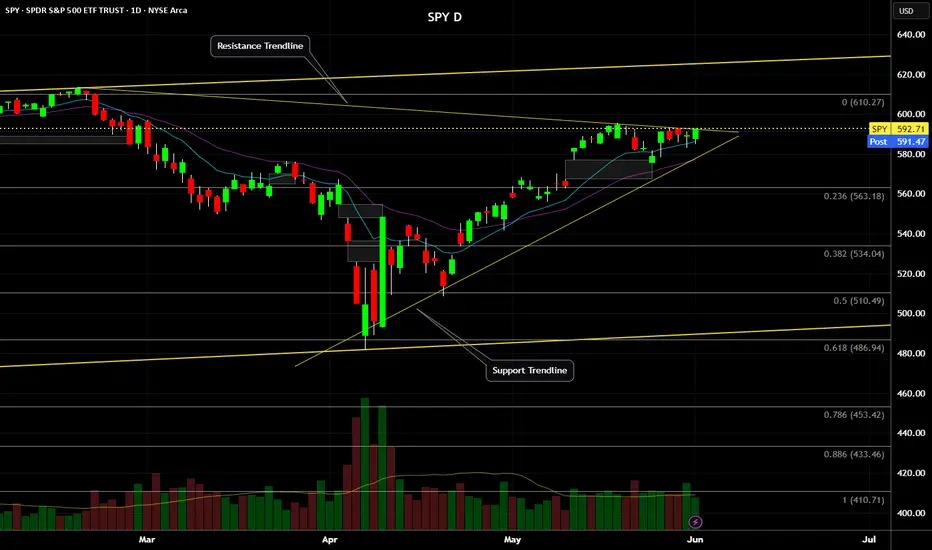
SPY (S&P500 ETF) - Price Testing Resistance Trendline - DailySPY (S&P500 ETF) price is currently testing a resistance trendline above ($593 to $595 price levels).
SPY price in the medium-term has been uptrending since April and May 2025.
SPY price in the short-term has been consolidating sideways, and a large volume breakout or breakdown has not occurred yet.
The 12EMA (blue line) has been holding as support for 5 trading days. Resistance targets to the upside would be $598 to $600.
The grey gap and the 26EMA (purple line) are downside support targets if a rally does not occur this month ($576 to $567).
Breaking news and tariff trade deals are supposed to occur in June and July 2025.
Nasdaq Bullish Speed is expected.Nasdaq (and indexes) are expected to rally with speed after FED release and perform towards the target 22,250.00.
We're going to allow for potential wicks lower on FED release though.

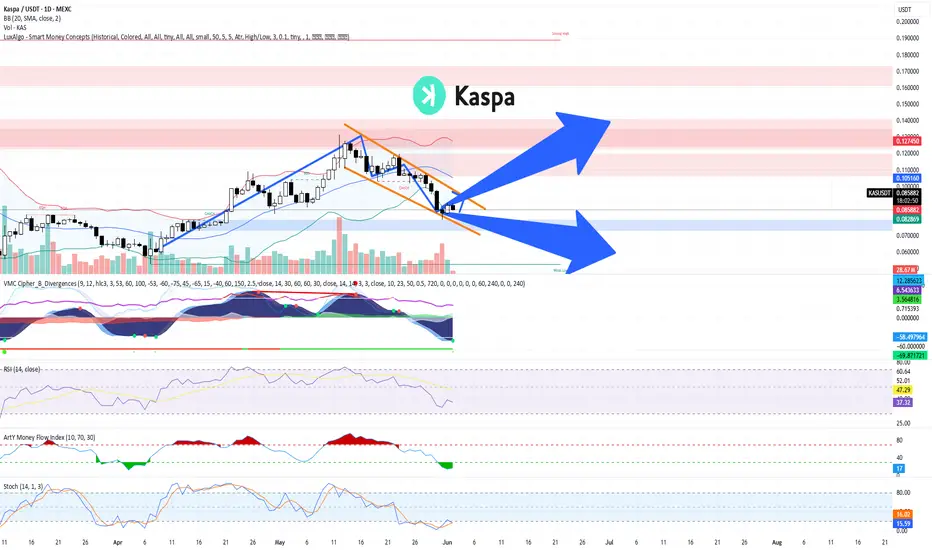
TECHNICAL ANALYSIS – KASPA/USDT (Daily Chart) + TRADE PLANTECHNICAL ANALYSIS – KASPA/USDT (Daily Chart)
Chart Pattern & Price Action:
Descending Channel (Falling Wedge): KASPA has been trading within a falling wedge pattern, typically a bullish reversal setup.
Breakout Zone Approaching: Price is currently testing the upper resistance of the wedge (~$0.086–$0.088). A breakout from this level may indicate trend reversal.
Key Resistance Zone:
$0.105 – $0.127: Significant supply area (marked in red). Previously rejected, it is the next target if price breaks out upward.
Support Zone:
$0.073 – $0.082: Demand zone. Coincides with the Bollinger Band lower range and historical support.
Indicators Overview:
Bollinger Bands:
Price is trading at or near the middle band, showing a neutral-to-slightly bearish bias.
A breakout above the upper band (~$0.0895) could trigger bullish momentum.
MACD (VMC Cipher_B_Divergences):
Strong bearish momentum continues, but we can observe potential bullish divergence forming.
Green dot signal at the bottom may indicate a possible local bottom.
RSI (Relative Strength Index):
Currently at 37.06, near oversold territory.
Could signal a bounce if RSI climbs above 40 and confirms strength.
Money Flow Index (Art’ Money Flow):
MFI is deep in negative; however, these levels often precede trend reversals.
Watch for a crossover into positive territory as confirmation.
Stochastic RSI:
Bullish crossover around 14.53 / 15.67 in the oversold zone.
Early sign of potential short-term bounce.
TRADING PLAN
Entry Points:
Zone Type Price Range Reason
Buy Spot 1 Conservative $0.073 – $0.082 Strong historical support & bottom of wedge
Buy Spot 2 Aggressive ~$0.086 – $0.089 Breakout of descending wedge
Buy Spot 3 Momentum Break above $0.105 Bullish confirmation + breakout of major resistance
Take Profit Zones:
TP Level Price Notes
TP1 $0.105 First resistance / psychological level
TP2 $0.127 Strong resistance – expect rejection here
TP3 $0.15–0.16 Major extension target if strong momentum
Stop-Loss Strategy:
Strategy Type Placement
Conservative Below $0.073
Aggressive Below $0.080
Risk Management:
Use position sizing relative to account size (e.g., 1–3% risk per trade).
Adjust stop-loss dynamically if entering at breakout.
Combine with on-chain metrics or volume spikes for higher conviction.
SCENARIOS:
🔼 Bullish Scenario (Blue Up Arrow):
Breakout above wedge → retest → rally toward $0.105+
Break $0.105 confirms macro uptrend continuation
🔽 Bearish Scenario (Blue Down Arrow):
Rejection at wedge top → breakdown of $0.082 → revisit $0.073 support
Below $0.073 would invalidate short-term bullish structure
GOLD expected to rebound, key trends, jobs data This week, we have the facts that Trump has stirred up the market, Powell has not changed his stance. With the biggest data of the week, the US Non-Farm Payrolls, to be released, the price of OANDA:XAUUSD is expected to rise again after a week of consolidation.
Last Week in News
After weeks of tariff-easing talks that sent U.S. stocks soaring, Wall Street has once again been caught up in the constant flux surrounding Trump’s trade regime. This week, a U.S. court also questioned the legality of the White House’s tariffs on global trading partners as the Trump administration ramps up its policy plans.
Market sentiment took a turn for the worse on Friday following news about tariffs. US media reported that the White House plans to impose broader sanctions on some foreign technology industries. In addition, Trump said that starting next week, tariffs on imported steel will increase from 25% to 50%.
In addition to the tariff headlines, traders also had to contend with weakening US economic data. US consumer spending slowed after recording its strongest month of growth since early 2023 in April.
Here are the events markets will focus on in the new week
• Next week, Federal Reserve Chairman Powell and several members of the board and voting members will speak.
• Trump met with Powell for the first time in his second term, and Powell continued to emphasize the independence of monetary policy.
The US core PCE inflation rate was 2.1% year-on-year in April, slightly below the expected 2.2%. While that bolsters the case for a rate cut, Fed officials have reiterated their patient stance.
Minutes from the May FOMC meeting confirmed that policymakers considered the current economic situation sufficient to delay policy action. Despite the weakening sentiment, traders are still betting on a September rate cut from the Federal Reserve.
Key Data: Non-farm data in focus this week
The focus of next week’s data will be non-farm payrolls on Friday. The pace of hiring in the US is likely to have slowed in May as households became more cautious, businesses reconsidered investment plans amid shifting trade policies and employers focused on controlling costs.
Economists are forecasting a gain of 125,000 in May, according to the median in a Bloomberg survey, after job gains beat expectations in March and April. That would keep the average gain over the past three months at a solid 162,000. The unemployment rate remains at 4.2%. Fed officials are also waiting for clarity on how trade and tax policies will affect the economy and inflation, so they are likely to be cautious about the labor market report.
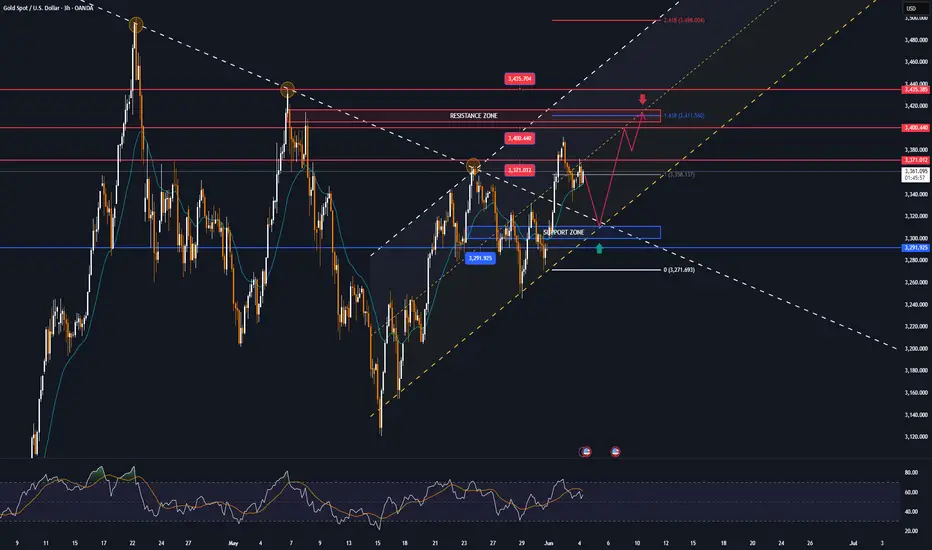
Technical Outlook Analysis OANDA:XAUUSD
On the daily chart, gold has been mostly sideways despite the volatility over the past week. The sharpest drop saw gold test the $3,250 support level before recovering to close the week around the confluence of the EMA21 and the 0.382% Fibonacci retracement.
On the big picture, gold is still technically bullish with the channel as the main trend, while the near-term supports are the $3,250 level followed by the 0.50% Fibonacci retracement. A sustained move above $3,300 would be viewed as a positive factor going forward.
On the momentum front, the Relative Strength Index (RSI) remains above 50, which in this case acts as momentum support and is still well away from overbought territory so there is still room for upside. The weekly target is the 0.236% Fibonacci retracement level in the short term, rather than the raw price point of $3,400.
As long as gold remains within the channel, its main technical trend is bullish, and any declines that do not take gold below the channel should be considered short-term corrections rather than a specific trend.
Next week, the technical bullish outlook for gold will be focused again on the following positions.
Support: $3,250 – $3,228
Resistance: $3,371
SELL XAUUSD PRICE 3337 - 3335⚡️
↠↠ Stop Loss 3341
→Take Profit 1 3329
↨
→Take Profit 2 3323
BUY XAUUSD PRICE 3246 - 3248⚡️
↠↠ Stop Loss 3242
→Take Profit 1 3254
↨
→Take Profit 2 3260
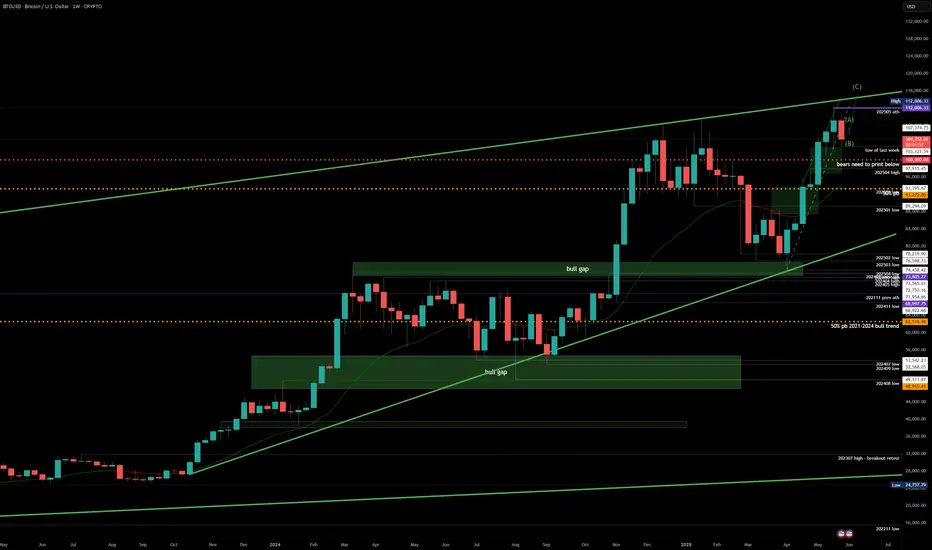
#202522 - priceactiontds - weekly update - bitcoinGood Day and I hope you are well.
comment: First weekly bear bar since end of March but I doubt we just go down. Much more likely is a trading range until more bulls doubt we get above 112k. Can you buy 103k? Only with a stop maybe 98k since the risk of hitting 99.9k are too big to have a stop there. But that trade is much more likely to succeed than shorting 103k with a stop 112.1k.
current market cycle: Broad bull channel on the weekly and monthly chart. Tight bull channel on the daily chart break this week and we are likely in a trading range before we get the next impulse.
key levels: 100k - 115k
bull case: If you are still long this and have not taken profits at 110k, I don’t know what you are waiting for. Market is clearly not finding buyers above 110k and it’s a perfect double top with 2024-12 and 2025-01. Can we hit 115k oder 120k? Sure but the odds are so low. If you are HODLing for 1mil, will hold through 70k again and buy more? If so, good luck to you. Got nothing for the bulls other than a trading range.
Invalidation is a daily below 100k with follow-through.
bear case: Bears need a gap down and it has to stay open if they want more downside. I think the selling this week was decent and without much resistance by the bulls. Contraire to nq and sp500, Friday did not produce a big reversal, which makes me a bit more bearish than it probably should. We are at bigger prior support and I can only really favor the bears once we close the gap down to 97k and the April high.
Invalidation is above 116k.
short term: Neutral. I expect a trading range and likely another test of 110k or even 115k but this will likely be the double top many are waiting before they will short this. A very rough guess of another two-legged move higher is on the chart but don’t trade based on that as of now. Wait for stronger buying again and be prepared to not get more than 110k.
medium-long term - Update from 2025-05-25: Will update this next week but plan here is the same as other markets. I wait for this to top out and trade it back down to 80k over the summer.