Soybeans and Heat: Subtle Signals in a Volatile Market1. Introduction
Soybeans aren't just a staple in livestock feed and global cuisine—they’re also a major commodity in futures markets, commanding serious attention from hedgers and speculators alike. With growing demand from China, unpredictable yields in South America, and increasing climatic instability, the behavior of soybean prices often reflects a deeper interplay of supply chain stress and environmental variability.
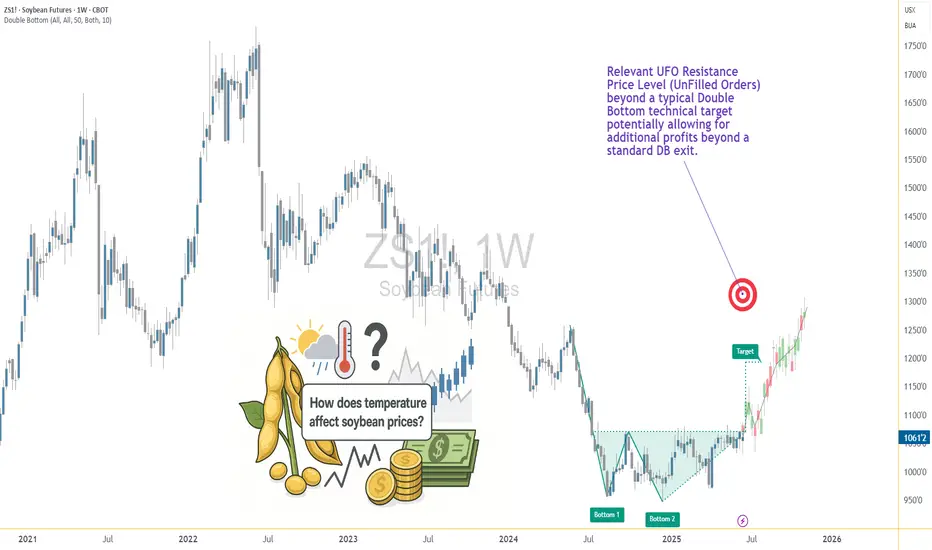
Among the many weather variables, temperature remains one of the most closely watched. It’s no secret that extreme heat can harm crops. But what’s less obvious is this: Does high temperature truly move the soybean market in measurable ways?
As we’ll explore, the answer is yes—but with a twist. Our deep dive into decades of data reveals a story of statistical significance, but not dramatic deviation. In other words, the signal is there, but you need to know where—and how—to look.
2. Soybeans and Climate Sensitivity
The soybean plant’s sensitivity to heat is well documented. During its flowering and pod-setting stages, typically mid-to-late summer in the U.S., soybean yields are highly vulnerable to weather fluctuations. Excessive heat during these windows—particularly above 30ºC (86ºF)—can impair pod development, lower seed count, and accelerate moisture loss from the soil.
The optimal range for soybean development tends to hover between 20ºC to 30ºC (68ºF to 86ºF). Within this window, the plant thrives—assuming adequate rainfall and no pest infestations. Go beyond it for long enough, and physiological stress builds up. This is precisely the kind of risk that traders price into futures markets, often preemptively based on forecasts.
Yet, trader psychology is just as important as crop biology. Weather alerts—especially heatwaves—often drive speculative trading. The market may anticipate stress well before actual yield reports come out. This behavior is where we see the beginnings of correlation between temperature and market movement.
3. Quantifying Weather Impact on Soybean Futures
To test how meaningful these heat-driven narratives are, we categorized weekly temperatures into three buckets:
Low: Below the 25th percentile of weekly temperature readings
Normal: Between the 25th and 75th percentile
High: Above the 75th percentile
We then calculated weekly returns of Soybean Futures (ZS) across these categories. The results?
Despite the modest visual differences in distribution, the statistical analysis revealed a clear pattern: Returns during high-temperature weeks were significantly different from those during low-temperature weeks, with a p-value of 3.7e-11.
This means the likelihood of such a difference occurring by chance is effectively zero. But here’s the catch—the difference in mean return was present, yes, but not huge. And visually, the boxplots showed overlapping quartiles. This disconnect between statistical and visual clarity is exactly what makes this insight subtle, yet valuable.
4. What the Data Really Tells Us
At first glance, the boxplots comparing soybean futures returns across temperature categories don’t scream “market-moving force.” The medians of weekly returns during Low, Normal, and High temperature periods are closely clustered. The interquartile ranges (IQRs) overlap significantly. Outliers are present in every category.
So why the statistical significance?
It’s a matter of consistency across time. The soybean market doesn’t suddenly explode every time it gets hot—but across hundreds of data points, there’s a slightly more favorable distribution of returns during hotter weeks. It’s not dramatic, but it’s reliable enough to warrant strategic awareness.
This is where experienced traders can sharpen their edge. If you’re already using technical analysis, seasonal patterns, or supply-demand forecasts, this weather-based nuance can serve as a quiet confirmation or subtle filter.
5. Why This Still Matters for Traders
In markets like soybeans, where prices can respond to multiple fundamental factors—currency shifts, export numbers, oilseed competition—small weather patterns might seem like background noise. But when viewed statistically, these small effects can become the grain of edge that separates average positioning from smart exposure.
For example:
Volatility tends to rise during high-heat weeks, even when average return shifts are small.
Institutional players may rebalance positions based on crop health assumptions before USDA reports arrive.
Weather trading algos can push prices slightly more aggressively during risk-prone periods.
In short, traders don’t need weather to predict price. But by knowing what weather has historically meant, they can adjust sizing, bias, or timing with greater precision.
6. Contract Specs: Standard vs. Micro Soybeans
Accessing the soybean futures market doesn’t have to require big institutional capital. With the launch of Micro Soybean Futures (MZS), traders can participate at a more granular scale.
Here are the current CME Group specs:
📌 Contract Specs for Soybean Futures (ZS):
Symbol: ZS
Contract size: 5,000 bushels
Tick size: 1/4 of one cent (0.0025) per bushel = $12.50
Initial margin: ~$2,100 (varies by broker and volatility)
📌 Micro Soybean Futures (MZS):
Symbol: MZS
Contract size: 500 bushels
Tick size: 0.0050 per bushel = $2.50
Initial margin: ~$210
The micro-sized contract allows traders to scale into positions, especially when exploring signals like weather impact. It also enables more nuanced strategies—such as partial hedges or volatility exposure—without the capital intensity of full-size contracts.
7. Conclusion: A Nuanced Edge for Weather-Aware Traders
When it comes to soybeans and temperature, the story isn’t one of obvious crashes or dramatic spikes. It’s a story of consistent, statistically measurable edges that can quietly inform better trading behavior.
Yes, the return differences may look small on a chart. But over time, in leveraged markets with seasonality and fundamental noise, even a few extra basis points in your favor—combined with smarter sizing and timing—can shift your performance curve meaningfully.
Using tools like Micro Soybean Futures, and being aware of technical frameworks, traders can efficiently adapt to subtle but reliable signals like temperature-based volatility.
And remember: this article is just one piece in a multi-part series exploring the intersection of weather and agricultural trading. The next piece might just provide the missing link to complete your edge. Stay tuned. 🌾📈
When charting futures, the data provided could be delayed. Traders working with the ticker symbols discussed in this idea may prefer to use CME Group real-time data plan on TradingView: tradingview.sweetlogin.com - This consideration is particularly important for shorter-term traders, whereas it may be less critical for those focused on longer-term trading strategies.
General Disclaimer:
The trade ideas presented herein are solely for illustrative purposes forming a part of a case study intended to demonstrate key principles in risk management within the context of the specific market scenarios discussed. These ideas are not to be interpreted as investment recommendations or financial advice. They do not endorse or promote any specific trading strategies, financial products, or services. The information provided is based on data believed to be reliable; however, its accuracy or completeness cannot be guaranteed. Trading in financial markets involves risks, including the potential loss of principal. Each individual should conduct their own research and consult with professional financial advisors before making any investment decisions. The author or publisher of this content bears no responsibility for any actions taken based on the information provided or for any resultant financial or other losses.