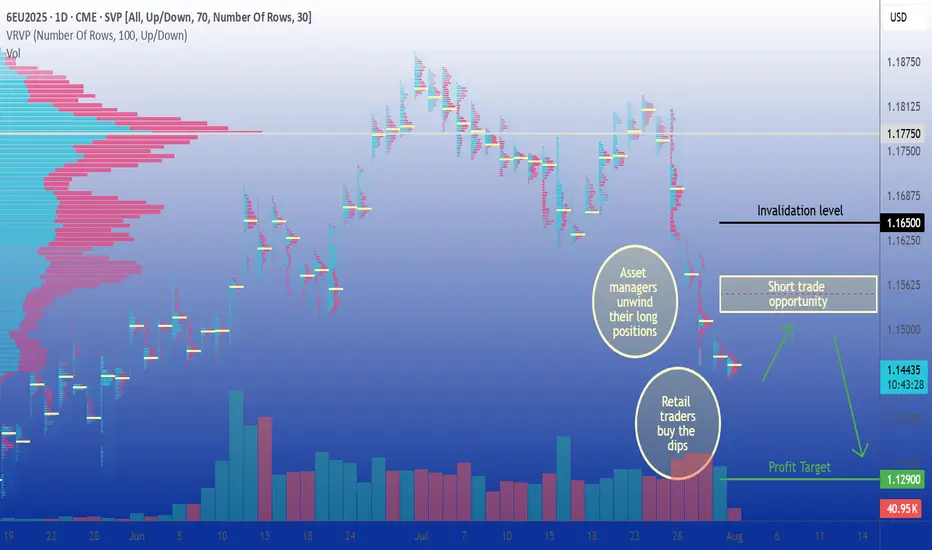
Tactical Short Setup on EURThe September 2025 Euro FX futures contract (E6U25) is currently trading around 1.1440 after topping out near 1.19 the 1st of July. This decline reflects a broader market repricing, driven by evolving expectations around monetary policy from the Federal Reserve and the European Central Bank, softening Eurozone growth prospects, and a technical backdrop that has turned decisively bearish. Coupled with shifts in sentiment and options market positioning, the current setup presents an opportunity to initiate a tactical short with an attractive risk-reward profile.
Fundamental Analysis – Central banks and diverging momentums
Monetary policies on either side of the Atlantic appear to diverge. The Federal Reserve has kept its federal funds rate steady in the 4.25%–4.50% range since December 2024, resisting political pressure to ease. In contrast, the European Central Bank has gradually lowered its deposit rate from 4% to 2.00% since mid-2024 and maintained that level in July, considering inflation is now back to its 2% target. This has widened the yield differential in favor of the U.S. dollar.
Forward guidance from both central banks suggests a cautious stance. The Fed’s June 2025 dot plot anticipates a modest rate cut by year-end, though FOMC members remain divided. Meanwhile, the ECB projects subdued inflation and modest growth, implying no urgency for further easing.
On the macro front, U.S. GDP rebounded sharply in Q2 (+3.0% annualized), though driven largely by a collapse in imports. Domestic demand and job creation have slowed, and tariffs may push core inflation above 3% again. In the eurozone, Q2 GDP barely expanded (+0.1%), with uneven performance across member states. Inflation is stable at 2%, with core pressures easing. Altogether, the dollar retains a slight edge amid firmer data and a more hawkish Fed.
Technical Outlook – Bearish shift with volume confirmation
From a technical standpoint, the E6U25 contract has clearly broken down from its prior range. The area around 1.1775, which previously served as a high-volume node and resistance, was breached with strong downside momentum. The price action has since carved out a clean pattern of lower highs and lower lows, and volume has notably increased on bearish sessions, confirming the shift in control.
The current structure suggests a vacuum between 1.1775 and 1.1500, with only minor resistance expected around 1.1545, where some residual volume lies. There is little to no support before the 1.1280–1.1300 area, which aligns with a lower volume shelf on the visible range volume profile (VRVP). If price retraces to retest the 1.1525–1.1575 zone, that area is likely to act as a tactical selling opportunity before potentially resuming the downtrend.
Sentiment Analysis
CFTC data as of late July shows asset managers holding a substantial long position in EUR/USD, though these are beginning to unwind. The positioning profile leaves the euro vulnerable to further long liquidation if the selloff deepens.
Retail sentiment reinforces this view, as most retail traders are caught on the wrong side of the move. Open interest is stable but elevated, and trading activity has begun to rise slightly, hinting at retail dip-buying that may lack conviction. No major retail capitulation has occurred yet.
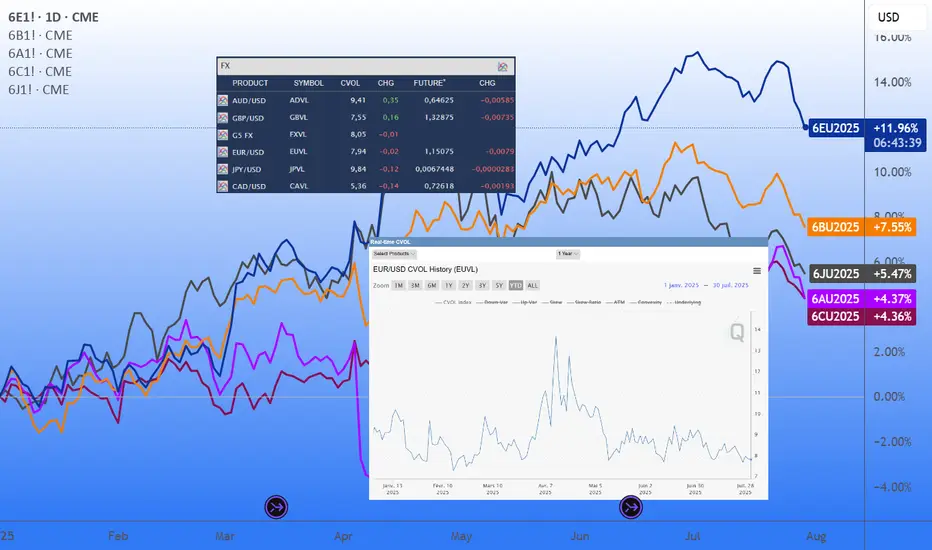
Broad market volatility remains subdued, and EUR/USD-specific indicators show a similar picture. The CME CVOL Index for EUR/USD remains around 8, a level considered moderately low by historical standards, reflecting a calm, non-disruptive market environment that favors technical trading, including respect for resistance levels and trend-following strategies.
Options Analysis
According to the CME FX Options Vol Converter, the landscape for EUR/USD still exhibits a modest downside bias. Risk reversals across one to three months tenors remain slightly negative, reflecting moderate demand for euro puts.
In listed markets, CME data for August expiries shows notable open interest concentration in puts at the 1.1450 and 1.1500 strikes, with deltas indicating directional positioning rather than purely hedging activity. On the call side, interest is more dispersed but visible above 1.1650, particularly at 1.1700 and 1.1750, suggesting some appetite for upside. However, the deltas are lower.
Trade Idea
A tactical short trade is favored in the 1.1525–1.1575 zone, which coincides with a potential pullback level within a well-established downtrend. This level also aligns with a minor volume shelf, providing a natural resistance area where sellers are likely to re-enter the market.
The suggested stop level is 1.1650, just above the recent short-term swing highs, which would invalidate the current bearish structure. The target lies around 1.1290, near the next major support zone and volume cluster.
Final thoughts
The EUR/USD rally in May/June was primarily fueled by expectations of synchronized easing and softer U.S. data. However, the Fed’s reluctance to commit to a cut, combined with a relatively more aggressive ECB stance, has shifted the narrative back in favor of the dollar. With asset managers showing signs of willingness to further unwind their exposure, combined with sentiment indicators pointing to complacency, a deeper retracement remains plausible.
The technical breakdown, lack of implied vol support for a rebound, and fresh open interest on euro puts collectively argue for tactical downside continuation. The proposed trade seeks to capture that move with a controlled stop and a realistic price target. Unless EUR/USD can reclaim the 1.1650–1.1700 zone decisively, the path of least resistance remains downward.
---
When charting futures, the data provided could be delayed. Traders working with the ticker symbols discussed in this idea may prefer to use CME Group real-time data plan on TradingView: tradingview.com/cme/ .
This consideration is particularly important for shorter-term traders, whereas it may be less critical for those focused on longer-term trading strategies.
General Disclaimer:
The trade ideas presented herein are solely for illustrative purposes forming a part of a case study intended to demonstrate key principles in risk management within the context of the specific market scenarios discussed. These ideas are not to be interpreted as investment recommendations or financial advice. They do not endorse or promote any specific trading strategies, financial products, or services. The information provided is based on data believed to be reliable; however, its accuracy or completeness cannot be guaranteed. Trading in financial markets involves risks, including the potential loss of principal. Each individual should conduct their own research and consult with professional financial advisors before making any investment decisions. The author or publisher of this content bears no responsibility for any actions taken based on the information provided or for any resultant financial or other losses.
Futuresstrategies
Implied volatility, one more tool in our arsenalWHAT IS IMPLIED VOLATILITY?
Implied volatility (IV) refers to the market’s expectations of future volatility for a given asset, derived from option prices. Unlike historical volatility, which measures past price fluctuations, IV is forward-looking and reflects what traders believe will happen in the near future, typically over a 1 to 3 month horizon. IV is not directly observable; it is inferred from option prices using models like Black-Scholes. When option premiums rise even though the underlying asset remains flat, this often signals a rise in implied volatility: investors are preparing for more pronounced future price moves.
IMPLIED VOLATILITY IN FX
In FX markets, as in equities or commodities, implied volatility serves as a risk gauge and a proxy for uncertainty. It plays a critical role in portfolio management, hedging, and strategy timing.
High implied volatility on a currency pair indicates market expectations for increased future movement. This can stem from upcoming economic data, central bank decisions, geopolitical risk, or broader market instability. For example, rising IV on EUR/USD ahead of a major Fed or ECB meeting may signal increased demand for options as market participants hedge against potential surprises. Conversely, sustained low IV often reflects calm market conditions or, at times, a strong directional trend.
Implied volatility can act as a market condition filter for trading strategies. To simplify, we can, for example, divide the CVOL level into four distinct categories.
Abnormally low IV (well below average): Reflects extreme complacency or post-event calm.
Moderately low IV (below average): Indicates orderly, technical markets.
Moderately high IV (above average): Suggests elevated uncertainty.
Abnormally high IV (well above average): Signals market stress or panic.
In spot FX, where retail traders rarely engage in options directly, implied volatility serves best as a macro signal, helping inform position sizing, stop placement, or overall risk exposure based on the current volatility regime.
One advanced use of IV is to compare it against realized (historical) volatility. When implied volatility is much higher than realized volatility, it often means options are expensive, and vice versa. This comparison proves especially valuable in FX markets, as it helps traders identify situations where risk premia may be overpriced, revealing potential misalignments between implied and realized volatility. It also offers a forward-looking perspective by highlighting upcoming catalysts that are not yet fully priced into the spot market.
INTRODUCING THE CME CVOL INDEX
To make volatility data more accessible and comparable across asset classes, CME Group introduced the CVOL index family in 2023, a set of standardized implied volatility indexes derived from listed futures options.
How CVOL is calculated?
CVOL indexes are built using vanilla options on futures. They estimate 30-day forward implied volatility, using a basket of out-of-the-money options across various strikes and near-term expirations. The methodology is comparable to that of the VIX in equities, but adapted for the structure of futures markets. Each CVOL index is expressed as an annualized percentage, which can be interpreted as the expected one-standard-deviation move over the next 30 days.
CVOL indexes in FX
Several major currency pairs now have their own dedicated CVOL indexes, offering a real-time measure of implied volatility based on options pricing from CME Group futures contracts. Each index reflects the market’s expectations of future volatility for a given pair:
EUVL for EUR/USD (based on 6E futures)
JPVL for USD/JPY (6J futures)
GBPVL for GBP/USD (6B futures)
CAVL for USD/CAD (6C futures)
ADVL for AUD/USD (6A futures)
In addition to individual pair indexes, the G5 CVOL Index provides a broader view by aggregating the implied volatility of the five major currency pairs, offering a high-level snapshot of volatility across the G5 FX complex. This makes it a valuable tool for macro-focused traders monitoring global risk appetite, cross-asset volatility regimes, or portfolio-level currency exposure.
HOW TO USE CVOL IN PRACTICE
Detecting shifts in risk perception
A sudden spike in CVOL, without a move in the underlying, suggests that institutional players are actively hedging. This can act as an early warning signal for market-moving events or shifts in sentiment. Example: before an ECB decision, a jump in EUVL from 7% to 10% annualized while EUR/USD remains flat may suggest that traders are bracing for a policy surprise.
Adjusting position sizing
When CVOL moves beyond predefined thresholds, traders often respond by reducing leverage, widening stop-loss and take-profit levels, and avoiding overly aggressive directional exposure, in contrast with periods where CVOL fluctuates near its historical average and market conditions appear more stable.
Quant strategy filters
CVOL can also act as a regime filter within systematic trading strategies. For example, when implied volatility on EUR/USD, as measured by EUVL, reaches extreme levels, certain algorithms may shift into breakout mode, anticipating strong directional moves in a high-volatility environment. Conversely, when the index shows no abnormal reading, it may reflect a well-balanced market backdrop, offering more orderly conditions where structured strategies such as range trading tend to perform better.
As historical data on CVOL indexes are available, quant traders can easily backtest and validate ideas that incorporate volatility-based signals or regime filters. More experienced participants often go further, combining FX implied volatility with other volatility indicators, such as CVOL indexes on interest rate futures, to build multi-asset strategies and monitor cross-asset shifts in risk appetite with greater precision.
FINAL THOUGHTS
Implied volatility is a powerful lens into market expectations and potential price swings. In FX, although not always directly accessible to retail traders via options, IV data provides essential context for positioning, timing, and risk management.
With the advent of CME’s CVOL indexes, traders now have a standardized and transparent way to track and compare implied volatility across currencies. Whether you are a macro trader, hedge fund manager, or informed retail participant, monitoring CVOL brings a distinct informational edge, especially when used to anticipate shifts in sentiment and volatility regimes.
And perhaps most importantly: IV doesn’t tell you what happened, but what might happen next, making it an invaluable tool for anyone navigating fast-moving global FX markets.
---
When charting futures, the data provided could be delayed. Traders working with the ticker symbols discussed in this idea may prefer to use CME Group real-time data plan on TradingView: tradingview.com/cme/ .
This consideration is particularly important for shorter-term traders, whereas it may be less critical for those focused on longer-term trading strategies.
General Disclaimer:
The trade ideas presented herein are solely for illustrative purposes forming a part of a case study intended to demonstrate key principles in risk management within the context of the specific market scenarios discussed. These ideas are not to be interpreted as investment recommendations or financial advice. They do not endorse or promote any specific trading strategies, financial products, or services. The information provided is based on data believed to be reliable; however, its accuracy or completeness cannot be guaranteed. Trading in financial markets involves risks, including the potential loss of principal. Each individual should conduct their own research and consult with professional financial advisors before making any investment decisions. The author or publisher of this content bears no responsibility for any actions taken based on the information provided or for any resultant financial or other losses.
Kiwi on the Edge: Sell the Bounce Below 0.6080Among major currencies, the New Zealand Dollar (NZD) is often viewed as peripheral in global capital flows. Yet it consistently ranks among the world’s top 10 most traded currencies. Its relevance stems from New Zealand’s strong exposure to international trade, especially with China and Australia, and an economy heavily reliant on commodity exports. As a result, the NZD is classified as a "pro-risk" currency, highly sensitive to global cyclical dynamics, interest rate differentials, and Asian demand. It also maintains a strong correlation with the Australian Dollar (AUD), due to similar macroeconomic drivers and trade linkages.
In the FX community, the NZD is often affectionately referred to as the "Kiwi," a nod to the iconic flightless bird native to New Zealand and depicted on the country’s coins. Despite being a smaller player on the geopolitical scene, New Zealand’s currency frequently presents appealing opportunities for FX traders, particularly in times of shifting risk sentiment or commodity market volatility.
With the Reserve Bank of New Zealand (RBNZ) having just announced its latest policy decision, it’s time to reassess the Kiwi’s fundamental landscape, technical backdrop, and market sentiment to refine our directional trading outlook.
Fundamental Outlook: RBNZ holds rates, but easing bias remains
As widely expected, the RBNZ held its Official Cash Rate (OCR) steady at 3.25% during its July 9 policy meeting. This pause comes after an aggressive easing cycle that saw the OCR lowered by 225 basis points since August 2024. The move reflects the central bank’s aim to stabilize inflation without undermining the fragile recovery.
The tone of the accompanying statement remains dovish. Policymakers clearly left the door open for further rate cuts later in the year, conditional on continued disinflation and signs of weaker demand. For now, however, inflation is running at a comfortable 2.5% year-over-year, right in the middle of the RBNZ’s 1–3% target band. Meanwhile, the economy has shown some resilience: Q1 2025 GDP posted a quarterly gain of +0.8%, confirming a technical exit from the recession experienced in 2024.
Nonetheless, external headwinds remain a concern. Sluggish data from China (New Zealand’s largest trading partner) continue to cast a shadow over the medium-term outlook. Slower Chinese demand for dairy and meat exports, as well as raw materials, could limit the momentum of New Zealand’s recovery, thereby reinforcing the need for accommodative policy.
Technical Analysis: Key resistance near 0.6080
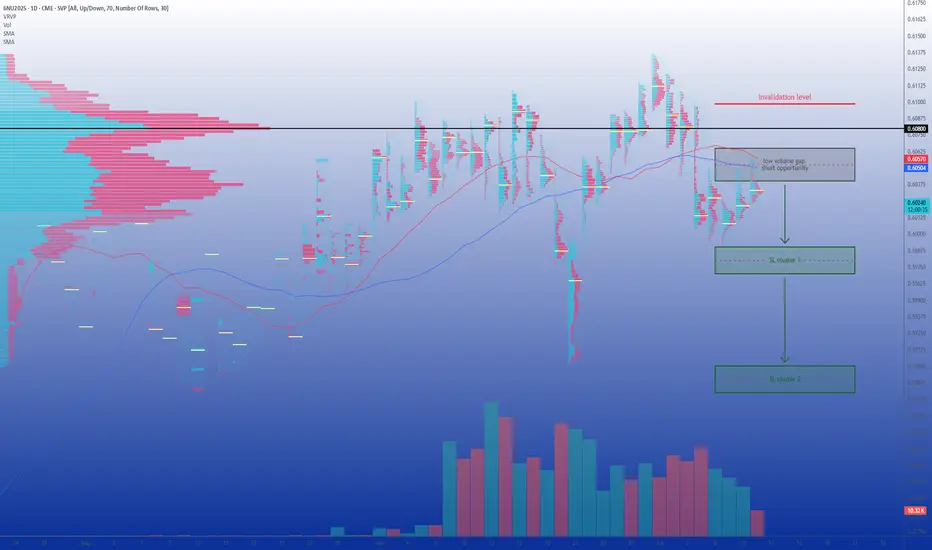
Technically, the picture has deteriorated significantly on the 6NU2025 contract since Monday, with a sharp downside acceleration toward the psychological 0.60 level. Price is still hovering around this threshold.
Volume profile analysis reveals a clear liquidity gap between 0.6040 and 0.6065, a zone that could be filled before any new directional move unfolds. Just above, a major congestion area emerges around 0.6080, where the point of control (POC) is located. This area represents a key short-term pivot and a potential resistance level, especially as it also sits just above the 10- and 20-day simple moving averages.
As long as price remains capped beneath 0.6080, the bias remains moderately bearish. A rejection in the 0.6060–0.6080 area would confirm resistance and suggest renewed downside risk. However, a decisive daily close above 0.6100 would invalidate the bearish scenario and open the door toward 0.6150 and possibly above. In the near term, the setup favors a cautious bearish stance, but timing remains critical.
Sentiment and Positioning: Retail crowded longs raise red flags
Commitment of Traders (COT) data provides additional context. As of the latest report, non-commercial speculators hold a net long position of approximately +4,150 contracts in the 6N futures. This moderately bullish stance likely reflects the unwinding of prior bearish bets in response to the sustained weakness of the US dollar over the past quarter. Meanwhile, commercial hedgers, typically exporters and importers, remain net short, which is structurally consistent with hedging flows rather than directional speculation.
From a retail perspective, the sentiment skew is more concerning. Aggregated positioning data across FX/CFD brokers shows that nearly 60% of retail traders are long NZD/USD. Some platforms report even more extreme figures, with bullish retail exposure above 80%. Historically, such one-sided positioning often foreshadows downside risk, especially if stop losses are triggered en masse below recent support levels.
Volatility conditions also merit attention. The VIX, Wall Street’s fear index, remains near its annual lows, suggesting a market backdrop of complacency. While this environment typically supports pro-risk currencies like the NZD, the fact that the S&P 500 just notched fresh all-time highs raises the possibility of profit-taking or corrective flows, potentially weighing on risk-correlated assets in the short term.
Trade Idea: Sell the rally toward 0.6060–0.6080
Given the current macro setup, sentiment profile, and technical resistance overhead, a sell-the-bounce approach appears tactically appropriate. We propose the following directional futures trade on the September contract (6NU2025):
Entry Point: Short at 0.6060, to take advantage of a potential fill of the low-volume gap
Stop Loss: 0.6100 on a daily close basis, just above the POC and confluence resistance
Target 1: 0.5985, below the recent swing low
Target 2 (extended): 0.5890, just under the June 23 bottom
This setup aims to capture a continuation of the downtrend that began in early July. It relies on disciplined risk management and realistic target zones, while respecting key technical structures and the crowded long positioning among retail traders. The strategy will be invalidated if prices manage to close above 0.6100 on a daily basis, signaling a shift in near-term momentum.
---
When charting futures, the data provided could be delayed. Traders working with the ticker symbols discussed in this idea may prefer to use CME Group real-time data plan on TradingView: tradingview.com/cme/.
This consideration is particularly important for shorter-term traders, whereas it may be less critical for those focused on longer-term trading strategies.
General Disclaimer:
The trade ideas presented herein are solely for illustrative purposes forming a part of a case study intended to demonstrate key principles in risk management within the context of the specific market scenarios discussed. These ideas are not to be interpreted as investment recommendations or financial advice. They do not endorse or promote any specific trading strategies, financial products, or services. The information provided is based on data believed to be reliable; however, its accuracy or completeness cannot be guaranteed. Trading in financial markets involves risks, including the potential loss of principal. Each individual should conduct their own research and consult with professional financial advisors before making any investment decisions. The author or publisher of this content bears no responsibility for any actions taken based on the information provided or for any resultant financial or other losses.
FX quarter end : a high-probability recurring patternAs we approach the end of June, a well-known phenomenon among FX traders is once again coming into focus: when currencies have diverged significantly over the course of a month or quarter, we often see a technical correction into the final trading session, with partial pullbacks in the pairs that had previously moved the most.
This end-of-month or quarter pattern is not random. It is the predictable result of recurring institutional flows. Recently, the US dollar has notably weakened against most major currencies. As a result, we could anticipate a modest bounce in the dollar to close out the month and start the new week, as various participants are likely to adjust their positions accordingly.
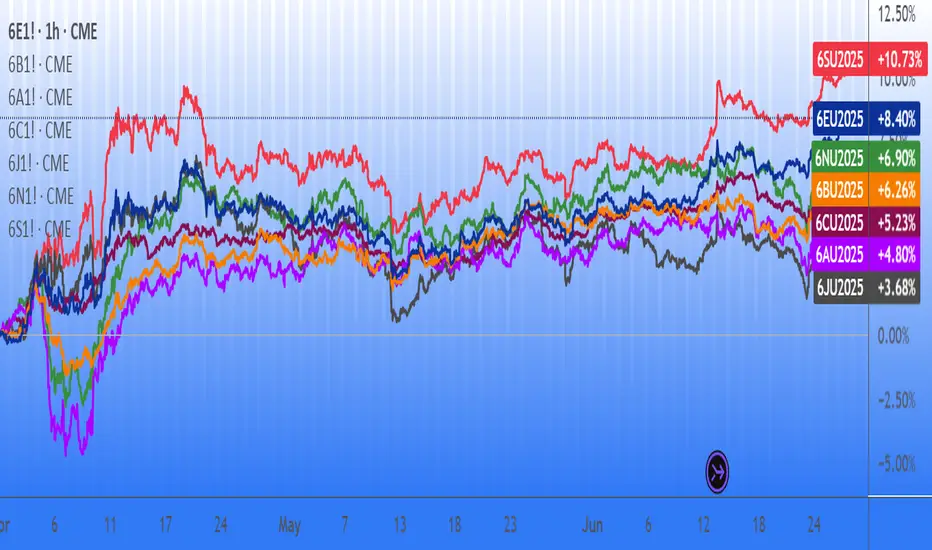
Performance of FX futures contracts from Sunday, June 1 to Friday, June 27:
Swiss Franc +3.71%
Euro +3.61%
British Pound +1.95%
New Zealand Dollar +1.58%
Australian Dollar +1.50%
Canadian Dollar +0.67%
Japanese Yen +0.16%
Performance of FX futures contracts from Tuesday, April 1 to Friday, June 27:
Swiss Franc +10.73%
Euro +8.40%
New Zealand Dollar +6.90%
British Pound +6.26%
Canadian Dollar +5.23%
Australian Dollar +4.80%
Japanese Yen +3.68%
These figures illustrate a broad-based decline in the dollar during June and over the entire second quarter. Historically, such imbalances open the door to late-stage adjustments, with currencies that have risen sharply often seeing modest technical pullbacks. This is a setup closely monitored by FX traders, who view it as a high-probability opportunity based on a pattern that is rare, but remarkably consistent.
FX rebalancing: mechanics and market players
At the heart of these adjustments lies one key concept: rebalancing. This is the process by which institutional players, pension funds, insurers, central banks, passive managers, bond funds, corporates adjust their FX exposures to stay in line with the targets defined in their mandates.
Every month, the value of their assets (equities, bonds, alternatives) and currency holdings fluctuate. If a currency appreciates sharply, its weight in the portfolio may become too high. Conversely, if a currency weakens, exposure might fall below target. Rebalancing involves buying or selling FX to return to those target allocations.
This process is recurring, predictable, and usually concentrated in a narrow window, the final hours of the trading month, just before the London 4pm fix. Quarter-ends tend to be even more pronounced, as many investors revisit long-term strategic allocations at that time.
Many of these adjustments are driven by systematic models using fixed thresholds, which adds to the consistency and timing of these flows.
Ideal setup: low volatility, high impact
June 2025 ends in a particularly calm environment: equity markets are stable or even rising, and the VIX is trading near its yearly lows, signs of a quiet and balanced market that favors more technical trading. This context is favorable for strategies aiming to take advantage of rebalancing effects, as in the absence of new announcements or unexpected events, these adjustments are likely to have a tangible impact on prices.
Conversely, in a more volatile market environment, such adjustments could be drowned out by larger flows (such as a flight to quality), thus having a reduced or even negligible impact.
FX options: another layer of flows
Another important factor on Monday, June 30: a large number of FX options expire at 10am New York (3pm London). These expiries cover several major pairs, with significant notional amounts concentrated near current spot levels.
According to what is currently being whispered on trading desk chat rooms, we expect the following large expiries:
EUR/USD: €3.0bn at 1.1650 (below spot)
USD/JPY: $1.6bn at 145.50 (above spot)
USD/CHF: $1.8bn at 0.8000 (above spot)
GBP/USD: £1.0bn at 1.3600 (below spot)
AUD/USD: A$1.1bn at 0.6425 (below spot)
When spot approaches these strikes, option holders or sellers may intervene to "pin" prices, based on their delta exposure. This behavior can amplify technical price movements in the hours before expiration.
When these heavy expirations align with month/quarter end rebalancing flows in a quiet, low-volatility market, it creates a strong potential cocktail for tactical moves, conducive to a dollar rebound into the fix.
How to trade the pattern effectively
Here’s a simplified roadmap to navigate this recurring pattern:
Identify monthly or quarterly extremes: look for the currencies that gained or lost the most over the period;
Assess the market environment: a low VIX, no major data or central bank events, meaningful trends, and significant options expiries are ideal conditions;
Use liquid and transparent instruments: Sep 2025 FX futures (standard, e-mini or micro) are currently the most suitable products for active positioning
Set realistic expectations: aim for a 0.5% to 1.0% pullback, not a full-blown trend reversal
Manage risk properly: as with any strategy, always use a stop-loss. This is quantitative trading, not fortune-telling. If the USD continues to weaken despite the setup, be ready to exit swiftly.
In short...
Quarter/month end FX rebalancing is one of the few market events where anticipated institutional flows can create repeatable, high-probability trading opportunities. These flows stem from real portfolio needs and systematic re-hedging, and are often amplified by option expiries and technical positioning.
This setup provides a great educational case study for any trader seeking to better understand hidden FX dynamics. There’s no secret indicator or crystal ball here, just a solid grasp of structural flows and timing.
From a personal standpoint, after over 20 years trading currencies, this strategy remains one of my favorites: simple, effective, and highly instructive. I encourage you to study it closely, and observe its behavior during upcoming month-end windows.
---
When charting futures, the data provided could be delayed. Traders working with the ticker symbols discussed in this idea may prefer to use CME Group real-time data plan on TradingView: tradingview.com/cme/ .
This consideration is particularly important for shorter-term traders, whereas it may be less critical for those focused on longer-term trading strategies.
General Disclaimer:
The trade ideas presented herein are solely for illustrative purposes forming a part of a case study intended to demonstrate key principles in risk management within the context of the specific market scenarios discussed. These ideas are not to be interpreted as investment recommendations or financial advice. They do not endorse or promote any specific trading strategies, financial products, or services. The information provided is based on data believed to be reliable; however, its accuracy or completeness cannot be guaranteed. Trading in financial markets involves risks, including the potential loss of principal. Each individual should conduct their own research and consult with professional financial advisors before making any investment decisions. The author or publisher of this content bears no responsibility for any actions taken based on the information provided or for any resultant financial or other losses.
Buy the Dip into 0.0070 Pre-Expiry Pin & Policy RiskThe Japanese yen has experienced significant swings in recent weeks, both higher and lower, reflecting a fragile balance between diverging monetary policies and ongoing geopolitical uncertainty. That said, its status as a safe-haven currency continues to offer it defensive appeal among global investors, independent of technical flows, such as the major USD/JPY option expiry scheduled for Monday, June 16.
Fundamental Analysis
Central banks have entered a wait-and-see mode. The Federal Reserve is widely expected to hold rates steady at its upcoming June 18 meeting. According to the CME FedWatch tool, markets price in a 97% probability of no change, with only a 3% chance of an immediate cut. In this context, the USD still benefits from rate differentials, but forward guidance is now increasingly balanced over the next 6 months.
Meanwhile, the Bank of Japan has started to normalize its ultra-loose policy. After decades of zero or negative interest rates, the BoJ raised its policy rate to 0.50% in January 2025. Although no hike is expected on June 17, the central bank has signaled vigilance toward imported inflation and yen depreciation. As a result, the USD/JPY interest rate gap remains wide but is gradually narrowing.
On the geopolitical front, Israel’s recent airstrike on Iranian strategic sites has lifted energy prices and reignited risk aversion. The VIX briefly jumped around 22, before retreating to 20. Historically, such uncertainty tends to benefit the yen, as risk-averse capital flows gravitate toward defensive assets.
Technical Analysis
The Japanese currency has gained over 8% year-to-date, with spot USD/JPY retreating to a low of 140 in April. This level corresponds to 0.007263 on the 6JU2025 futures contract.
We now shift focus to the September contract, with the March expiry settling this Monday.
After the volatility spike mostly driven by US tariffs (which pushed the VIX above 50 for the first time since the pandemic), risk conditions have stabilized. The yen has since consolidated within a well-defined range with stable volumes.
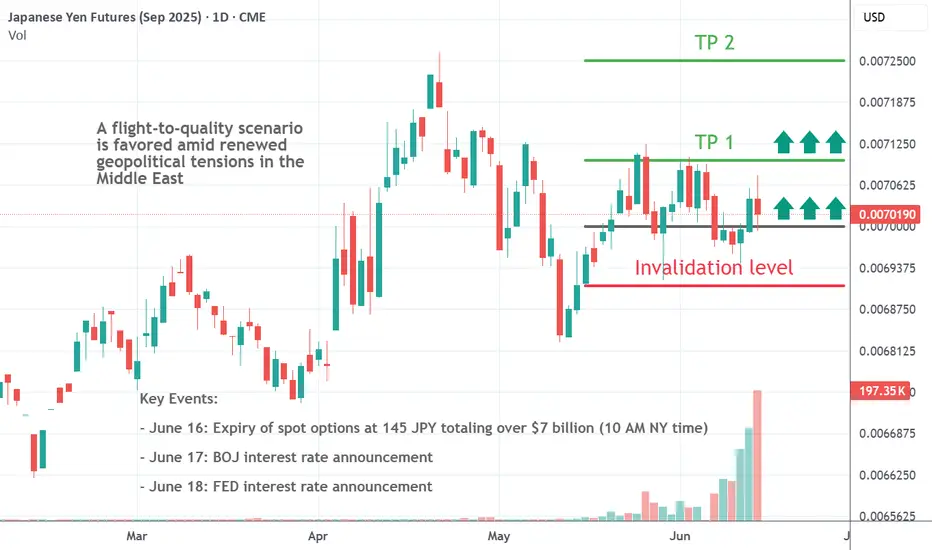
In late May, buyers stepped in aggressively around 0.00692, leading to a sharp rebound to 0.00710. Price action has now stabilized near 0.00700, inside a pivot zone that acts both as equilibrium and a tactical entry area. These dynamics suggest a buy-on-dip strategy may offer strong asymmetry.
If price returns to the 0.00692–0.00700 area, the trade setup remains valid. However, a clean daily break below 0.00691 would invalidate the bullish view and suggest a return to a broader sideways range.
Sentiment Analysis
According to the CFTC Commitment of Traders (COT) report, asset managers remain net long the yen, reflecting a structurally bullish bias. These positions are consistent with macro/geopolitical hedging strategies, and reflect growing expectations that the policy rate differential between the Fed and the BoJ may gradually narrow.
On the retail side, positioning is surprisingly neutral on USD/JPY, a rare condition for a pair often dominated by consensus directional trades. This suggests that retail traders are in a wait-and-see mode, likely due to the policy event risk ahead.
Options Analysis – The $7 Billion USD/JPY 145.00 Magnet
A massive $7+ billion USD/JPY option position at the 145.00 strike is due to expire Monday, June 16, at the 10am NY cut. This level currently acts as a gravitational anchor on spot price action, keeping USD/JPY within a tight range near 145.
Market makers are likely adjusting hedges as expiry approaches, suppressing volatility in the short term. This has also indirectly stabilized the 6JU2025 contract in the 0.00700–0.00705 range.
Once the strike expires, we may see a volatility release and potentially a new trend emerge, depending on the Fed-BoJ policy tone.
Trade Idea – Buy on Dip Around 0.00700
Strategy: Buy the pullback ahead of expiry and potential breakout
• Entry target: Buy at 0.0070000 (tactical dip zone)
• Stop-loss: 0.0069100 (below the May 29 rejection low)
• Take-Profit 1: 0.0071000 (recent resistance)
• Take-Profit 2: 0.0072500 (near YTD highs)
Rationale:
Geopolitical risk and Fed-BoJ policy events support safe-haven flows
• Technically clean reaction from 0.00692 suggests strong buying interest
• Option expiry-induced pin near spot 145 could offer a lower entry window
• COT positioning supports a bullish JPY view
• Attractive risk-reward setup with tight stop
This setup allows traders to take advantage of a volatility compression regime due to options expiry before potential breakout catalysts next week, with well-defined risk.
The 6JU2025 contract is currently resting in a strategic equilibrium zone near 0.00700. Macro fundamentals and speculative positioning both argue in favor of yen stabilization or modest appreciation.
The expiry of the $7B option on Monday, followed by central bank events midweek, could unleash a directional move. Until then, a dip-buying strategy near 0.0070 appears compelling, as long as the 0.00691 support holds on a daily closing basis.
When charting futures, the data provided could be delayed. Traders working with the ticker symbols discussed in this idea may prefer to use CME Group real-time data plan on TradingView: tradingview.com/cme/.
This consideration is particularly important for shorter-term traders, whereas it may be less critical for those focused on longer-term trading strategies.
General Disclaimer:
The trade ideas presented herein are solely for illustrative purposes forming a part of a case study intended to demonstrate key principles in risk management within the context of the specific market scenarios discussed. These ideas are not to be interpreted as investment recommendations or financial advice. They do not endorse or promote any specific trading strategies, financial products, or services. The information provided is based on data believed to be reliable; however, its accuracy or completeness cannot be guaranteed. Trading in financial markets involves risks, including the potential loss of principal. Each individual should conduct their own research and consult with professional financial advisors before making any investment decisions. The author or publisher of this content bears no responsibility for any actions taken based on the information provided or for any resultant financial or other losses.
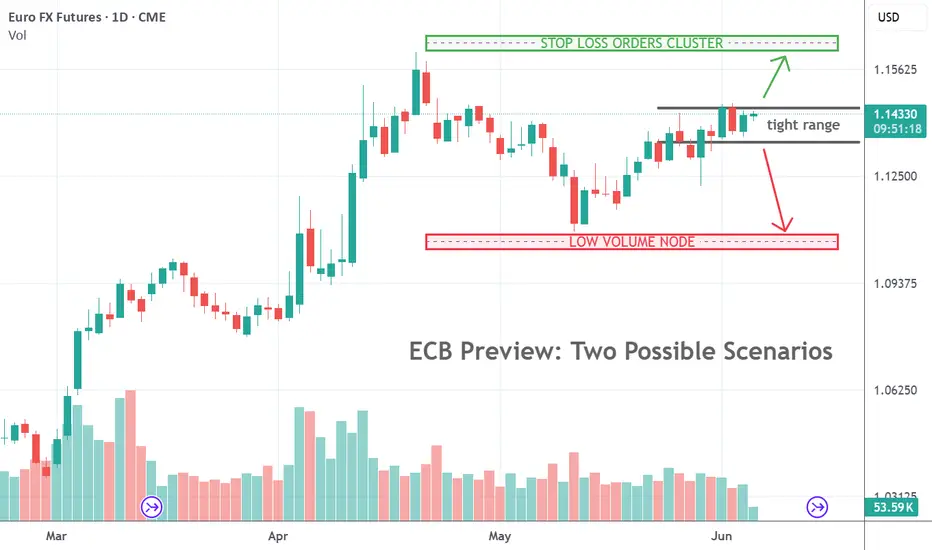
Still waters before ECB waves?This morning, Euro FX futures (June contract 6EM5) are trading around 1.14300, still contained within the upper end of a well-established range between 1.1350 and 1.1450. The volume profile continues to show a heavy concentration of activity around 1.1380, reflecting a neutral stance from market participants as they await the ECB’s policy decision later today.
The macro context is clear: eurozone inflation just came in at 1.9% YoY, a figure already below the ECB’s 2% target, and the consistency of the disinflation trend has shifted expectations. Markets now see today’s 25 basis point rate cut as a near certainty, bringing the deposit rate from 2.40% to 2.15%.
But the real focus lies in the forward guidance. Investors will be watching closely for signals on whether the ECB will continue easing through the summer or adopt a more cautious, data-dependent stance, especially with the Federal Reserve still on hold in a 4.25–4.50% range, and US inflation proving more persistent.
Sentiment remains neutral to slightly bearish: retail traders are still about 60% short, while institutional flows appear more balanced. Implied volatility is low, with EUR/USD vol and the VIX both subdued, creating ideal conditions for range trading, at least on the surface.
With significant open interest sitting at 1.1350 and 1.1400 on the June 6EM5 options board, the market is effectively pinned and in wait mode. Traders will need to stay nimble while the post-decision reaction could break this temporary equilibrium.
Time for perspective: when markets go quiet, let’s get curious
With the market clearly in limbo and no compelling directional trade setup this morning, it’s an ideal opportunity to step back and look deeper at what this range-bound phase might be hiding.
Periods of low volatility and tight consolidation may feel uneventful, but they often precede the most decisive market moves. Traders who understand the structural dynamics behind these calm phases, and why they often lead to sharp breakouts, will be better positioned to react quickly when volatility returns.
So, what exactly makes low volatility environments potentially dangerous? Let’s unpack the mechanics behind the calm-before-the-storm setup.
Why low volatility often precedes an explosive breakout
1. Position buildup and leverage exposure
In range-bound markets, traders tend to build up positions near support and resistance levels, often with excessive leverage. The longer a range holds, the more confident participants become in fading it, creating clusters of stop-loss orders just beyond the boundaries. Once price breaks out, those stops can cascade and generate fast, exaggerated moves in the direction of the breakout. This is particularly relevant in the FX space, where margin and leverage are widely used.
2. Dealer positioning and gamma squeeze risk
Low-volatility regimes are often accompanied by aggressive option selling. Dealers who are short options (typically on both sides) hedge delta exposure daily. As price approaches heavily populated strikes (such as 1.1400), they may be forced to buy or sell futures to remain neutral. If the underlying breaks out beyond a major strike, dealers can become forced buyers or sellers, driving price further in the same direction. This feedback loop is known as a gamma squeeze, and it's a common driver of explosive moves from low-volatility setups.
3. Liquidity compression outside the range
Inside established ranges, liquidity is typically deep. Market makers and passive orders ensure two-sided flow. But once the market breaks out, liquidity can evaporate. With fewer resting orders above resistance or below support, price can jump large distances on relatively light flow. This creates the conditions for quick, directional surges, not because of massive volume, but because of a sudden absence of liquidity.
4. Misleading risk models
Risk systems like Value-at-Risk (VaR) generally rely on recent historical volatility to determine position sizing and exposure. In prolonged calm markets, VaR shrinks and risk budgets expand. Traders and institutions might take on larger positions than they would in more volatile environments, falsely reassured by the quiet. If a breakout suddenly injects volatility into the system, these positions can become excessively risky, triggering a chain of margin calls, forced liquidations, or panic adjustments, all of which further amplify the move.
5. The psychological trap of stability
Perhaps most importantly, low volatility lulls traders into complacency. They shrink their stop losses, stretch their entries, and begin to assume the range will hold “because it has.” But volatility is mean-reverting by nature. When a catalyst appears, be it a surprise from the ECB, geopolitical headlines, or simply a technical breakout, the transition from low to high volatility is often violent and abrupt.
Final thought: expect the unexpected
Traders, especially retail traders, love quiet markets, until they stop being quiet. This morning, the euro is pinned in place, volatility is suppressed, and positioning is relatively balanced. But beneath this apparent calm lies a market ripe for reprice.
The ECB is widely expected to cut rates by 25 basis points today, that much is in the price. What’s not yet priced, however, is the exact message that will accompany the move. If the ECB delivers a dovish tone, the euro is likely to weaken. But if the statement or press conference turns out more hawkish than expected, even slightly, the euro could rally sharply.
When volatility is cheap and expectations are compressed, it takes little to unleash a large move. So while there’s no clear trade to take right now, this is the kind of day that sets the tone for the next few weeks.
When charting futures, the data provided could be delayed. Traders working with the ticker symbols discussed in this idea may prefer to use CME Group real-time data plan on TradingView: tradingview.com/cme/.
This consideration is particularly important for shorter-term traders, whereas it may be less critical for those focused on longer-term trading strategies.
General Disclaimer:
The trade ideas presented herein are solely for illustrative purposes forming a part of a case study intended to demonstrate key principles in risk management within the context of the specific market scenarios discussed. These ideas are not to be interpreted as investment recommendations or financial advice. They do not endorse or promote any specific trading strategies, financial products, or services. The information provided is based on data believed to be reliable; however, its accuracy or completeness cannot be guaranteed. Trading in financial markets involves risks, including the potential loss of principal. Each individual should conduct their own research and consult with professional financial advisors before making any investment decisions. The author or publisher of this content bears no responsibility for any actions taken based on the information provided or for any resultant financial or other losses.
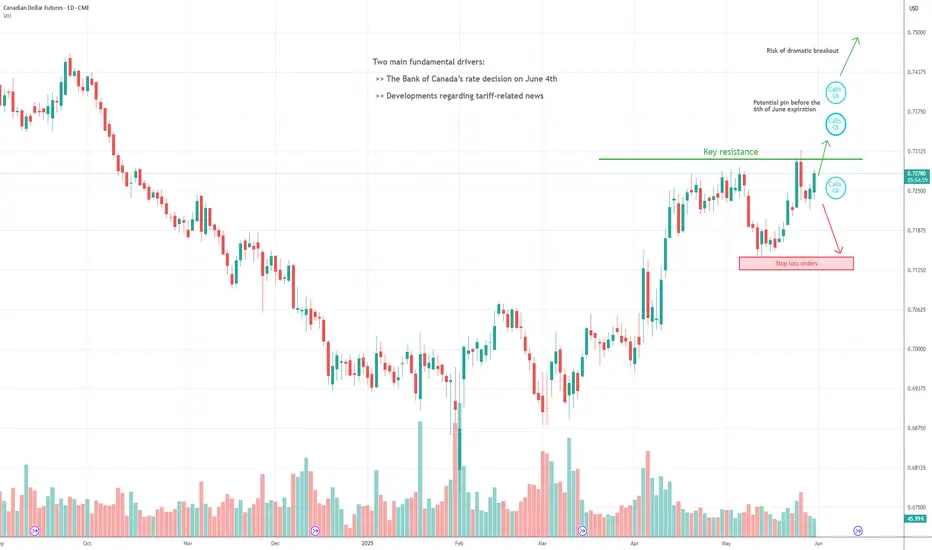
Action Plan for the Next Big MoveThe Canadian Dollar (CAD) is trading around 0.725, caught in a rare balance where clear conviction is elusive and volatility appears to be compressing, beneath the surface, the stage is set for a potentially explosive move. With the Bank of Canada set to announce its policy decision next week and trade issues with the US still simmering, the market feels poised for a major breakout, even as the immediate backdrop remains subdued.
Fundamental Analysis: Waiting Game with Trade Tension
All eyes are on the Bank of Canada’s upcoming decision. The policy rate, having dropped to 2.75% after a string of seven cuts, now stands at its lowest level in nearly three years. The latest inflation print (1.7%) supports a cautious stance, and the market is pricing in a 70% chance of no change. Yet, this calm could be deceptive: should inflation slip further or job data disappoint, talk of renewed easing will return quickly.
Canada’s deep trade relationship with the United States means any change in tariff policy is especially consequential. Although a US court recently ruled in favor of Canada, experts warn that the broader tariff debate is far from over. Any fresh escalation or, conversely, an easing of trade tensions could move the CAD sharply in either direction. Meanwhile, a mild rebound in oil prices adds some support, but the real driver remains policy and politics.
For now, fundamentals argue for patience, with no strong directional bias until the next catalyst emerges.
Technical Analysis: Tight Range, But Pressure Is Building
Price action has settled into a well-defined range after the sharp volatility of late May. The contract retreated to the point of control at 0.7220, absorbing liquidity and confirming this zone as reliable short-term support. On the upside, repeated failures above 0.73, including rejection wicks earlier this week, highlight strong resistance and a market not yet ready to commit to a sustained trend.
Despite the lack of a decisive move, this compression phase often precedes an outsized breakout, especially with macro catalysts on the horizon.
Sentiment Analysis: Crosswinds, Not Clarity
Institutional flows show a recent uptick in short positions on the CAD, while retail sentiment appears balanced to slightly bullish CAD (short USD/CAD), reflecting indecision. The VIX, now close to its annual average, signals that risk appetite is neutral, there’s little evidence of panic or euphoria. This cocktail leaves the CAD without a clear consensus but suggests that when conviction returns, the move could be sharp.
Listed Options Analysis: Pin Risk, Gamma Potential, and the Calm Before Volatility
The monthly options board reveals significant open interest in calls clustered between 0.7350 and 0.74 for the next expiration, the 6th of June, while downside protection is less pronounced. Implied volatility, though lower than recent extremes, remains elevated compared to historical averages, and there’s a mild bias toward downside hedges. If spot moves above 0.73, options dynamics could quickly flip, fueling an upside acceleration toward 0.7350 or even higher, as dealers are forced to chase delta hedges. A pin at these strikes is possible if the move is not explosive, but a genuine breakout could be dramatic.
Trade Idea: Flexibility Over Forecasting
With so many crosscurrents and volatility compressing, the market appears primed for a breakout. Rather than forcing a directional bet, the most rational approach is to prepare for both outcomes with clear levels.
Bullish Breakout Scenario
Entry: Buy above 0.7320 (daily close or strong breakout confirmation)
Stop: 0.7245 (below recent support)
Target 1: 0.7395 (OI cluster)
Target 2: 0.7500 (psychological level)
Bearish Breakdown Scenario
Entry: Sell below 0.7220 (daily close or strong breakout confirmation)
Stop: 0.7310 (above the prior resistance)
Target: 0.7145 (recent lows/retail stops)
Rather than predict, this approach lets price action dictate. Volatility may be low for now, but context argues that a range breakout, especially to the upside, could be sudden and violent given options positioning and macro uncertainty.
With policy on pause, trade headlines pending, and options open interest suggesting magnetic levels higher, the CAD sits on the edge of potential. As volatility compresses, the market’s indecision is itself the clearest signal: the next major move, when it comes, is likely to be fast and fueled by positioning. Flexibility, not bias, is the trader’s greatest edge in this environment. Be ready for it.
When charting futures, the data provided could be delayed. Traders working with the ticker symbols discussed in this idea may prefer to use CME Group real-time data plan on TradingView: tradingview.com/cme/.
This consideration is particularly important for shorter-term traders, whereas it may be less critical for those focused on longer-term trading strategies.
General Disclaimer:
The trade ideas presented herein are solely for illustrative purposes forming a part of a case study intended to demonstrate key principles in risk management within the context of the specific market scenarios discussed. These ideas are not to be interpreted as investment recommendations or financial advice. They do not endorse or promote any specific trading strategies, financial products, or services. The information provided is based on data believed to be reliable; however, its accuracy or completeness cannot be guaranteed. Trading in financial markets involves risks, including the potential loss of principal. Each individual should conduct their own research and consult with professional financial advisors before making any investment decisions. The author or publisher of this content bears no responsibility for any actions taken based on the information provided or for any resultant financial or other losses.
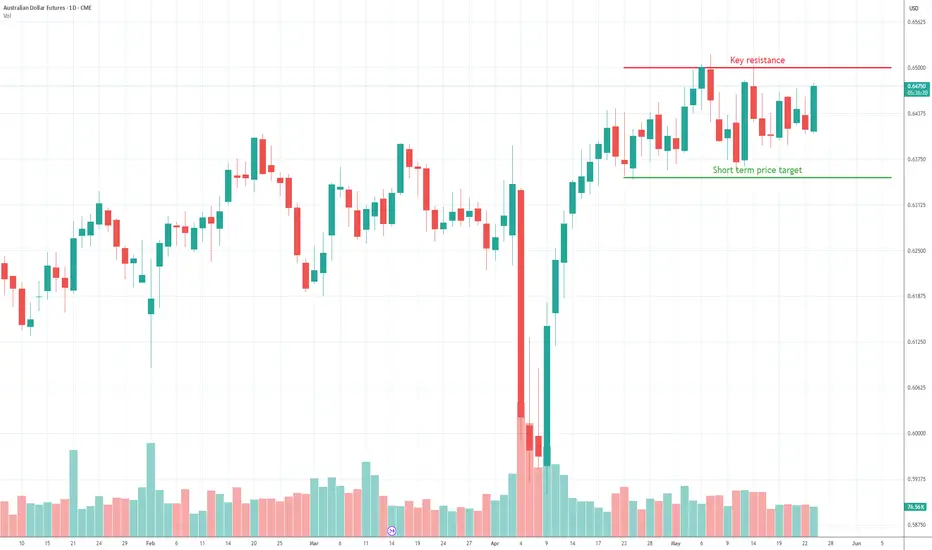
Stuck in a Squeeze, Fade the TopAs the Australian Dollar, a currency traditionally correlated with risk, has been trading in a range since mid-April, fading rallies near the top of that range appears to offer the best odds in the current environment. Here’s the breakdown.
Fundamental Analysis
The Australian Dollar continues to move without clear direction as the Reserve Bank of Australia (RBA) pursues a clearly dovish path. The RBA’s most recent 25bp rate cut, bringing the official cash rate down to 3.85%, was justified by the central bank’s confidence that inflation is returning to target, coupled with lingering global uncertainties. According to the RBA Rate Tracker, markets are now assigning a 70% probability to yet another 25bp rate cut at the next meeting, an outlook that continues to weigh heavily on AUD yields and the currency’s appeal.
On the other side of the Pacific, the CME FedWatch Tool shows that traders do not expect any policy easing from the Federal Reserve before late summer at the earliest. This means the US-Australia interest rate differential is likely to increase, making it even more expensive to hold AUD against the greenback.
Compounding the challenges for the Aussie is the ongoing economic slowdown in China, Australia’s largest trading partner. With Chinese demand for commodities muted, there is little external support for the AUD.
Technical Analysis
Technically, after a sharp rebound in early April, the Aussie has remained stuck in a frustratingly tight range, unable to regain any significant upward momentum. Since its highs at the end of September, the currency is still down almost 7%. Price action has been confined to a broad consolidation zone between 0.6350 and 0.65 USD for over a month, with sellers consistently capping rallies at the upper end.
The volume profile analysis reveals a heavy concentration of traded volume in the 0.6440–0.6465 band, reinforcing this area as a significant battle zone where sellers are likely to defend their ground. For the bulls to regain control, a sustained break above 0.6520 would be needed, something that appears unlikely in the current macro context.
Sentiment Analysis
From a positioning perspective, the CFTC’s Commitment of Traders (COT) report shows that large speculators continue to hold net short positions in the Aussie, signaling ongoing professional bearish bias.
Retail sentiment paints a similarly contrarian picture: broker data from FX/CFD platforms indicates a slim majority of retail traders remain long AUD/USD, with some brokers showing more than 70% long positions. This crowded long condition means there is still fuel for further downside, especially if key support levels give way. Notably, retail stop losses are clustered between 0.6400 and 0.6350, and these could act as accelerants if triggered by a downside break.
In addition, risk sentiment remains fragile. While the VIX has eased somewhat, it struggles to remain sustainably below 20, a sign that investor nerves are still on edge and defensive flows are likely to persist.
Listed Options Analysis
The options market continues to reinforce the idea that rallies will struggle to gain traction. Open interest on call options remains heavily concentrated above spot, particularly at the 0.6500, 0.6525, 0.6550, and 0.6600 strikes, creating a robust technical ceiling. This makes it difficult for the Aussie to stage any sharp or lasting rallies.
In contrast, open interest on put options is moderate and scattered, with the largest concentrations around 0.6400 and 0.6450, but there is no significant put wall below spot. The put/call open interest ratio is close to parity, indicating a relatively balanced positioning between calls and puts, with no strong directional bias from the options market.
Implied volatility for the front month remains elevated around 9.8–10.1%, and the risk reversal remains slightly negative, suggesting a modest preference for downside protection, but markets are not in panic mode. The heavy concentration of call OI above spot still introduces some gamma risk: if the market rallies into the 0.6500–0.6550 zone, a short squeeze could briefly occur, but such moves are likely to encounter renewed selling pressure and fade quickly.
Trade Idea
With the RBA set to remain dovish, China’s demand subdued, and global risk aversion remaining elevated, the Aussie remains a tactical short on rallies. The macro, technical, and sentiment picture all favor a bearish stance.
Entry: Short Australian Dollar (6AM5) on rallies to 0.6440–0.6465
Stop: 0.6520 (just above high-volume node and call OI cluster)
Target: 0.6350 (support, stop loss cluster below 0.64)
The trade provides a risk/reward ratio close to 2:1, thanks to a tight stop above resistance and a realistic profit target near support.
However, the outlook could change if the Fed pivots more dovishly than expected after the recent Moody’s downgrade of US debt. The FX landscape could shift rapidly and trigger a covering rally in AUD/USD.
For now, though, the odds favor playing from the short side. We’ll monitor stops closely and be ready to adapt if the macro winds start to shift.
When charting futures, the data provided could be delayed. Traders working with the ticker symbols discussed in this idea may prefer to use CME Group real-time data plan on TradingView: tradingview.com/cme/.
This consideration is particularly important for shorter-term traders, whereas it may be less critical for those focused on longer-term trading strategies.
General Disclaimer:
The trade ideas presented herein are solely for illustrative purposes forming a part of a case study intended to demonstrate key principles in risk management within the context of the specific market scenarios discussed. These ideas are not to be interpreted as investment recommendations or financial advice. They do not endorse or promote any specific trading strategies, financial products, or services. The information provided is based on data believed to be reliable; however, its accuracy or completeness cannot be guaranteed. Trading in financial markets involves risks, including the potential loss of principal. Each individual should conduct their own research and consult with professional financial advisors before making any investment decisions. The author or publisher of this content bears no responsibility for any actions taken based on the information provided or for any resultant financial or other losses.
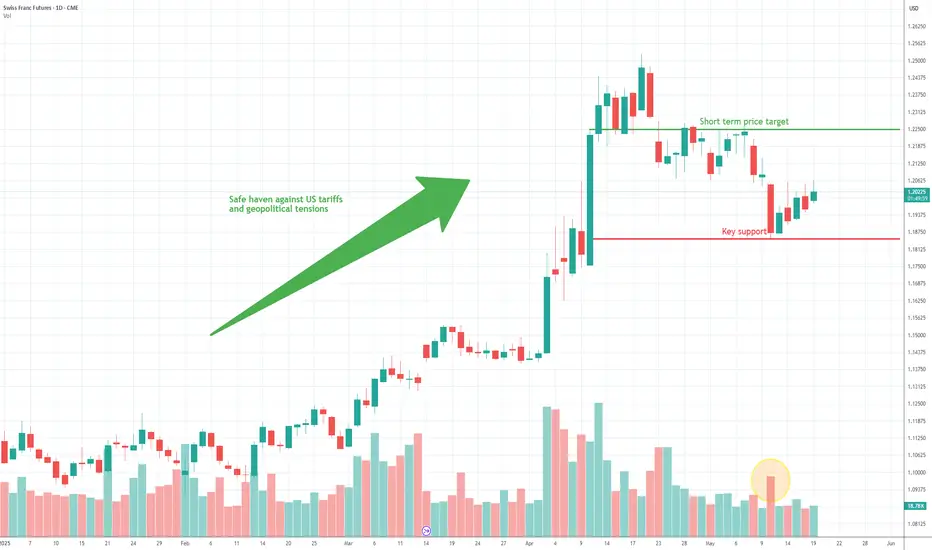
Swiss Shield: Buy the DipThe tariff agreement that seemingly fell from the Geneva sky earlier this month convinced investors to pivot toward risk-linked assets, allowing the Swiss currency to retreat temporarily. However, the Franc’s safe-haven status, combined with the fragile balance currently settling over the markets, leads us to view this pullback as a tactical opportunity to buy at attractive levels.
Fundamental Analysis
While there are indeed factors that could support a continued weakening of the Franc, such as the interest rate differential between the U.S. and Switzerland, which might spark carry trade flows in favor of the dollar, experienced investors know better than to rely solely on interest rates to navigate the complexities of currency markets. Beneath the surface lies a dense web of competing incentives and mechanisms.
True, the Swiss National Bank (SNB) has repeatedly warned of a possible return to negative rates since the beginning of the year, and is due to announce its next policy decision on June 19. The market currently expects a 25-basis-point rate cut, from 0.25% to 0%, prompted by persistently weak inflation data.
And yet, the Swiss Franc has gained nearly 8% in 2025, proof that the erratic trade stance of the White House and the unpredictable temperament of its new occupant are outweighing rate differentials and continuing to boost safe-haven demand, with the Franc at the top of the list.
Despite this week’s much-publicized announcements, which so far apply only for 90 days, the medium-term outlook remains highly unstable. Trying to guess the next provocation from the U.S. president is anyone’s game. Of course, interpreting market price action is never straightforward, but that task becomes even murkier when populism takes root at the highest levels of decision-making.
It’s also worth remembering that U.S. tariffs remain historically high despite the recent agreement with China. According to Yale’s research lab, and based on some fairly sophisticated modeling, the effective U.S. tariff rate is still at its highest level since 1934.
In this environment, the Swiss Franc seems well-positioned to retain favor among currency traders as part of a classic fly-to-quality move in times of uncertainty.
The main risk here lies in the SNB's willingness, or lack thereof, to actively weigh on the Franc in an attempt to revive sluggish inflation. But for now, it's far from clear that the central bank is prepared to return to such controversial tactics, especially given its past accusations of exchange rate manipulation.
Technical Analysis
From a technical standpoint, the Franc’s recent retreat has opened up a compelling buying opportunity. Earlier this week, prices dropped to around 1.1850, precisely filling a low-volume area that hadn’t been revisited since April 10.
Upon hitting this support, algorithmic strategies that specialize in gap-filling stepped in aggressively, with rising volume confirming the reaction. The rebound could continue, especially with reported corporate interest accumulating in the 1.1950–1.1980 zone, according to various trading chat channels.
The next significant resistance stands around 1.2250, a level that has repeatedly capped upward moves since April 23.
Sentiment Analysis
Starting with the CFTC Commitment of Traders (COT) report, asset managers have remained net short on the Franc for several years. However, this positioning is typically driven by hedging needs, such as covering equity portfolios, rather than directional conviction. As historical data shows, these short exposures rarely prevent the Swiss currency from rallying.
On the retail side, aggregated data from various FX/CFD brokers shows that individual traders, whose positioning is often used as a contrarian indicator, remain heavily long USD/CHF, and therefore short the Franc. In some cases, this proportion exceeds 90%. Such crowding could provide fuel for a short squeeze if the market turns.
Finally, the VIX has drifted back below the psychological 20 mark following recent developments, after previously surging above 50 last month, levels not seen since the pandemic. This presents a paradox: on one hand, volatility appears to be easing, but on the other, the broader situation remains unstable, with markets hanging on every word from Donald Trump.
Trade Idea
In summary, the fundamental, technical, and sentiment-based analyses all suggest that the recent dip to 1.1850 was more likely an emotional overreaction to headlines than the beginning of a structural downtrend. Despite some headwinds, notably the SNB’s close attention to the exchange rate, the Franc’s safe-haven appeal continues to outweigh other catalysts in a market where volatility remains fragile and unstable.
Entry: Long Swiss Franc futures (6SM5) at current levels
Stop: Daily close below 1.1850, which would invalidate the key support based on volume profile structure
Target: 1.2250, a resistance level that has already been tested multiple times since late April, offering a solid risk/reward setup.
When charting futures, the data provided could be delayed. Traders working with the ticker symbols discussed in this idea may prefer to use CME Group real-time data plan on TradingView: tradingview.com/cme/.
This consideration is particularly important for shorter-term traders, whereas it may be less critical for those focused on longer-term trading strategies.
General Disclaimer:
The trade ideas presented herein are solely for illustrative purposes forming a part of a case study intended to demonstrate key principles in risk management within the context of the specific market scenarios discussed. These ideas are not to be interpreted as investment recommendations or financial advice. They do not endorse or promote any specific trading strategies, financial products, or services. The information provided is based on data believed to be reliable; however, its accuracy or completeness cannot be guaranteed. Trading in financial markets involves risks, including the potential loss of principal. Each individual should conduct their own research and consult with professional financial advisors before making any investment decisions. The author or publisher of this content bears no responsibility for any actions taken based on the information provided or for any resultant financial or other losses.
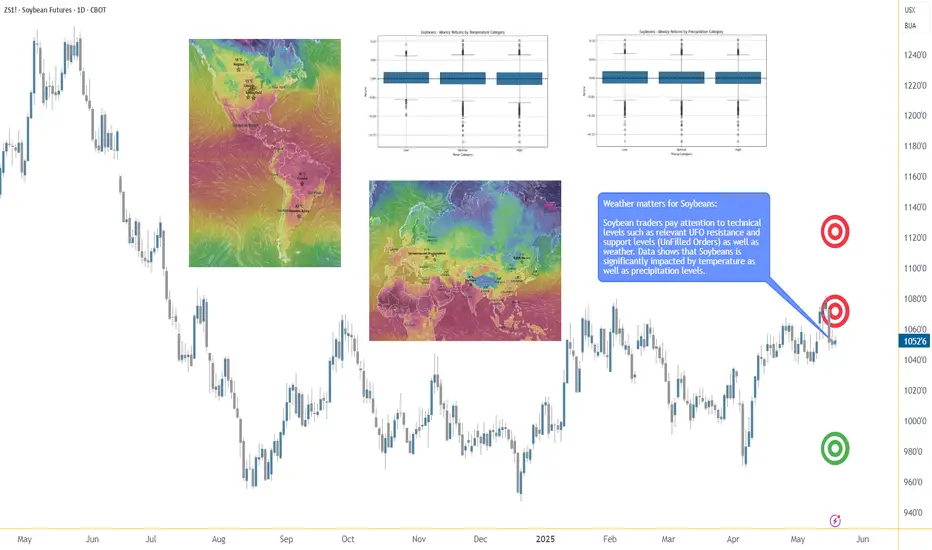
Soybeans: The Global Protein Powerhouse🟡 1. Introduction
Soybeans might not look like much at first glance — small, round, unassuming. But behind every bean lies a global story of protein demand, export flows, and economic policy.
They feed livestock, fuel vehicles, nourish entire populations, and move markets. In fact, soybeans sit at the intersection of agriculture, industry, and geopolitics — making them one of the most actively traded and strategically watched commodities in the world.
If you’re looking to understand how soybeans move markets — and how you can trade them effectively — this article is your starting point.
🌍 2. Why the World Cares About Soybeans
Few agricultural commodities carry the weight soybeans do. Their importance spans both the food and energy sectors — and their global footprint is enormous.
Here’s why they matter:
Protein Meal: After processing, about 80% of the soybean becomes high-protein meal used to feed poultry, pigs, and cattle.
Soybean Oil: Roughly 20% is extracted as oil — a key ingredient in cooking, industrial products, and increasingly, biodiesel.
Biofuels: As the push for renewable energy grows, soybean oil plays a major role in sustainable fuel strategies.
Top producers:
United States — historically the world’s largest producer.
Brazil — now rivals or exceeds U.S. production in some years.
Argentina — a dominant player in soybean meal and oil exports.
Top importers:
China — imports over 60% of globally traded soybeans.
EU, Mexico, Japan — also large buyers.
Soybeans are a bridge commodity — connecting livestock feed, food manufacturing, and renewable energy. That’s why traders from Chicago to Shanghai watch every yield forecast and export announcement closely.
💹 3. CME Group Soybean Contracts
Soybeans trade on the CME Group’s CBOT platform, with two main futures products:
o Standard Soybeans
Ticker: ZS
Size = 5,000 bushels
Tick = 0.0025 = $12.50
Margin = ~$2,150
o Micro Soybeans
Ticker: MZS
Size = 500 bushels
Tick = 0.0050 = $2.50
Margin = ~$215
Soybean futures are among the most actively traded agricultural contracts, offering deep liquidity, tight spreads, and excellent volatility for strategic traders. Keep in mind that margins are subject to change — always confirm with your broker. Micro contracts are ideal for scaling in/out of trades or learning market structure without large capital risk.
📅 4. The Soybean Calendar
Soybeans follow a seasonal cycle that creates rhythm in the market — and a potential edge for informed traders.
In the United States:
🌱 Planting: Late April to early June
☀️ Pod development / blooming: July and early August (weather-sensitive)
🌾 Harvest: September through November
In Brazil:
🌱 Planting: October to December
🌾 Harvest: February through April
This staggered calendar means that soybean markets have multiple weather risk windows each year. It also means the export flows and global pricing dynamics shift between the Northern and Southern Hemispheres throughout the calendar year.
That’s why soybeans tend to have two major volatility windows — mid-summer (U.S. crop concerns) and early Q1 (South American weather). Traders often build seasonal strategies around these patterns — buying weakness before key USDA reports, fading rallies during overbought harvests, or trading futures spreads between U.S. and Brazilian supply flows.
🔄 5. How Soybeans Are Traded Globally
Soybeans move through a complex international web of growers, crushers, exporters, and consumers. As a trader, understanding this flow is essential — because each node introduces price risk, opportunity, and reaction points.
Key players:
o Hedgers:
U.S. and Brazilian farmers hedge production risk using futures or options on futures.
Exporters hedge shipping schedules against fluctuating basis and FX risk.
o Crushers:
Companies like Cargill or Bunge buy soybeans to crush into meal and oil.
Crush margin (aka “board crush”) affects demand and influences futures spreads.
o Speculators:
Institutional funds trade soybeans as a macro or relative value play.
Retail traders use micro contracts (MZS) to capture directional or seasonal moves.
o China:
Its purchasing pace (or sudden cancellations) can move markets dramatically.
Announcements of bulk U.S. purchases could trigger short-covering rallies.
Additionally, soybeans are sometimes traded indirectly via their by-products:
Soybean Meal (ZM)
Soybean Oil (ZL)
These contracts often lead or lag ZS based on demand shifts in feed or fuel.
📈 6. What Makes Soybeans Unique to Trade
Compared to wheat and corn, soybeans are:
More weather-sensitive during July and August (especially to drought and heat).
More globally integrated, thanks to China’s dominant import role.
More complex, due to crush dynamics and multiple end-use markets.
This multifaceted nature is why many professional traders monitor soybeans, even if they aren’t actively trading them every week.
📌 7. Summary / Takeaway
Soybeans are one of the most important — and most tradable — commodities in the world. They feed livestock, fuel industry, and anchor the agricultural markets across two hemispheres.
Their unique role in food, fuel, and feed makes them more than just another contract — they’re a barometer for global health, demand, and policy.
Whether you’re trading the standard ZS contract or getting started with MZS, mastering soybeans means understanding weather, trade flows, product demand, and seasonality.
🧭 This article is part of our agricultural futures trading series.
📅 Watch for the next release: “Weather and Corn: A Deep Dive into Temperature Impact”
When charting futures, the data provided could be delayed. Traders working with the ticker symbols discussed in this idea may prefer to use CME Group real-time data plan on TradingView: tradingview.sweetlogin.com - This consideration is particularly important for shorter-term traders, whereas it may be less critical for those focused on longer-term trading strategies.
General Disclaimer:
The trade ideas presented herein are solely for illustrative purposes forming a part of a case study intended to demonstrate key principles in risk management within the context of the specific market scenarios discussed. These ideas are not to be interpreted as investment recommendations or financial advice. They do not endorse or promote any specific trading strategies, financial products, or services. The information provided is based on data believed to be reliable; however, its accuracy or completeness cannot be guaranteed. Trading in financial markets involves risks, including the potential loss of principal. Each individual should conduct their own research and consult with professional financial advisors before making any investment decisions. The author or publisher of this content bears no responsibility for any actions taken based on the information provided or for any resultant financial or other losses.