MBTC1!/BTC1! Day Trade Plan for 02/10/25MBTC1!/BTC1! Day Trade Plan for 02/10/25
📈 99590
📉 93365
Like and share for more daily ES/NQ levels 🤓📈📉🎯💰
(💎: IF THERE IS NOT MUCH VOLATILITY; FOCUS ON ZONES VERSES INDIVIDUAL PRICE LEVELS)
*These levels are derived from comprehensive backtesting and research, demonstrating over 90% accuracy. This statistical foundation suggests that price movements are likely to exceed initial estimates.*
Futurestrading

Market Update: Tariffs, Trade Shifts & Bitcoin's Next MoveCME:BTC1!
News and Economic Calendar Update
President Trump announced 25% tariffs on all steel and aluminum imports, effective Monday, with reciprocal tariffs to follow on Tuesday or Wednesday. As Trump has shared, “if they tax us, we tax them the same amount.” This move is expected to reshape global trade relations, with China reportedly considering probes into U.S. tech firms such as Broadcom (AVGO) and Synopsys (SNPS), according to WSJ. Japan's PM Ishiba remains optimistic about avoiding higher U.S. tariffs, while Australia and India are negotiating exemptions and trade concessions. Meanwhile, the EU has hinted at retaliatory measures should new tariffs be imposed.
The U.S. dollar strengthened following Friday’s jobs report and fresh tariff announcements, while the Japanese yen under-performed. The EUR/USD briefly dipped below 1.03 before rebounding, and the British pound remained stable ahead of comments from BoE’s Mann. U.S. Treasury yields were unchanged, while European bunds edged higher amid rising trade concerns.
Gold surged to an all-time high above $2,900/oz, reflecting increased demand for safe-haven assets due to tariff uncertainty. Meanwhile, crude oil reached session highs, and European natural gas prices climbed to a two-year peak due to colder temperatures and tight storage.
Looking Ahead
Key upcoming data releases include Fed Chair Powell’s testimony, U.S. CPI data, Chinese M2 Money Supply, and U.S. retail sales. Additionally, multiple central bank officials are scheduled to speak throughout the week, providing further insights into monetary policy direction.
Macro Update: Trade War 2.0 and Tariff Shifts Impact Markets.
The latest reciprocal tariff announcements from Trump, in our view, presents a strategic opportunity for the U.S. This approach enables negotiations for lower tariffs on U.S. exports with individual trading partners, fostering a more flexible and targeted trade policy. This shift aligns more with global trade integration and could provide a more balanced framework for U.S. exporters.
Gold continues to exhibit renewed strength as a safe-haven asset, marking fresh all-time highs amid market uncertainty. Meanwhile, Bitcoin—often referred to as "digital gold"—has lagged behind, struggling in a climate of risk-off sentiment. However, it remains within its post-election trading range, signaling resilience despite broader market volatility.
At the fiscal level, U.S. House Republican leaders are proposing federal spending cuts ranging between $2 trillion to $2.5 trillion, according to Punchbowl sources. These cuts are expected to focus heavily on Medicaid spending. However, the effectiveness of government spending adjustments remains in question—whether such measures will enhance efficiency or simply reduce overall spending is yet to be seen. In addition, extending President Trump’s tax proposals could cut revenue by $5-11T over a decade, potentially pushing U.S. debt to 132-149% of GDP by 2035. Senate Republicans propose $342B in border and defense spending, with offsetting cuts. Meanwhile, Musk’s DOGE Service aims to automate government functions, reduce the federal workforce, and slash spending.
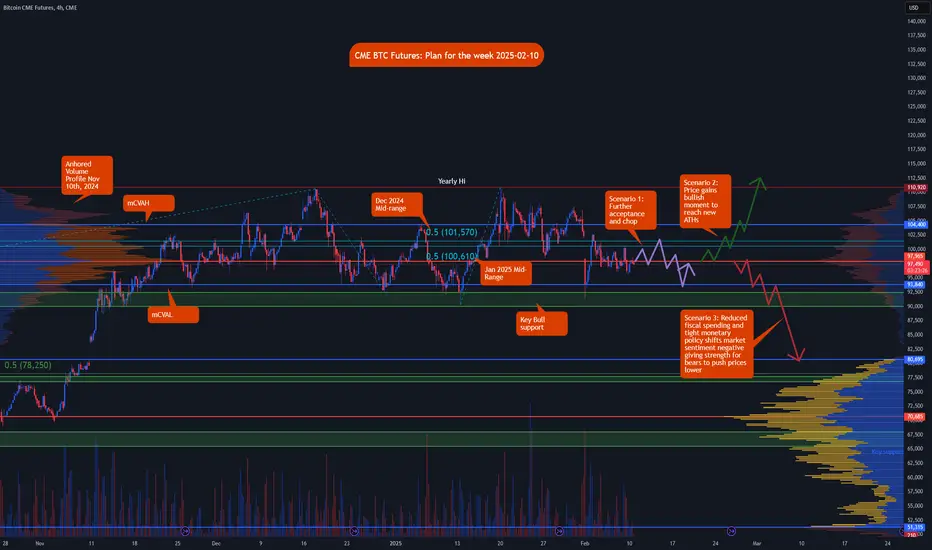
Bitcoin Big Picture:
Bitcoin has been consolidating after making new all time highs post US elections. Although price action and consolidation points towards further bullishness. We remain cautious and prepared for any of the scenarios that may happen as a result of many different factors influencing risk assets and market sentiment.
To better manage your exposure to Bitcoin, consider using CME’s Micro Bitcoin and Bitcoin Friday Futures . Additionally, you can take part in the CME and TradingView paper trading competition, allowing you to showcase your Micro Bitcoin trading skills in The Leap —risk-free.
Key Levels to Watch
Key levels represent areas of interest and zones of active market participation. The more significant a key level, the closer we monitor it for potential reactions and trade setups in alignment with our trading plan.
Yearly Hi: 110,920
mCVAH: 104,400
Dec 2024 mid range: 101,570
Jan 2025 mid range: 100,610
mCVPOC: 98,075
mCVAL: 93,730
Key Bull Support: 92,505 - 90,000
Scenario 1: Further chop and acceptance
In this scenario, we may see price action remain range bound. Traders look for clarity on how policy may affect market sentiment before further committing capital.
Scenario 2: New ATHs
Price attempts to create new ATHs which marks a significant move. Although bitcoin created new all time highs in January 2025, these were rejected and price action pointed towards market top.
Scenario 3: Souring market sentiment
Scenario 2 and 3 requires remaining alert to all developments as fundamental and macro news is turning ever so significant in driving short-term volatility and price action.
Any further hint towards tighter monetary policy and tighter fiscal policy may send BTC prices lower very quickly.
Leap Ahead with a Bearish Divergence on Gold FuturesThe Leap Trading Competition: A Chance to Trade Gold Futures
TradingView’s "The Leap" Trading Competition is an opportunity for traders to test their futures trading skills. Participants can trade select CME Group futures contracts, including Gold Futures (GC) and Micro Gold Futures (MGC).
Register and participate here: TradingView Competition Registration .
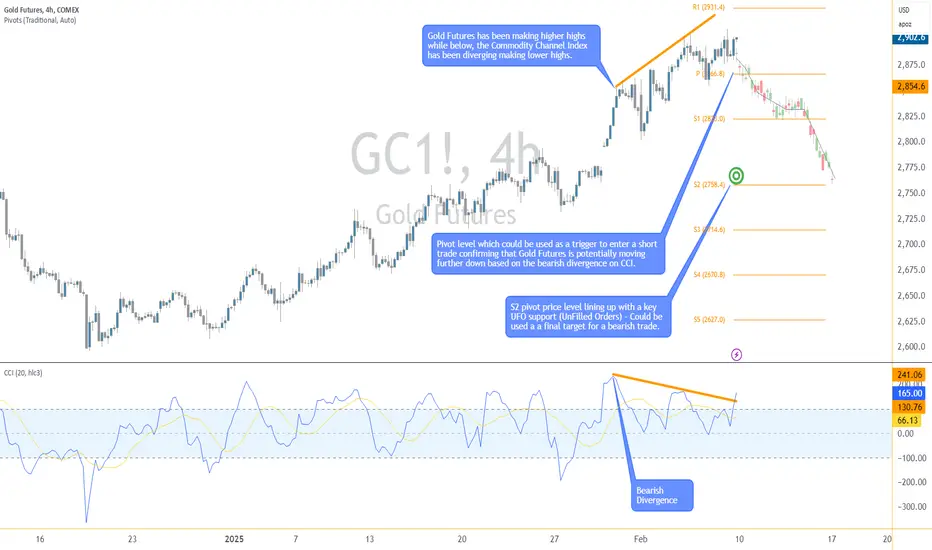
This article presents a structured short trade setup based on a bearish divergence identified using the Commodity Channel Index (CCI) and key pivot point levels for confirmation. The trade plan focuses on waiting for price to break below the pivot point at 2866.8 before executing the trade, with clear targets and risk management.
Identifying the Trade Setup
Bearish divergence occurs when price makes higher highs while an indicator, such as CCI, makes lower highs. This signals weakening momentum and a potential reversal. The Commodity Channel Index (CCI) measures price deviations from its average and helps traders identify overbought or oversold conditions.
Pivot points are calculated from previous price action and serve as key support and resistance levels. The pivot at 2866.8 is the reference level in this setup. A breakdown below this level may suggest further downside momentum, increasing the probability of a successful short trade.
The trade plan combines CCI divergence with pivot point confirmation. While divergence signals a potential shift, entry is only considered if price trades below 2866.8. This approach reduces false signals and improves trade accuracy. The first target is set at 2823.0, aligning with an intermediate support level (S1), while the final target is near S2 at 2776.2, just above a UFO support zone.
Trade Plan and Risk Management
The short trade is triggered only if price trades below 2866.8. The stop loss is placed above the entry at a level ensuring at least a 3:1 reward-to-risk ratio.
Profit targets are structured to lock in gains progressively:
The first exit is at 2823.0, where partial profits can be taken.
The final exit is near 2776.2, positioned just above a UFO support level.
Stop placement may vary based on the trader’s preferred risk-reward ratio. Position sizing should be adjusted according to account size and market volatility.
Contract Specifications and Margin Requirements
Gold Futures (GC) details:
Full contract specs: GC Contract Specifications – CME Group
Contract size: 100 troy ounces
Tick size: 0.10 per ounce ($10 per tick)
Margin requirements depend on broker conditions and market volatility. Currently around $12,500 per contract.
Micro Gold Futures (MGC) details:
Full contract specs: MGC Contract Specifications – CME Group
Contract size: 10 troy ounces (1/10th of GC)
Tick size: 0.10 per ounce ($1 per tick)
Lower margin requirements provide access to smaller traders. Currently around $1,250 per contract.
Leverage impacts both potential gains and losses. Traders should consider market conditions and margin requirements when adjusting position sizes.
Execution and Market Conditions
Before executing the trade, price must break below 2866.8. Additional confirmation can be sought through volume trends and price action signals.
If price does not break the pivot, the short setup is invalid. If price consolidates, traders should reassess momentum before committing to the trade.
Conclusion
Bearish CCI divergence signals potential market weakness, but confirmation from the pivot breakdown is key before executing a short trade. A structured approach with well-defined targets and risk management increases the probability of success.
For traders in The Leap Trading Competition, this setup highlights the importance of discipline, confirmation, and scaling out of trades to manage risk effectively.
When charting futures, the data provided could be delayed. Traders working with the ticker symbols discussed in this idea may prefer to use CME Group real-time data plan on TradingView: tradingview.sweetlogin.com - This consideration is particularly important for shorter-term traders, whereas it may be less critical for those focused on longer-term trading strategies.
General Disclaimer:
The trade ideas presented herein are solely for illustrative purposes forming a part of a case study intended to demonstrate key principles in risk management within the context of the specific market scenarios discussed. These ideas are not to be interpreted as investment recommendations or financial advice. They do not endorse or promote any specific trading strategies, financial products, or services. The information provided is based on data believed to be reliable; however, its accuracy or completeness cannot be guaranteed. Trading in financial markets involves risks, including the potential loss of principal. Each individual should conduct their own research and consult with professional financial advisors before making any investment decisions. The author or publisher of this content bears no responsibility for any actions taken based on the information provided or for any resultant financial or other losses.
MNQ!/NQ1! Day Trade Plan for 02/07/25MNQ!/NQ1! Day Trade Plan for 02/07/25
📈22102-22145
📉21706-21663
Like and share for more daily ES/NQ levels 🤓📈📉🎯💰
(💎: IF THERE IS NOT MUCH VOLATILITY; FOCUS ON ZONES VERSES INDIVIDUAL PRICE LEVELS)
*These levels are derived from comprehensive backtesting and research, demonstrating over 90% accuracy. This statistical foundation suggests that price movements are likely to exceed initial estimates.*

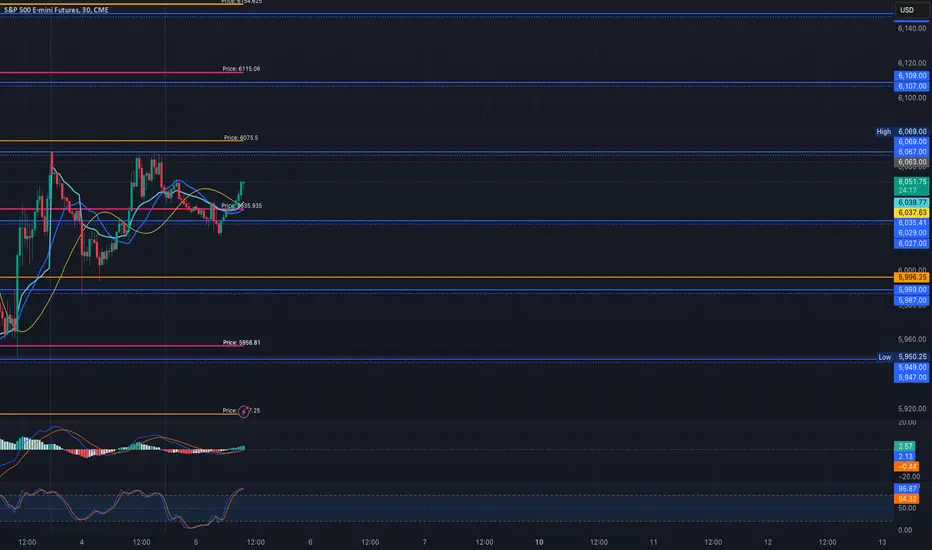
MES!/ES1! Day Trade Plan for 02/07/25MES!/ES1! Day Trade Plan for 02/07/25
📈6148-6154
📉6075-6068
Like and share for more daily ES/NQ levels 🤓📈📉🎯💰
(💎: IF THERE IS NOT MUCH VOLATILITY; FOCUS ON ZONES VERSES INDIVIDUAL PRICE LEVELS)
*These levels are derived from comprehensive backtesting and research, demonstrating over 90% accuracy. This statistical foundation suggests that price movements are likely to exceed initial estimates.*

MES!/ES1! Day Trade Plan for 02/06/25MES!/ES1! Day Trade Plan for 02/06/25
📈6132-6140
📉6060-6050
Like and share for more daily ES/NQ levels 🤓📈📉🎯💰
(💎: IF THERE IS NOT MUCH VOLATILITY; FOCUS ON ZONES VERSES INDIVIDUAL PRICE LEVELS)
*These levels are derived from comprehensive backtesting and research, demonstrating over 90% accuracy. This statistical foundation suggests that price movements are likely to exceed initial estimates.*

MNQ!/NQ1! Day Trade Plan for 02/06/25MNQ!/NQ1! Day Trade Plan for 02/06/25
📈21845-21940 ; 21795-21870
📉21656-21565 ; 21650-21575
Like and share for more daily ES/NQ levels 🤓📈📉🎯💰
(💎: IF THERE IS NOT MUCH VOLATILITY; FOCUS ON ZONES VERSES INDIVIDUAL PRICE LEVELS)
*These levels are derived from comprehensive backtesting and research, demonstrating over 90% accuracy. This statistical foundation suggests that price movements are likely to exceed initial estimates.*

MES!/ES1! Day Trade Plan for 02/05/25MES!/ES1! Day Trade Plan for 02/05/25
📈6067-6069 ; 6107-6109
📉6030-6027; 5990-5987
Like and share for more daily ES/NQ levels 🤓📈📉🎯💰
(💎: IF THERE IS NOT MUCH VOLATILITY; FOCUS ON ZONES VERSES INDIVIDUAL PRICE LEVELS)
*These levels are derived from comprehensive backtesting and research, demonstrating over 90% accuracy. This statistical foundation suggests that price movements are likely to exceed initial estimates.*
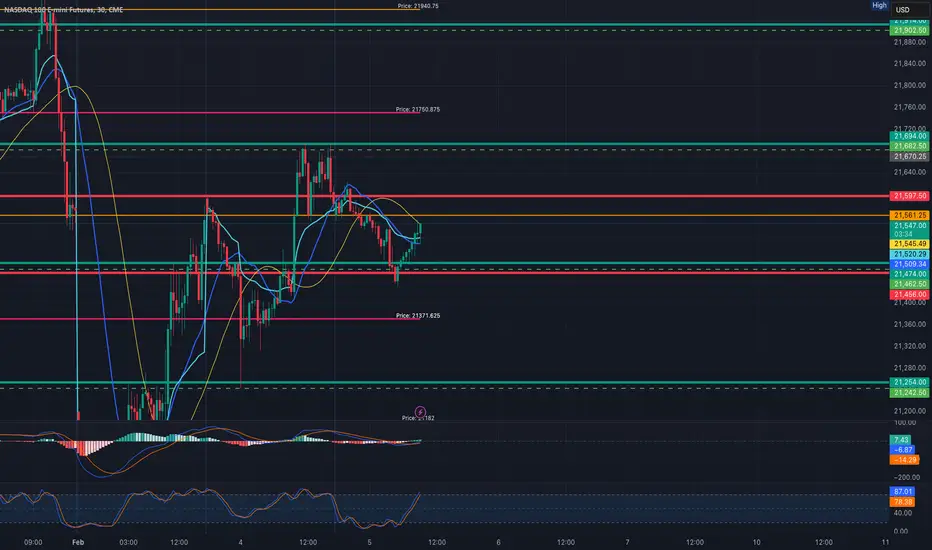
MNQ!/NQ1! Day Trade Plan for 02/05/25MNQ!/NQ1! Day Trade Plan for 02/05/25
📈21750-21809 ; 21682-21690, 21902-21914
📉21245-21370 ; 21475-21465, 21255-21245
Like and share for more daily ES/NQ levels 🤓📈📉🎯💰
(💎: IF THERE IS NOT MUCH VOLATILITY; FOCUS ON ZONES VERSES INDIVIDUAL PRICE LEVELS)
*These levels are derived from comprehensive backtesting and research, demonstrating over 90% accuracy. This statistical foundation suggests that price movements are likely to exceed initial estimates.*
MNQ!/NQ1! Day Trade Plan for 02/04/25MNQ!/NQ1! Day Trade Plan for 02/04/25
📈21621.75 ; 21579,75- 21603, 21799.75- 21823
📉21220.75 ; 21163- 21139.75, 20943- 20920
Like and share for more daily ES/NQ levels 🤓📈📉🎯💰
(💎: IF THERE IS NOT MUCH VOLATILITY; FOCUS ON ZONES VERSES INDIVIDUAL PRICE LEVELS)
*These levels are derived from comprehensive backtesting and research, demonstrating over 90% accuracy. This statistical foundation suggests that price movements are likely to exceed initial estimates.*

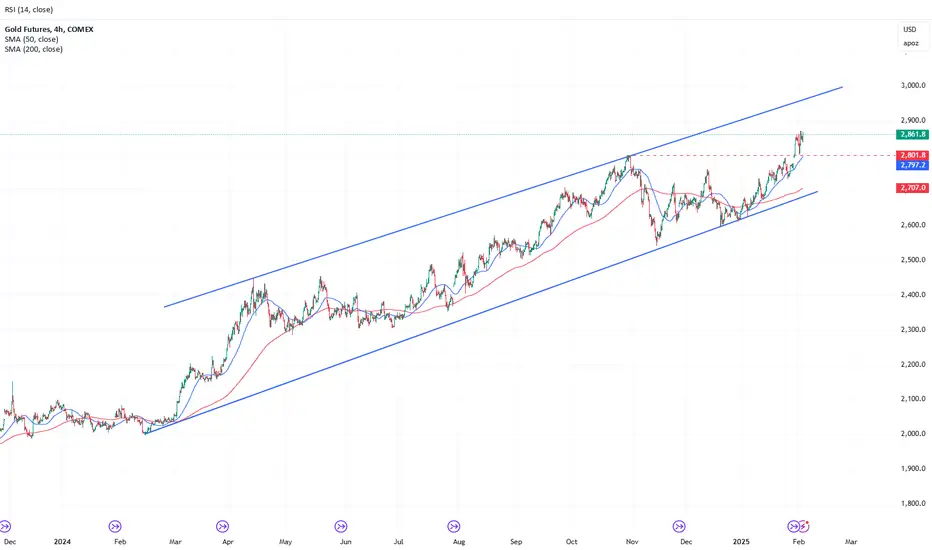
Gold continues higher within its well-established channelGold continues higher within its well-established channel, reaching a fresh record high at $2837. Interesting to note the spread between XAUUSD and GCJ5 continues to normalise with cash chasing higher towards the futures price. Win-win.
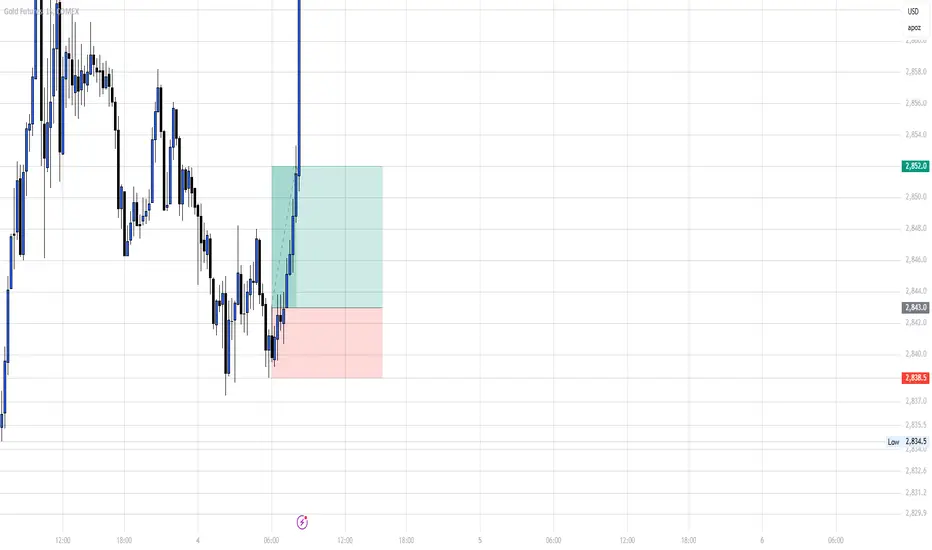
TARGET REACHED ON OUR TRADEEarlier I posted to buy on Gold, and the market now reached our target to continue going higher and higher.
Follow for more!
MNQ!/NQ1! Day Trade Plan for 02/03/25MNQ!/NQ1! Day Trade Plan for 02/03/25
📈 21306-21310, 21371, 21526-21561, 21746-21750
📉 21095-21086, 20992, 20875-20866, 20802
Like and share for more daily ES/NQ levels 🤓📈📉🎯💰
(💎: IF THERE IS NOT MUCH VOLATILITY; FOCUS ON ZONES VERSES INDIVIDUAL PRICE LEVELS)
*These levels are derived from comprehensive backtesting and research, demonstrating over 90% accuracy. This statistical foundation suggests that price movements are likely to exceed initial estimates.*

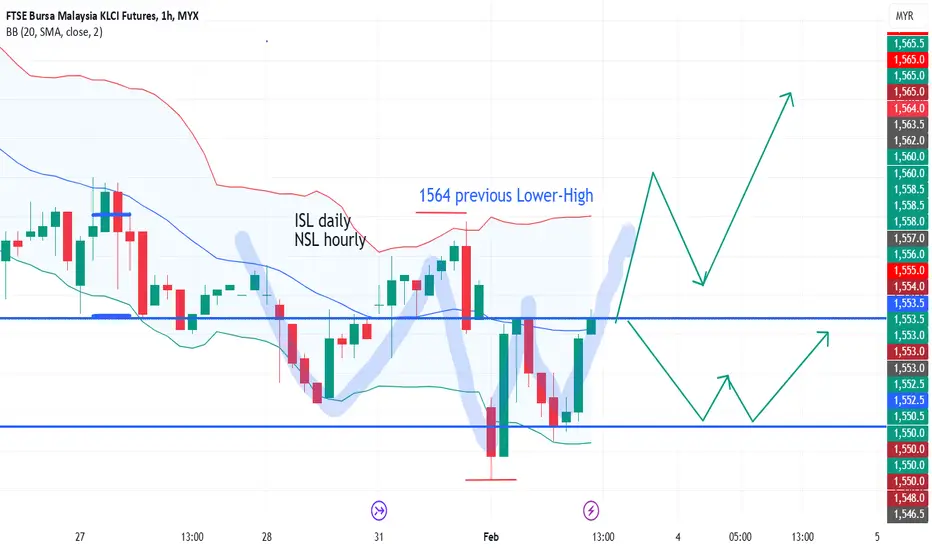
14) FKLI : possible reversal
Fkli-feb has shown a possible reversal, creating a higher-low tdy. price to watch out is at 1564, the previous Lower-High, before descending further into the previous support level...1540...that was the lowest point set (around that level) on 17th Jan 2025, forming double bottom in daily chart. IF this price 1564 is broken to the upside, THEN we have a confirmation shift of trend and uptrend has come back.
tug-of-war between bull and bear happens between 1540-1560 level...
IF price breaks below 1540 support level (lowest point 1536?), THEN bear continues...
PLS remember, I am not a guru and this is not a signal service provider. THIS is mere for fun.
#tradersupporttrader #FCPO #FKLI #futurestrader #cpop #malaysiatrader #bursa #BursaMalaysia
Disclaimer : "I am not a guru and I am working hard to make profit same as everyone else. This is not a recommendation of buy or sell, just a mere idea of trading and trading journal. Please consult your financial advisor for any thought of buying or selling. Trade at your own risk."
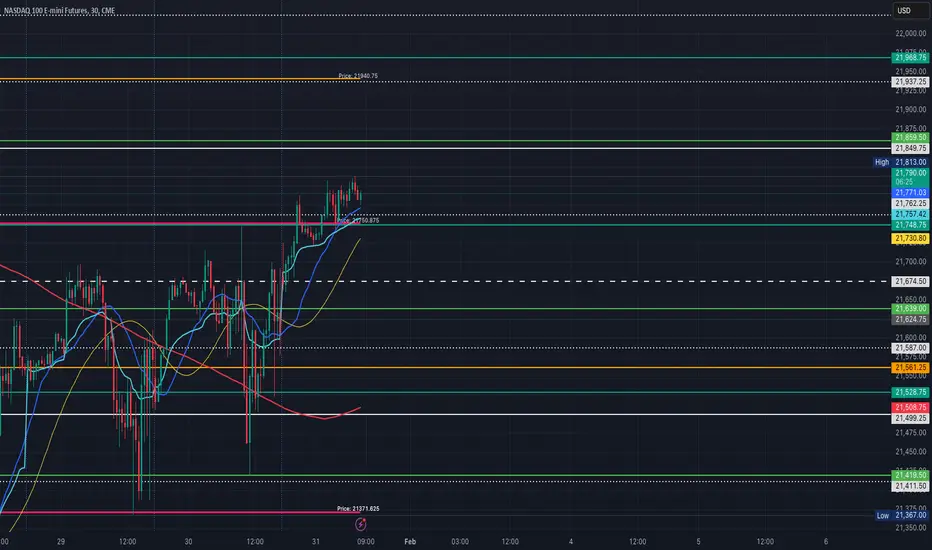
MNQ!/NQ1! Day Trade Plan for 01/31/25MNQ!/NQ1! Day Trade Plan for 01/31/25
📈 21849.75, 21937.25, 22024.75 (NEXT ZONES: 21859.5-21968.75)
📉 21674.50, 21587, 21499.25 (NEXT ZONES: 21748.75-21639)
Like and share for more daily ES/NQ levels 🤓📈📉🎯💰
(💎: IF THERE IS NOT MUCH VOLATILITY; FOCUS ON ZONES VERSES INDIVIDUAL PRICE LEVELS)
*These levels are derived from comprehensive backtesting and research, demonstrating over 90% accuracy. This statistical foundation suggests that price movements are likely to exceed initial estimates.*
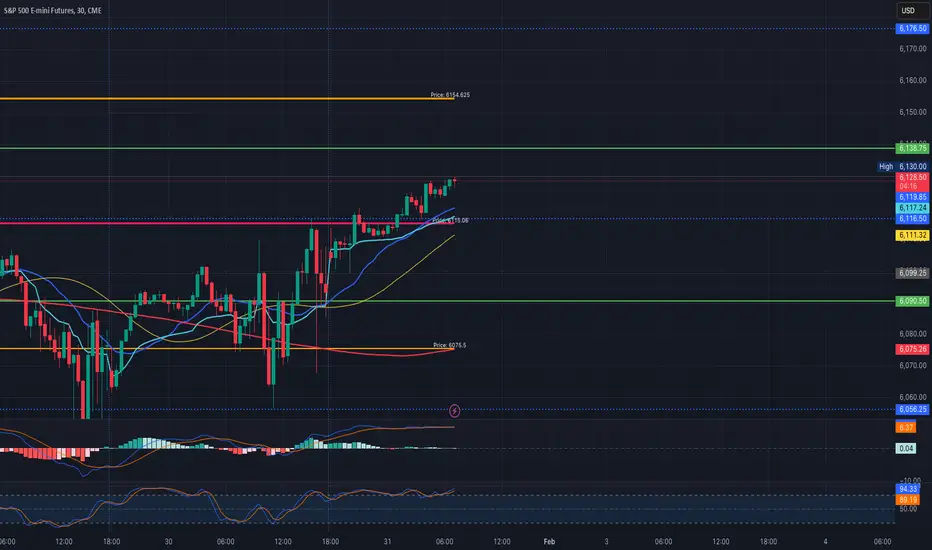
MES!/ES1! Day Trade Plan for 01/31/25MES!/ES1! Day Trade Plan for 01/31/25
📈 6138.80, 6154.60
📉 6115.25, 6090.50
Like and share for more daily ES/NQ levels 🤓📈📉🎯💰
(💎: IF THERE IS NOT MUCH VOLATILITY; FOCUS ON ZONES VERSES INDIVIDUAL PRICE LEVELS)
*These levels are derived from comprehensive backtesting and research, demonstrating over 90% accuracy. This statistical foundation suggests that price movements are likely to exceed initial estimates.*
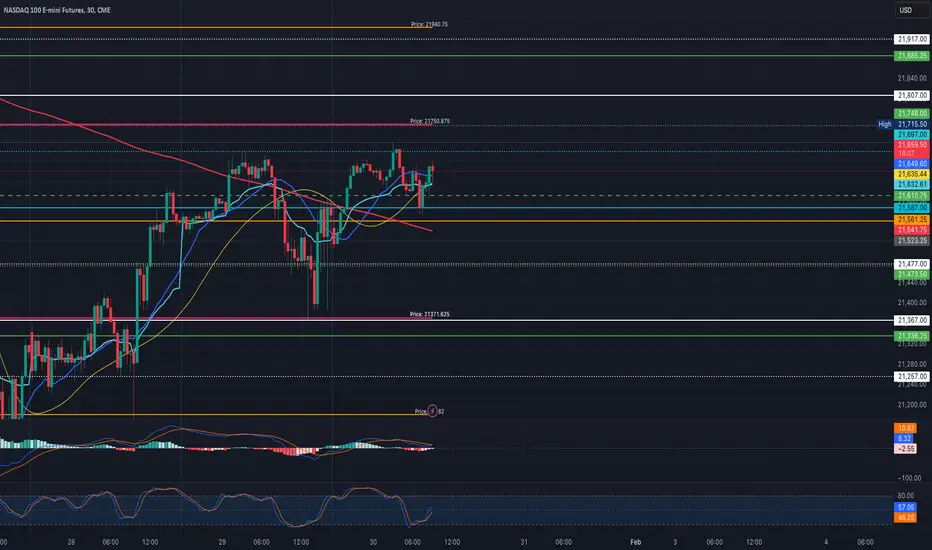
MNQ!/NQ1! Day Trade Plan for 01/30/25MNQ!/NQ1! Day Trade Plan for 01/30/25
📈 21748 & 21885.25 (NEXT ZONES: 21807-21917, 22027-22137)
📉 21473.50 & 21336.25 (NEXT ZONES: 21477-21367, 21257-21147)
Like and share for more daily ES/NQ levels 🤓📈📉🎯💰
(💎: IF THERE IS NOT MUCH VOLATILITY; FOCUS ON ZONES VERSES INDIVIDUAL PRICE LEVELS)
*These levels are derived from comprehensive backtesting and research, demonstrating over 90% accuracy. This statistical foundation suggests that price movements are likely to exceed initial estimates.*
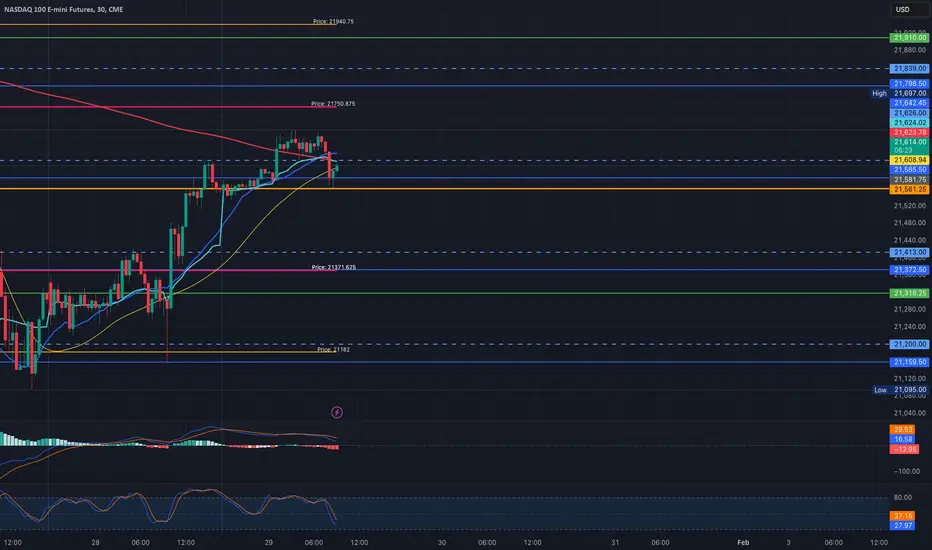
MNQ!/NQ1! Day Trade Plan for 01/29/25MNQ!/NQ1! Day Trade Plan for 01/29/25
📈 21910 (NEXT ZONES: 21840-21797, 22052-22011, 22265-22224)
📉 21320 (NEXT ZONES: 21413-21373, 21200-21160, 20987-20947)
Like and share for more daily ES/NQ levels 🤓📈📉🎯💰
(💎: IF THERE IS NOT MUCH VOLATILITY; FROM 930 OPEN, FIND THE HIGH OR LOW AND PROFIT OFF $200 DIFFERENCE FOR INCOME)
*These levels are derived from comprehensive backtesting and research, demonstrating over 90% accuracy. This statistical foundation suggests that price movements are likely to exceed initial estimates.*
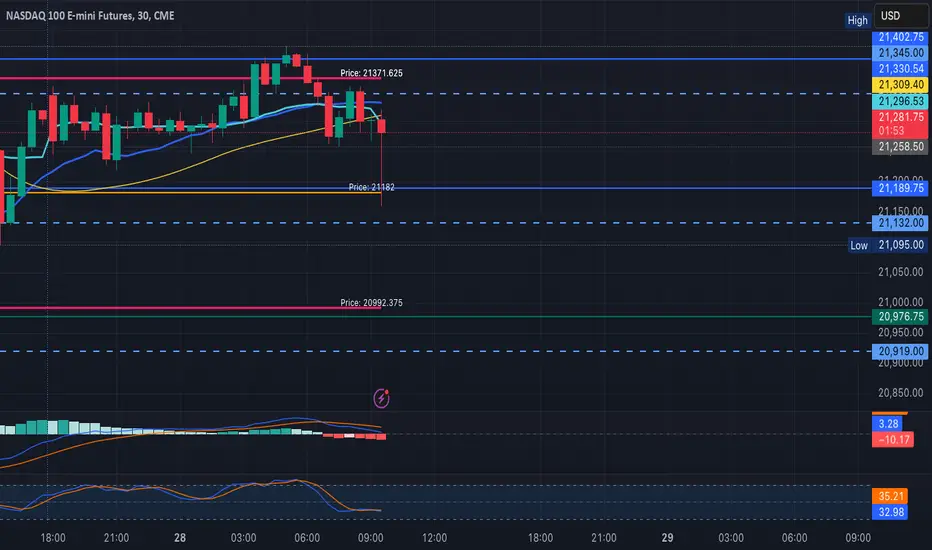
MNQ!/NQ1! Day Trade Plan for 01/28/25MNQ!/NQ1! Day Trade Plan for 01/28/25
📈 21558 (NEXT ZONES: 21615)
📉 21182 (NEXT ZONES: 21132, 20993-20920)
(💎 NOT MUCH VOLATILITY, HOWEVER FROM 930 OPEN, FIND THE HIGH OR LOW AND PROFIT OFF $200 DIFFERENCE FOR INCOME EVEN IN UNCERTAIN TIMES)
Like and share for more daily ES/NQ levels 🤓📈📉🎯💰
*These levels are derived from comprehensive backtesting and research, demonstrating over 90% accuracy. This statistical foundation suggests that price movements are likely to exceed initial estimates.*
MNQ!/NQ1! Day Trade Plan for 01/27/25MNQ!/NQ1! Day Trade 🎯 for 01/27/25
📈 21750 (NEXT LEVELS: 21865)
📉 21406 (NEXT LEVELS: 21372, 21227)
Like and share for more daily ES/NQ levels 🤓📈📉🎯💰
*These levels are derived from comprehensive backtesting and research, demonstrating over 90% accuracy. This statistical foundation suggests that price movements are likely to exceed initial estimates.*

NQ Futures -Key Levels after the sell off longs and shortsA must watch video that provides solid context to the current range using fibs + pivots .

Sell off across U.S. Equity into Monday U.S. openU.S. equity indicies failed to register new highs at the close of inauguration week on the heels of famed Trump 'tariff talk' and the initiation of mass immigration reform. Friday 1/24/2025 we saw the bulls slightly outnumbered by bearish interest before the 'full weight' of the move was felt coming towards the close of Sydney/open of London session into today Monday, January 27 of 2025. The dollar is weak, the price of metals is subdued as of writing and bonds have sky-rocketed across the board in a clear display of a flight to safety (guaranteed interest during a time of uncertainty in RISK-assets). Due to a clear risk off sentiment reflected in the flight to safety in the bond market, I'm calling U.S. equity indicies to be in a sell-off for monday 1/27/2025 across the board. We have MAGS and FAANG earnings reporting this week in addition to an FOMC meeting this coming Wednesday - While the price action might become a blood-bath for a while, it may or may not be part of an over-due correction of a broader sequence.

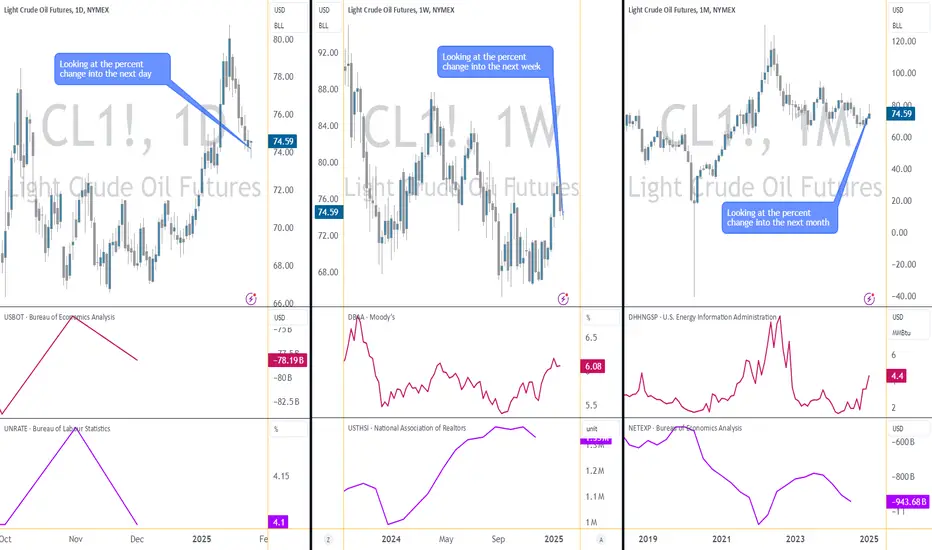
Behind the Curtain: Economic Forces Fueling Crude Oil Futures1. Introduction
Crude Oil Futures (CL), traded on the CME, are a cornerstone of global energy markets. Representing a vital benchmark for the energy sector, these futures reflect shifts in supply, demand, and macroeconomic sentiment. As both a speculative and hedging instrument, CL Futures are closely tied to economic forces shaping the global economy.
In this article, we leverage machine learning insights from a Random Forest Regressor to uncover the top economic indicators influencing Crude Oil Futures across daily, weekly, and monthly timeframes. By identifying these drivers, traders can gain a data-driven perspective to navigate the dynamic crude oil market effectively.
2. Understanding Crude Oil Futures
o Contract Specifications:
Standard Contract: Represents 1,000 barrels of crude oil.
Tick Size: Each tick is 0.01 per barrel, equating to $10 per tick per contract.
Trading Hours: Nearly 24 hours, ensuring global access and liquidity.
o Micro Crude Oil Contracts (MCL):
Contract Size: Represents 100 barrels of crude oil, 1/10th the size of the standard CL contract.
Tick Size: Each tick is 0.01 per barrel, equating to $1 per tick per contract.
Purpose: Offers smaller-scale traders’ access to the crude oil market with lower capital requirements, making it ideal for those looking to hedge or test strategies.
o Margins:
Standard CL Contract Margin: Approximately $6,000 per contract (subject to market volatility).
Micro MCL Contract Margin: Approximately $600 per contract.
The combination of high liquidity, leverage, and the flexibility offered by Micro Crude Oil contracts makes CL Futures a versatile choice for a broad range of participants, from institutional investors to retail traders exploring smaller-scale strategies.
3. Daily Timeframe: Key Economic Indicators
Machine learning insights reveal that the following daily indicators play a crucial role in shaping Crude Oil Futures' movements:
U.S. Trade Balance: Measures the difference between exports and imports. A narrowing trade deficit signals improved economic health and potential upward pressure on oil demand, while a widening deficit may indicate weakened economic sentiment, weighing on crude prices.
Unemployment Rate: Reflects labor market conditions and overall economic health. A declining unemployment rate often correlates with increased energy consumption due to stronger economic activity, boosting crude oil prices.
Building Permits: Tracks new residential construction permits issued. Rising permits reflect economic confidence and can signal increased energy demand for construction activity, providing upward momentum for crude prices.
4. Weekly Timeframe: Key Economic Indicators
Weekly indicators provide medium-term insights into crude oil market dynamics. The top drivers include:
Corporate Bond Spread (BAA - 10Y): Reflects the difference between corporate bond yields and Treasury yields. Widening spreads signal economic uncertainty, potentially reducing crude oil demand. Narrowing spreads suggest stability, supporting higher crude prices.
U.S. Trade Balance (again): At the weekly level, trade balance trends highlight the interplay between global trade and crude oil demand, influencing market sentiment over several days.
Housing Price Index: Indicates trends in real estate values, reflecting consumer confidence and economic stability. Rising housing prices often signal strong economic conditions, indirectly bolstering crude oil demand.
5. Monthly Timeframe: Key Economic Indicators
Monthly indicators provide a long-term perspective on Crude Oil Futures trends, highlighting macroeconomic forces at play. The top monthly drivers are:
Natural Gas Prices: As a competing energy source, fluctuations in natural gas prices can impact crude oil demand. Rising natural gas prices often lead to increased crude consumption, while declining prices may pressure oil demand downward.
U.S. Trade Balance (again): Over a monthly timeframe, the trade balance reflects sustained shifts in international trade dynamics. Persistent trade deficits may signal weaker global economic activity, affecting crude oil prices negatively, whereas trade surpluses may support demand.
Net Exports: A critical measure of a country’s export-import balance, net exports reveal global demand for domestic products, including crude oil. Surpluses suggest robust international demand, often leading to upward pressure on oil prices, while deficits indicate weaker sentiment.
6. Applications for Different Trading Styles
Economic indicators provide actionable insights tailored to specific trading styles:
Day Traders: Focus on daily indicators such as U.S. Trade Balance, Unemployment Rate, and Building Permits to anticipate intraday volatility. For example, an unexpected improvement in building permits might signal stronger economic activity, potentially boosting crude oil prices intraday.
Swing Traders: Weekly indicators like Corporate Bond Spread (BAA - 10Y) and Housing Price Index offer insights into intermediate trends. For instance, narrowing bond spreads often reflect economic stability, aligning with medium-term bullish positions in Crude Oil Futures.
Position Traders: Monthly indicators such as Natural Gas Prices and Net Exports are essential for capturing long-term macroeconomic shifts. Sustained increases in natural gas prices, for example, might support prolonged bullish sentiment in crude oil markets.
7. Risk Management Strategies
Risk management is crucial when trading Crude Oil Futures due to the inherent volatility of energy markets. Key strategies include:
Hedging Volatility: Utilize correlated assets, such as natural gas or refined product futures, to hedge against price swings.
Monitoring Leverage: Adjust position sizes based on volatility and margin requirements to minimize risk exposure during periods of heightened uncertainty.
Timeframe Diversification: Incorporate insights from daily, weekly, and monthly indicators to create a balanced trading approach. For example, while daily indicators may signal short-term volatility, monthly metrics provide stability for longer-term trades.
8. Conclusion
Crude Oil Futures are deeply influenced by economic indicators across varying timeframes. From the U.S. Trade Balance and Building Permits driving daily fluctuations to Natural Gas Prices and Net Exports shaping long-term trends, understanding these relationships is critical for navigating the energy market.
By leveraging data-driven insights from machine learning models, traders can align their strategies with market dynamics and improve decision-making. Whether you're a day trader, swing trader, or position trader, these economic forces offer a framework for more informed and strategic trading.
Stay tuned for the next installment in the "Behind the Curtain" series, where we unveil the economic forces shaping another critical futures market.
When charting futures, the data provided could be delayed. Traders working with the ticker symbols discussed in this idea may prefer to use CME Group real-time data plan on TradingView: tradingview.sweetlogin.com - This consideration is particularly important for shorter-term traders, whereas it may be less critical for those focused on longer-term trading strategies.
General Disclaimer:
The trade ideas presented herein are solely for illustrative purposes forming a part of a case study intended to demonstrate key principles in risk management within the context of the specific market scenarios discussed. These ideas are not to be interpreted as investment recommendations or financial advice. They do not endorse or promote any specific trading strategies, financial products, or services. The information provided is based on data believed to be reliable; however, its accuracy or completeness cannot be guaranteed. Trading in financial markets involves risks, including the potential loss of principal. Each individual should conduct their own research and consult with professional financial advisors before making any investment decisions. The author or publisher of this content bears no responsibility for any actions taken based on the information provided or for any resultant financial or other losses.