Options Blueprint Series: Swap Strategies for High VolatilityIntroduction
CME Group Gold Futures have always been a cornerstone in the commodities market, offering investors and traders a way to hedge against economic uncertainties and inflation. With the current market environment exhibiting heightened volatility, traders are looking for strategies to capitalize on these fluctuations. One such strategy is the Straddle Swap, which is particularly effective in high volatility scenarios.
By utilizing the Straddle Swap strategy on Gold Futures, traders can potentially benefit from price swings driven by news events, economic data releases, and other market-moving occurrences.
Strategy Explanation
The Straddle Swap strategy is designed to capitalize on high volatility by leveraging options with different expirations. Here’s a detailed breakdown of how this strategy works:
Components of the Straddle Swap:
1. Buy one call option (longer expiration)
This long call option benefits from upward price movements in Gold Futures.
2. Sell one call option (shorter expiration)
This short call option generates premium income, which offsets the cost of the long call option. As it has a shorter expiration, it benefits from faster time decay.
3. Buy one put option (longer expiration)
This long put option benefits from downward price movements in Gold Futures.
4. Sell one put option (shorter expiration)
This short put option generates premium income, which offsets the cost of the long put option. It also benefits from faster time decay due to its shorter expiration.
Rationale for Different Expirations:
Longer Expirations: The options with more days to expiration provide a longer timeframe to capture significant price movements, whether upward or downward.
Shorter Expirations: The options with less days to expiration decay more quickly, providing premium income that reduces the overall cost of the strategy. This helps mitigate the effects of time decay on the longer-dated options.
Market Analysis Using TradingView Charts:
To effectively implement the Straddle Swap strategy, it’s crucial to analyze the current market conditions of Gold Futures using TradingView charts. This analysis will help identify optimal entry and exit points based on volatility and price trends.
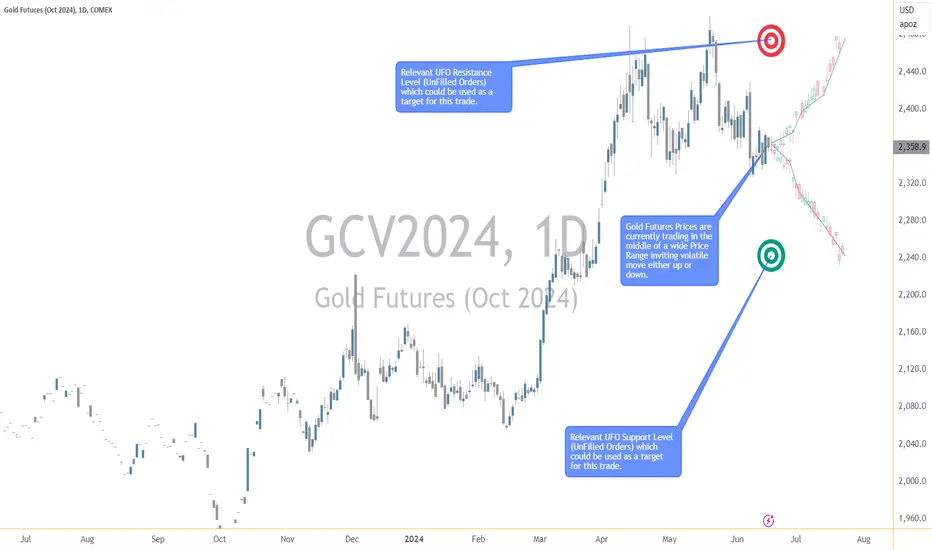
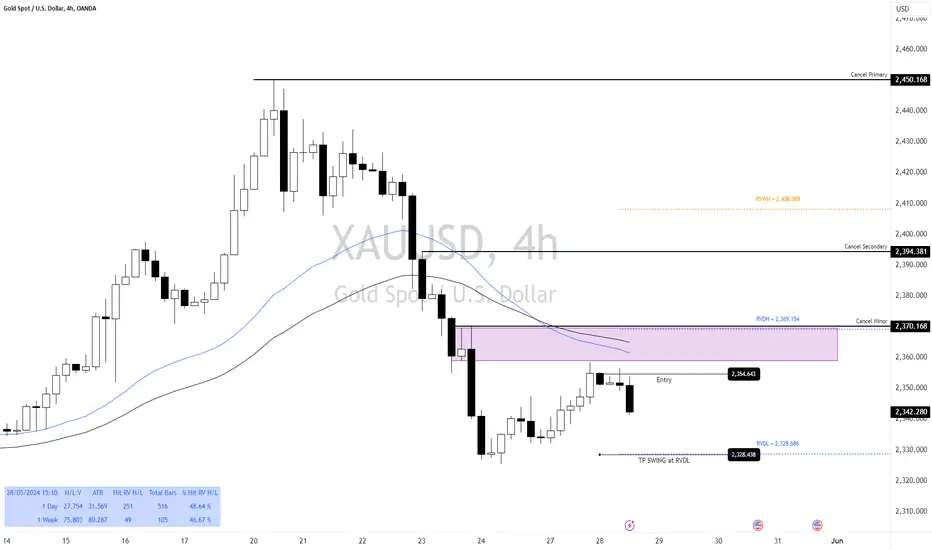
The current price action of Gold Futures along with key volatility indicators. Recent data shows that the 1-month, 2-month, and 3-month Historical Volatilities have all been on the rise, confirming a high volatility scenario.
Application to Gold Futures
Let’s apply the Straddle Swap strategy to Gold Futures given the current market conditions.
Identifying Optimal Entry Points:
Call Options: Buy one call option with a 100-day expiration (Sep-25 2024) at a strike price of 2370 @ 64.5. Sell one call option with a 71-day expiration (Aug-27 2024) at the same strike price of 2370 @ 53.4.
Put Options: Buy one put option with a 100-day expiration (Sep-25 2024) at a strike price of 2350 @ 63.4. Sell one put option with a 71-day expiration (Aug-27 2024) at the same strike price of $2350 @ 52.5.
Target Prices:
Based on the relevant UFO support and resistance levels, set target prices for potential profit scenarios:
Upper side, target price: 2455.
For put options, target price: 2260.
Potential Profit and Loss Scenarios:
Scenario 1: Significant Upward Movement
If Gold Futures rise sharply above 2370 within 100 days, the long call option will generate a potentially substantial profit. The short call option will expire in 71 days, limiting potential losses.
Scenario 2: Significant Downward Movement
If Gold Futures fall sharply below 2350 within 100 days, the long put option will generate a potentially substantial profit. The short put option will expire in 71 days, limiting potential losses.
Scenario 3: Minimal Movement
If Gold Futures remain relatively stable, the premiums collected from the short options (71-day expiration) will offset some of the cost of the long options (100-day expiration), minimizing overall losses. Further options could be sold against the long 2350 call and long 2350 put once the shorter expiration options have expired.
Specific Action Plan:
1. Initiate the Straddle Swap Strategy:
Enter the positions as outlined above following your trading plan, ensuring to buy and sell the options at the desired strike prices and expirations.
2. Monitor Market Conditions:
Continuously monitor Gold Futures prices and volatility indicators.
Adjust or close the strategy if necessary based on significant market changes.
3. Manage Positions:
Use stop-loss orders to limit potential losses.
If the market moves favorably, consider exiting the positions at the target prices to lock in profits.
4. Reevaluate Periodically:
Periodically reevaluate the positions as the options approach their expiration dates.
Make any necessary adjustments to the strategy based on updated market conditions and volatility.
By following this type of trade plan, traders can effectively implement the Straddle Swap strategy, taking advantage of high volatility in Gold Futures while managing risk through careful monitoring and the use of stop-loss orders.
Risk Management
Effective risk management is crucial for success in options trading, particularly when employing strategies like the Straddle Swap. Here, we will discuss the importance of risk management, key techniques, and best practices to ensure that traders can mitigate potential losses and protect their capital.
Importance of Risk Management:
Minimizing Losses: Trading inherently involves risk. Effective risk management helps minimize potential losses, ensuring that a single adverse move does not significantly impact the trader’s overall portfolio.
Preserving Capital: By managing risk, traders can preserve their capital, allowing them to stay in the market longer and capitalize on future opportunities.
Enhancing Profitability: Proper risk management allows traders to optimize their strategies, potentially increasing profitability by avoiding unnecessary losses.
Key Risk Management Techniques:
1. Stop-Loss Orders:
Implementing stop-loss orders helps limit potential losses by automatically closing a position if the market moves against it.
For the Straddle Swap strategy, set stop-loss orders for the long call and put options to exit positions if prices reach predetermined levels where losses would exceed the desired trade risk set by the trader.
2. Hedging:
Use hedging techniques to protect positions from adverse market movements. This can involve purchasing protective options or futures contracts.
Hedging provides an additional layer of security, ensuring that losses in one position are offset by gains in another.
3. Avoiding Undefined Risk Exposure:
Ensure that all positions have defined risk parameters. Avoid strategies that can result in unlimited losses.
The Straddle Swap strategy inherently has limited risk due to the offsetting nature of the long and short options.
4. Precision in Entries and Exits:
Timing is crucial in options trading. Ensure precise entry and exit points to maximize potential gains and minimize losses.
Use technical analysis key price levels such as UFO support and resistance prices, and volatility indicators to identify optimal entry and exit points.
5. Regular Monitoring and Adjustment:
Continuously monitor market conditions and the performance of open positions.
Be prepared to adjust the strategy based on changing market dynamics, such as shifts in volatility or unexpected news events.
Additional Risk Management Practices:
Diversification: Spread risk across multiple positions and asset classes to reduce the impact of any single trade. Other liquid options markets could be WTI Crude Oil Futures; Agricultural products such as Wheat Futures, Corn Futures, or Soybean Futures; Index Futures such as the E-mini S&P 500 Futures; and even Bond and Treasury Futures such as the 10-Year Note or the 30-Year Bond Futures.
Position Sizing: Carefully determine the size of each position based on the trader’s overall portfolio and risk tolerance.
Education and Research: Stay informed about market conditions, economic indicators, and trading strategies to make well-informed decisions.
By incorporating these risk management techniques, traders can effectively navigate the complexities of options trading and protect their investments. Ensuring more precision with entries and exits, using stop-loss orders, and implementing hedging strategies are essential practices that contribute to long-term trading success.
When charting futures, the data provided could be delayed. Traders working with the ticker symbols discussed in this idea may prefer to use CME Group real-time data plan on TradingView: tradingview.sweetlogin.com This consideration is particularly important for shorter-term traders, whereas it may be less critical for those focused on longer-term trading strategies.
General Disclaimer:
The trade ideas presented herein are solely for illustrative purposes forming a part of a case study intended to demonstrate key principles in risk management within the context of the specific market scenarios discussed. These ideas are not to be interpreted as investment recommendations or financial advice. They do not endorse or promote any specific trading strategies, financial products, or services. The information provided is based on data believed to be reliable; however, its accuracy or completeness cannot be guaranteed. Trading in financial markets involves risks, including the potential loss of principal. Each individual should conduct their own research and consult with professional financial advisors before making any investment decisions. The author or publisher of this content bears no responsibility for any actions taken based on the information provided or for any resultant financial or other losses.
Futurestrading
INJ we've probably seen the bottomWe are currently looking at futures trade with members on certain coins, as well as dca zones. INJ has covered the weekly and monthly levels behind it at the price of $24. We waited for the news to see how buyers would react. Now that we have confirmation, we get the courage to go long on this coin.
In this case, INJ must hold $28 until the 200 DMA is at $31. If in this case we see a consolidation and not a big sale, my advice is to go long this coin at the bottom of that consolidation.
For example, catch up to $27 and put a stop loss below just in case

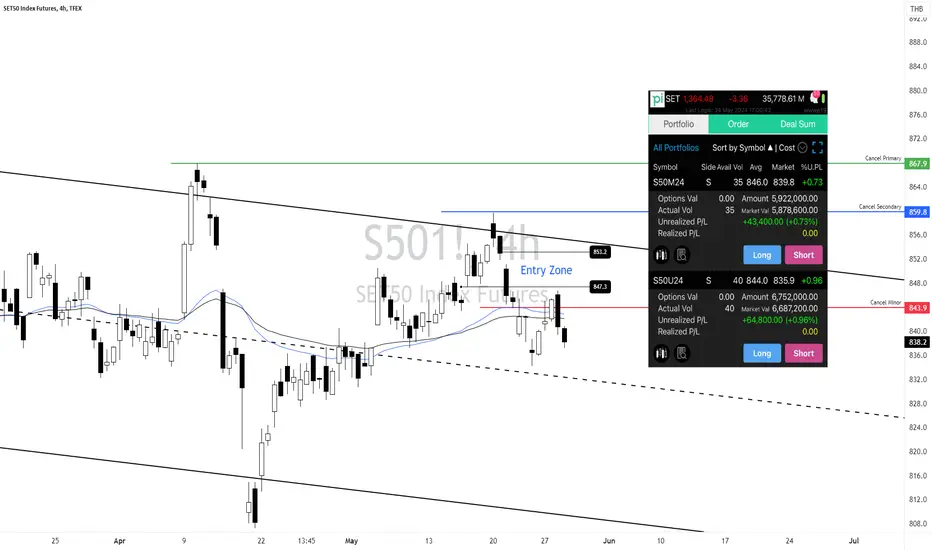
TFEX S50 FuturesTFEX S50 Futures
All Trend is Down in Primary, Secondary and Minor
Strategy 1: Wait for the price to rise to the resistance level (Supply Zone, POC of Volume and Regression Trend) then open Short Position.
Strategy 2: Divide Open Short Position and cut the losses short with Minor Trend
Target at Range Volatile 1 Month and 3 Month Low around 800 -790 point as last opinion.
#Heromoto 4th time tested 4950, above 4955 fatega kya?Heromoto since Feb'24 4th time has tested the fib resistance of 4954.A day close above 4954 can take this stock towards 1) 510 2)5177 3)5329 4)5473, below 4632 will be exit for me. Since my indicator is also not giving any negative signs, I have high hopes from this setup. Only thing is weakness in overall market can affect it. Lets see
XAU/USD Swing TrendXAU/USD Swing Trend
- Primary : Down Trend
- Secondary : Down Trend
- Minor : Down Trend
I think now It may be at the end of leg C of 4. and Finished 13 day of Down Trend Already.
However, Trade with the trend, when my Minor Trend looked up, I then waited for the price to adjust down to the EMA line and to the +1 SD line as well.
Therefore, the Buy Position has been opened. The target is to make a profit in the area of 2400, which is the Supply Zone. And place SL when the price breaks the POC of Volume below.
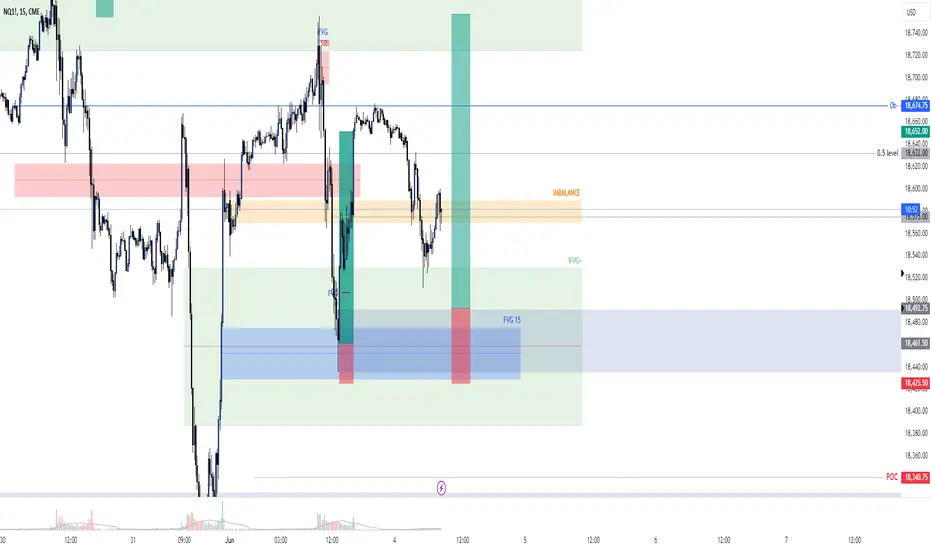
NQ to reach out for Discount before pushing upWe expect NQ to reach for a discount area around 18492 before pushing higher towards yesterday's high at 18750.
News at 10am might play aN important role in this push.
Otherwise we expect NQ to clear yesterday's high without sweeping Liquidity @ 18512
FAKE BLACK SWAN EVENT IMOToday is election day in India. Its a major event. We see huge black candle. This is all a manipulation event to create panic in th emarket.

Options Blueprint Series: Secure Interest Rates with Box SpreadsIntroduction
The E-mini S&P 500 Futures is a popular and widely traded derivative product. These futures are used by traders and investors to hedge their portfolios, gain market exposure, and manage risk.
The Options Box Strategy is an advanced options trading technique that involves creating a synthetic long position and a synthetic short position simultaneously. This strategy is designed to lock in interest rates and profit from price discrepancies, essentially securing a risk-free return through arbitrage. By using Box Spreads, traders can secure interest rates and achieve a potential arbitrage opportunity in a controlled and predictable manner.
An interesting application of the Box Spread strategy is using unutilized capital in a trading account. Traders can earn a risk-free return on idle cash by deploying it in Box Spreads. This approach maximizes the utility of available capital, providing an additional revenue stream without increasing market risk exposure, thus enhancing overall portfolio performance.
E-mini S&P 500 Futures Contract Specifications:
Contract Size: $50 times the S&P 500 Index
Minimum Tick Size: 0.25 index points, equal to $12.50 per contract
Trading Hours: Nearly 24 hours a day, five days a week
Margin Requirement: $11,800 at the time of publishing this article
Micro E-minis: 10 times smaller than the E-minis
Understanding Box Spreads
A Box Spread is a sophisticated options strategy that involves simultaneously entering a long call and short put at one strike price and a long put and short call at another strike price.
Components of a Box Spread:
Long Call: Buying a call option at a specific strike price.
Short Put: Selling a put option at the same strike price as the long call.
Long Put: Buying a put option at a different strike price.
Short Call: Selling a call option at the same strike price as the long put.
How Box Spreads Secure Interest Rates: Box Spreads are designed to exploit mispricings between the synthetic long and short positions. By locking in these positions, traders can secure interest rates as the net result of the Box Spread should theoretically yield a risk-free return. This strategy is particularly useful in stable market conditions where interest rate fluctuations can impact the profitability of other trading strategies.
Advantages of Using Box Spreads:
Arbitrage Opportunities: Box Spreads allow traders to capitalize on discrepancies in the pricing of options, securing a risk-free profit.
Predictable Returns: The strategy locks in a fixed rate of return, providing certainty and stability.
Risk Management: By simultaneously holding synthetic long and short positions, the risk is minimized, making it an effective strategy for conservative traders.
Applying Box Spreads on E-mini S&P 500 Futures
To apply the Box Spread strategy on E-mini S&P 500 Futures, follow the following step-by-step approach.
Step-by-Step:
1. Identify Strike Prices:
Choose two strike prices for the options. For instance, select a lower strike price (LK) and a higher strike price (HK).
2. Enter Long Call and Short Put:
Buy a call option at the lower strike price (K1).
Sell a put option at the same lower strike price (K1).
3. Enter Long Put and Short Call:
Buy a put option at the higher strike price (K2).
Sell a call option at the same higher strike price (K2).
Potential Outcomes and Rate Security: The Box Spread locks in a risk-free return by exploiting price discrepancies. The profit is determined by the difference between the strike prices minus the net premium paid. In stable market conditions, this strategy provides a predictable and secure return, effectively locking in interest rates.
Advantages of Applying Box Spreads:
Risk-Free Arbitrage: The primary benefit is securing a risk-free profit through arbitrage.
Predictable Returns: Provides a fixed return, beneficial for conservative traders.
Minimal Risk: By holding both synthetic long and short positions, market risk is mitigated.
Considerations:
Ensure precise execution to avoid slippage and maximize the arbitrage opportunity.
Account for transaction costs, as they can impact the overall profitability.
Monitor market conditions to ensure the strategy remains effective.
Example Trade Setup:
Let's consider a practical example of setting up a Box Spread on the E-mini S&P 500 Futures while its current trading price is 5,531. We'll use the following strike prices:
Lower Strike Price (K1): 5450
Higher Strike Price (K2): 5650
Transactions:
Sell Call at 5650: Premium = 240.01
Buy Put at 5650: Premium = 352.85
Sell Put at 5450: Premium = 270.59
Buy Call at 5450: Premium = 347.39
Note: We are using the CME Group Options Calculator in order to generate fair value prices and Greeks for any options on futures contracts.
Net Premium Calculation:
Net premium paid = 347.39 - 240.01 + 352.85 - 270.59 = 189.64
Potential Profit Calculation:
Profit = (Higher Strike Price - Lower Strike Price) - Net Premium Paid
Profit = 5650 – 5450 – 189.64 = 10.36 points = $518 ($50 per point)
Rate Of Return (ROR) Calculation:
Margin Requirement = (Higher Strike Price - Lower Strike Price) × Contract Multiplier = 200 x 50 = $10,000
ROR = 518 / 10000 = 5.18%
Annualized ROR = 518 / 10000 x 365.25 / 383 = 4.94% (based on the screenshots, expiration will take place in 383.03 days while a year is made of 365.25 days)
Interesting Application: Utilizing Box Spreads with Unutilized Capital
An intriguing application of the Box Spread strategy is the use of unutilized capital in a trading account. Traders often have idle cash in their accounts that isn't actively engaged in trading. By deploying this capital in Box Spreads, traders can earn a risk-free return on otherwise dormant funds. This approach not only maximizes the utility of available capital but also provides an additional revenue stream without increasing market risk exposure. Utilizing Box Spreads in this manner can enhance overall portfolio performance, making efficient use of all available resources.
Importance of Risk Management
Risk management is a critical aspect of any trading strategy, including the implementation of Box Spreads on E-mini S&P 500 Futures. Effective risk management ensures that traders can mitigate potential losses and protect their capital, leading to more consistent and sustainable trading performance.
Conclusion
Implementing the Options Box Strategy on E-mini S&P 500 Futures may allow traders to secure interest rates and potentially achieve risk-free arbitrage opportunities. By understanding the mechanics of Box Spreads and applying them effectively, traders can capitalize on price discrepancies in the options market to lock in predictable returns.
Key points to remember include:
E-mini S&P 500 Futures offer accessible and efficient trading opportunities for both hedging and speculative purposes.
Box Spreads combine synthetic long and short positions, providing a powerful tool for securing interest rates through arbitrage.
By following the outlined steps and leveraging classical technical indicators, traders can enhance their ability to set up and analyze Box Spreads, making the most of this advanced options strategy.
Utilizing Box Spreads on E-mini S&P 500 Futures not only can secure interest rates but can also provide a structured and disciplined approach to trading, leading to more consistent and sustainable trading performance.
When charting futures, the data provided could be delayed. Traders working with the ticker symbols discussed in this idea may prefer to use CME Group real-time data plan on TradingView: tradingview.sweetlogin.com This consideration is particularly important for shorter-term traders, whereas it may be less critical for those focused on longer-term trading strategies.
General Disclaimer:
The trade ideas presented herein are solely for illustrative purposes forming a part of a case study intended to demonstrate key principles in risk management within the context of the specific market scenarios discussed. These ideas are not to be interpreted as investment recommendations or financial advice. They do not endorse or promote any specific trading strategies, financial products, or services. The information provided is based on data believed to be reliable; however, its accuracy or completeness cannot be guaranteed. Trading in financial markets involves risks, including the potential loss of principal. Each individual should conduct their own research and consult with professional financial advisors before making any investment decisions. The author or publisher of this content bears no responsibility for any actions taken based on the information provided or for any resultant financial or other losses.

Like clockworkWell maybe not exactly like clock work but you get the picture. We have predicted the lows and current area of price. I will look for a deeper dig into the OTE and monthly order block before taking price higher.

As predictedPrice has delivered exactly as predicted weeks ago. Look for buys at the fvg or ideally the OTE.

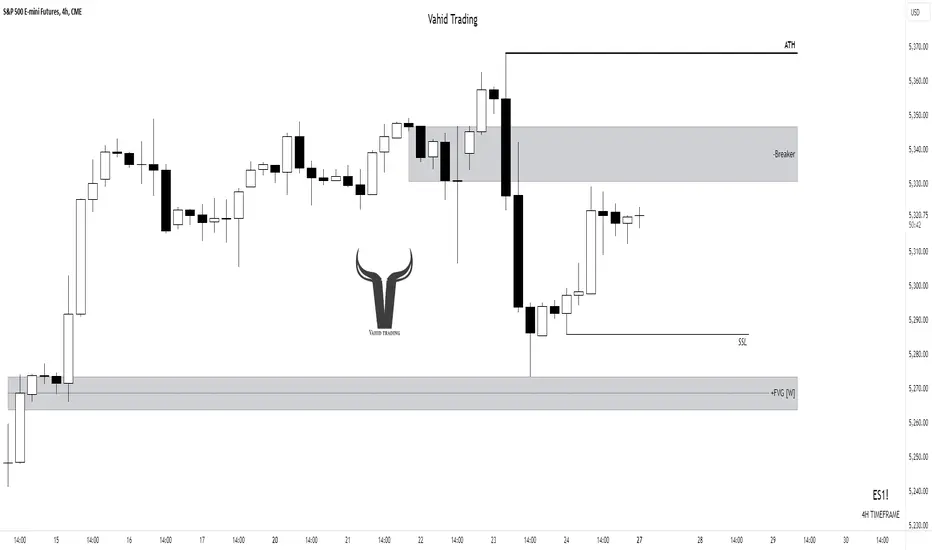
S&P 500 (US500):🔴Bearish or bullish...?!🔴By examining the weekly and 4-hour charts, we can determine the price was heavily pushed down after creating the all-time high.
I am not bearish for the long-term on the S&P500, but for now, I think the price can have a bearish reaction to the bearish breaker block and move down at least till the previous week's low, then we should study the price to find out the next move.
💡Wait for the update!
🗓️27/05/2024
🔎 DYOR
💌It is my honor to share your comments with me💌
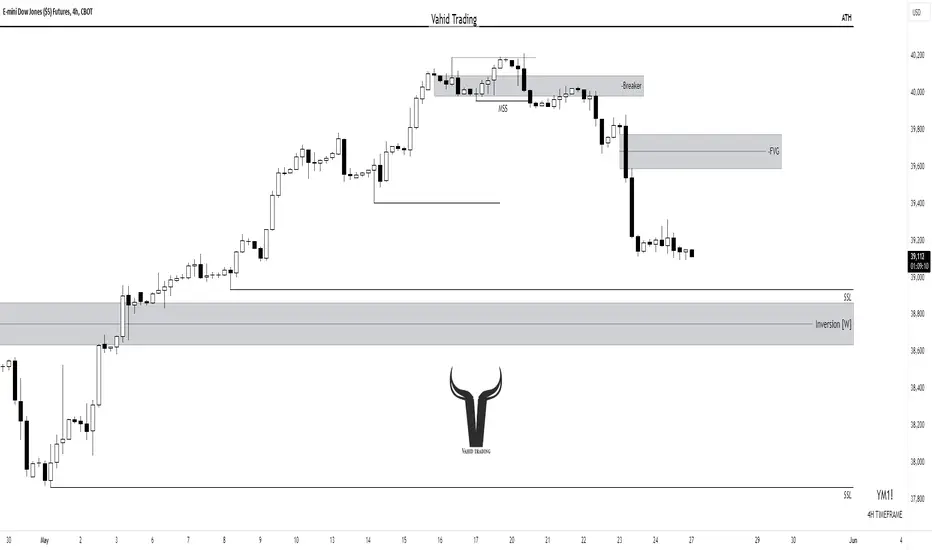
Dow Jones (US30):🔴Is it bearish..?!🔴Hello trader
By examining Dow Jones on the weekly and 4-hour chart we can figure out the chart is bearish and there is sell-side liquidity that can be defined as targets for smart money.
In this chart, the price failed to create an all-time high and dropped, the price made the bearish breaker and respected it and shifted the market structure.
Now we can see the bearish order block with bearish FVG that makes an important resistance, If the price reaches this zone we can look for a sell position in a lower time frame.
💡Wait for the update!
🗓️27/05/2024
🔎 DYOR
💌It is my honor to share your comments with me💌
TFEX S50 : Swing TrendTFEX S50 : Swing Trend
Case Study : Entry short when the price moves up to the resistance level and makes a Reversal Pattern.
When the Minor Trend returns to Down Trend Bias, aligned with the Primary Trend, it is the entry point for a Short Position. So can take profit at the support Poc of Regression Trend Line.
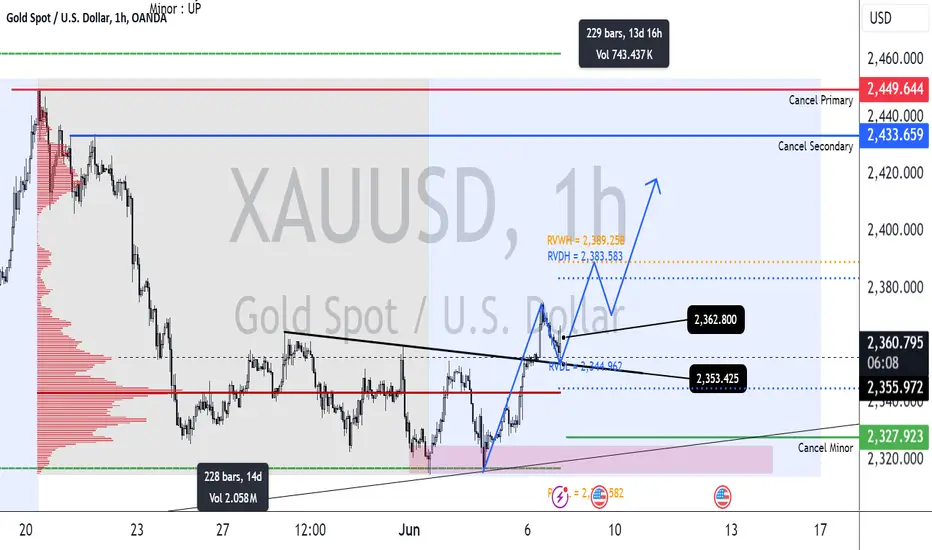
Swing Trend XAUUSDSwing Trend XAUUSD
Primary : Down Trend
Secondary : Down Trend
Minor : Down Trend
Entry Sell at Order Block and Reversal Pattern, then Take Profit at Range Volatile Day Low and Stop Loss at Cancel Minor Trend.
HG Copper Futures LONGHG - copper demand is higher this year as the economy expands globally. On the 60 minute chart
price hit a high pivot on May 15th and pulled back in a standard Fib 0.5 fhsion. Price
has touched the upper boundary of that support three times and has now printed a wide range
green HA candle. I believe that this is a reversal pattern and will take a long trade here
targeting the pivot high mentioned. This is a 5% expectant profit amplified by the leverage
of a futures trade.I see this as a safe trade of a commodity that has a bullish bias overall.
I am also looking for some increased volume at this juncture to assure that some buying
momentum is coming into the market.

Nasdaq 100 - Futures Day Trading - 15min HypoYesterday we took the all-time high with a liquidity sweep creating a market structure shift on the 15min timeframe. Asia/London session is now in a range market. 8.30 Am we have Canadian CPI news. Careful for manipulation. I will be looking for clear indications and confirmation to trade in direction of the American market open. The overall value migration is up for long term investors, however with this temporary market structure shift model I will be looking for an intraday short when sweeping Asia/London highs.

Interesting area of priceWe are at around the 50% area of the current range. My analysis is for all time highs to be taken. Lets wait and see.

Beautiful example of the power of ICT analysisThis was the first Indian futures product I looked at after a friend asked me for an analysis. Lots and lots to study and see.

Move lower to drive higher.Patience is required when we look at daily time frame analysis. But remember HTF order flow is KING. Buys from the OTE marked.

Kingdom of BullsBeautiful reaction from the daily Order Block. I would have liked to have seen a deeper retracement to at least 50% of the range. But then what a run.

Range bound but likely to drive higher IMO Significant opportunities for the astute buyer for asian paints futures. Always confirm your entries on a lower time frame to reduce risk. Use a stop loss and good luck.

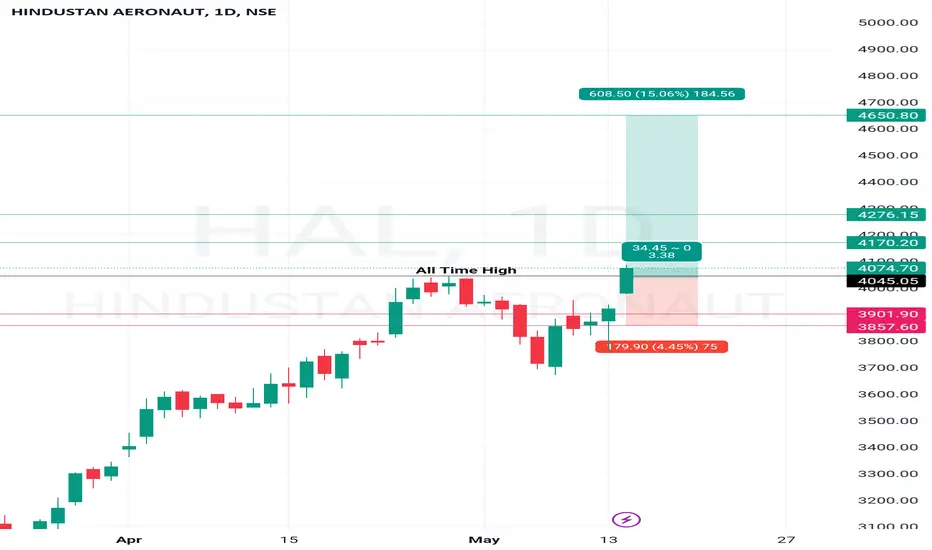
#HAL just Broken and Closed Above its Previous All Time High
Company has reduced debt.
Company is almost debt free.
Company has delivered good profit growth of 23.9% CAGR over last 5 years
Company has a good return on equity (ROE) track record: 3 Years ROE 26.7%
Company has been maintaining a healthy dividend payout of 29.6%
Company's working capital requirements have reduced from 98.4 days to 38.2 days
Strong order book providing healthy revenue visibility
HAL's order book remained healthy at ₹84,814 crore as on December 31, 2023 majorly contributed by manufacturing of various models of helicopters and aircraft of around 56,569 crore to be executed over the next five to six years. Major orders in the manufacturing segment pertains to supply of 83 Light Combat Aircraft-Mk1A version (LCA), 70 HTT-40, 6 LCA 10C/FOC, 4 Dornier apart from various aerospace structures for PSLV and GSLV. The ROH order book remained healthy at 28,277 crore and is expected to remain robust in the near to medium term as HAL undertakes the repair and maintenance work of aircraft manufactured by it for its entire life as well as for aircraft manufactured by others for which it has built infrastructure across the country. Furthermore, there remains visibility of future orders with strong order pipeline wherein orders for procurement of new platforms viz. Advanced Light Helicopter (ALH), Light Utility Helicopter (LUH), Additional Su-30, AL31 FP Engines and RD-33 Engines and mid-life upgrade of D0-228 Aircraft aggregating to 55,000 crore are in the advance stage of conclusion and are anticipated to be received within next three to siz months. In addition, orders for procurement of additional 97 Nos of LCA, 156 Nos of Light Combat Helicopter (LCH), 60 Nos Utility Helicopter-Maritime (UHM) including Performance Based Logistics (PBL) Contract, among others aggregating to 158,000 crore have been approved by the Defence Acquisition Council and the orders against the same are anticipated within next 18-24 months.
Given the significantly long tenure of its contracts, HAL enters into variable price contracts with its customers, Indian Airforce, Indian Army and Indian Navy, wherein the future escalation is built into the prices excluding forex fluctuation on procurement. The forex fluctuations are paid on an actual basis by the customers. This protects its margins from forex and raw material price escalation to a large extent. However, profitability may get impacted due to time or cost overrun in case there is execution delays at HAL's end.
Strong financial risk profile marked by healthy profitability and cash accruals and continued improvement in its
collection period
HAL continues to have a sizeable scale of operations and the TOI grew y-o-y by 8% to 26,397 crore in FY23 majorly on the back of increase in revenue from repairs and maintenance services. The PBILDT margin stood healthy at 25.68% in FY23. Income tax refund of 1193 crore and ₹973 crore further supported profitability in FY22 and FY23 respectively. The company earned gross cash accruals (GCA) of ₹7,000 crore in FY23 as against 5,634 crore in FY22. Its debt coverage indicators remain strong due to low reliance on external borrowings. The revenue contribution from manufacturing activities declined in FY22 and FY23 y-o-y, as majority of the manufacturing orders were completed, and the new contracts were under manufacturing and in development phase and delivery of the same is expected to be booked in FY25 onwards. Accordingly, its income is likely to get a fillip from FY25 onwards once deliveries start for 83 LCA Mk1A in a staggered manner.
In 9MFY24, HAL registered TOI of ₹15,612 crore and profit after tax (PAT) of ₹3,303 crore as against TOI of ₹14,433 crore and PAT of ₹2,970 crore registered in 9MFY23. CARE Ratings expects the profitability and debt coverage indicators to remain healthy, going forward.
The total receivables of HAL continued to remain below ₹5000 crore as on balance sheet date for past two years ended FY23 as it had realised substantial payment from government in FY22. The collection period has improved from 135 days in FY21 to 64 days in FY23. HAL also receives advances from its customers against the contracts which constitutes a stable source of funding its working capital requirement. The advances stood robust at 28,981 crore as on March 31, 2023 which further increased to *32,588 crore as on December 31, 2023. Timely realisation of dues and increase in advances has resulted in continued low reliance on debt to fund its working capital requirement. The same resulted in the overall gearing ratio of almost nil as on March 31, 2023.
The company has strongly articulated that going forward HAL's debt level is expected to remain low on the back of sustaining its
improved collection period.
Navigating Interest Rates with Micro Yield Futures Pair TradingIntroduction to Yield Futures
In the complex world of financial markets, Treasury Yield Futures offer investors a pathway to be exposed to changes in U.S. treasury yields. Among these instruments, the Micro 10-Year and Micro 2-Year Yield Futures stand out due to their granularity and accessibility. These futures contracts reflect the market's expectations for the yields of U.S. Treasury securities with corresponding maturities.
Micro 10-Year Yield Futures allow traders to express views on the longer end of the yield curve, typically influenced by factors like economic growth expectations and inflation. Conversely, Micro 2-Year Yield Futures are more sensitive to changes in the federal funds rate, making them a ideal for short-term interest rate movements.
Why Pair Trading?
Pair trading is a market-neutral strategy that involves taking offsetting positions in two closely related securities. This approach aims to capitalize on the relative price movements between the two assets, focusing on their correlation and co-integration rather than their individual price paths. In the context of Micro Treasury Yield Futures, pair trading between the 10-Year and 2-Year contracts offers a strategic advantage by exploiting the yield curve dynamics.
By simultaneously going long on Micro 10-Year Yield Futures and short on Micro 2-Year Yield Futures (or vice versa), traders can hedge against general interest rate movements while potentially profiting from changes in the yield spread between these maturities.
Analyzing the Current Market Conditions
Understanding the current market conditions is pivotal for executing a successful pair trading strategy with Micro 10-Year and Micro 2-Year Yield Futures. Currently, the interest rate environment is influenced by a complex interplay of economic recovery signals, inflation expectations, and central bank policies.
Central Bank Policies: The Federal Reserve's stance on interest rates directly affects the yield of U.S. Treasury securities. For instance, a hawkish outlook, suggesting rate hikes, can cause short-term yields to increase rapidly. Long-term yields might also rise but could be tempered by long-term inflation control measures.
Strategic Approach to Pair Trading These Futures
Trade Execution and Monitoring
To effectively implement a pair trading strategy with Micro 10-Year and Micro 2-Year Yield Futures, traders must have a solid plan for identifying entry and exit points, managing the positions, and understanding the mechanics of yield spreads. Here’s a step-by-step approach:
1. Identifying the Trade Setup
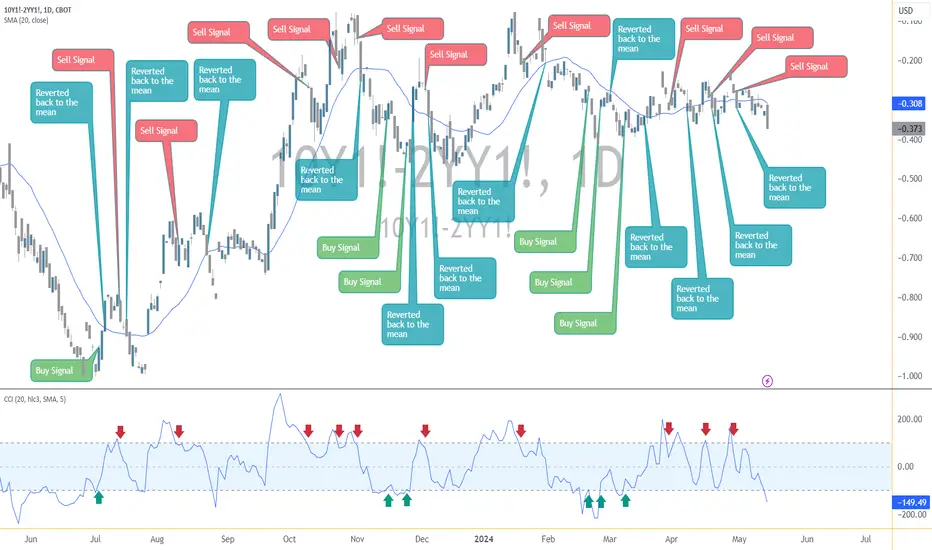
Mean Reversion Concept: In this strategy, we utilize the concept of mean reversion, which suggests that the yield spread will revert to its historical average over time. To quantify the mean, we employ a 20-period Simple Moving Average (SMA) of the spread between the Micro 10-Year and Micro 2-Year Yield Futures. This moving average serves as a benchmark to determine when the spread is significantly deviating from its typical range.
Signal Identification using the Commodity Channel Index (CCI): To further refine our entry and exit signals, the Commodity Channel Index (CCI) is employed. The CCI helps in identifying cyclical turns in the spread. This indicator is particularly useful for determining when the spread has reached a condition that is statistically overbought or oversold.
2. Trade Execution:
Going Long on One and Short on the Other: Depending on your analysis, you might go long on the Micro 10-Year Yield Futures if you anticipate the long-term rates will increase more relative to the short-term rates, or vice versa.
Position Sizing: Determine the size of each position based on the volatility of the yield spreads and your risk tolerance. It's crucial to balance the positions to ensure that the trade remains market-neutral.
Regular Review and adjustments: Regularly review the economic indicators and Fed announcements that could affect interest rates. Keep an eye on the spread for any signs that it might be moving back towards its mean or breaking out in a new trend.
Contract Specifications
To further refine our strategy, understanding the specific contract details of Micro 10-Year and Micro 2-Year Yield Futures is crucial:
Micro 10-Year Yield Futures (Symbol: 10Y1!) and Micro 2-Year Yield Futures (Symbol: 2YY1!):
Tick Value: Each tick (0.001) of movement is worth $1 per contract.
Trading Hours: Sunday to Friday, 6:00 p.m. to 5:00 p.m. (New York time) with a 60-minute break each day beginning at 5:00 p.m.
Initial Margin: Approximately $350 per contract, subject to change based on market volatility.
Pair Margin Efficiency
When trading Micro 10-Year and Micro 2-Year Yield Futures as a pair, traders can leverage margin efficiencies from reduced portfolio risk. These efficiencies lower the required capital and mitigate volatility impacts.
The two charts below illustrate the volatility contrast: the Daily ATR of the yield spread is 0.033, significantly lower than the 0.082 ATR of the Micro 10-Year alone, nearly three times higher. This lower spread volatility underlines a core advantage of pair trading—reduced market exposure and potentially smoother, more predictable returns.
Risk Management in Pair Trading Micro Yield Futures
Effective risk management is the cornerstone of any successful trading strategy, especially in pair trading where the goal is to mitigate market risks through balancing positions. Here are key risk management techniques that should be considered when pair trading Micro 10-Year and Micro 2-Year Yield Futures:
1. Setting Stop-Loss Orders:
Pre-determined Levels: Establish stop-loss levels at the outset of the trade based on historical volatility, maximum acceptable loss, and the distance from your entry point. This helps in limiting potential losses if the market moves unfavorably.
Trailing Stops: Consider using trailing stop-loss orders that move with the market price. This method locks in profits while providing protection against reversal trends.
2. Position Sizing and Leverage Control:
Balanced Exposure: Ensure that the sizes of the long and short positions are balanced to maintain a market-neutral stance. This helps in minimizing the impact of broad market movements on the pair trade.
Leverage Management: Be cautious with the use of leverage. Excessive leverage can amplify losses, especially in volatile market conditions. Always align leverage with your risk tolerance and market assessment.
3. Regular Monitoring and Adjustments:
Adaptation to Market Changes: Be flexible to adjust or close the positions based on significant changes in market conditions or when the initial trading assumptions no longer hold true.
4. Utilizing Risk Management Tools:
Risk Management Software: Set alerts on TradingView to help track the performance and risk level of your pair trades effectively.
Backtesting: Regularly backtest the strategy against historical data to ensure it remains effective under various market conditions. This can also help refine the entry and exit criteria to better handle market volatility.
Effective risk management not only preserves capital but also enhances the potential for profitability by maintaining disciplined trading practices. These strategies ensure that traders can sustain their operations and capitalize on opportunities without facing disproportionate risks.
Conclusion
Pair trading Micro 10-Year and Micro 2-Year Yield Futures offers traders a sophisticated strategy to exploit inefficiencies within the yield curve while mitigating exposure to broader market movements. This approach leverages the distinct characteristics of these two futures contracts, aiming to profit from the relative movements between long-term and short-term interest rates.
Key Takeaways:
Market Neutral Strategy: Pair trading is fundamentally a market-neutral strategy that focuses on the relative performance of two assets rather than their individual price movements. This can provide insulation against market volatility and reduce directional risk.
Importance of Strategy and Discipline: Successful pair trading requires a disciplined approach to strategy implementation, from trade setup and execution to ongoing management and exit. Adhering to a predefined strategy helps maintain focus and objectivity in trading decisions.
Dynamic Market Adaptation: The financial markets are continuously evolving, influenced by economic data, policy changes, and global events. A successful pair trader must remain adaptable, continuously analyzing market conditions and adjusting strategies as needed to align with the current economic landscape.
Comprehensive Risk Management: Effective risk management is crucial in pair trading, involving careful consideration of position sizing, stop-loss settings, and regular strategy reviews. This ensures sustainability and longevity in trading by protecting against undue losses.
By maintaining a disciplined approach and adapting to market changes, traders can harness the potential of Micro Treasury Yield Futures for strategic pair trading, balancing risk and reward effectively.
When charting futures, the data provided could be delayed. Traders working with the ticker symbols discussed in this idea may prefer to use CME Group real-time data plan on TradingView: tradingview.sweetlogin.com This consideration is particularly important for shorter-term traders, whereas it may be less critical for those focused on longer-term trading strategies.
General Disclaimer:
The trade ideas presented herein are solely for illustrative purposes forming a part of a case study intended to demonstrate key principles in risk management within the context of the specific market scenarios discussed. These ideas are not to be interpreted as investment recommendations or financial advice. They do not endorse or promote any specific trading strategies, financial products, or services. The information provided is based on data believed to be reliable; however, its accuracy or completeness cannot be guaranteed. Trading in financial markets involves risks, including the potential loss of principal. Each individual should conduct their own research and consult with professional financial advisors before making any investment decisions. The author or publisher of this content bears no responsibility for any actions taken based on the information provided or for any resultant financial or other losses.