Options Blueprint Series: Ratio Spreads for the Advanced TraderIntroduction to Ratio Spreads on E-mini Dow Jones Futures
In the dynamic world of options trading, Ratio Spreads stand out as a sophisticated strategy designed for traders looking to leverage market nuances to their advantage. Regular options on the E-mini Dow Jones Futures are a popular choice (YM).
Defining the E-mini Dow Jones (YM) Futures Contract
Before delving into the specifics of Ratio Spreads, understanding the underlying contract on which these options are based is crucial. The E-mini Dow Jones Futures, symbol YM, offers traders exposure to the 30 blue-chip companies of the Dow Jones Industrial Average in a smaller, more accessible format. Each YM contract represents $5 per index point.
Key Contract Specifications:
Point Value: $5 per point of the Dow Jones Industrial Average.
Trading Hours: Sunday - Friday, 6:00 PM - 5:00 PM (Next day) ET with a trading halt from 5:00 PM - 6:00 PM ET daily.
Margins: Varied based on broker but generally lower than the full-sized contracts, providing a cost-effective entry for various trading strategies. CME Group suggests $8,400 per contract at the time of this publication.
Ratio Spread Margins: Often require a careful calculation as they involve multiple positions. Traders must consult with their brokers to understand the specific margin requirements for entering into ratio spreads using YM futures. Margins for Ratio Spreads are often equal to the margin requirement when trading the outright futures contract.
Understanding Ratio Spreads
Ratio Spreads involve buying and selling different amounts of options at varying strike prices, but within the same expiration period. This strategy is typically employed to exploit expected directional moves or stability in the underlying asset, with an additional emphasis on benefiting from time decay.
Types of Ratio Spreads:
Call Ratio Spread: Involves buying calls at a lower strike price and selling a greater number of calls at a higher strike price. This setup is generally used in mildly bullish scenarios.
Put Ratio Spread: Consists of buying puts at a higher strike price and selling more puts at a lower strike price, suitable for mildly bearish market conditions.
Mechanics:
Execution: Traders initiate these spreads by first determining their view on the market direction. For a bullish outlook, a call ratio spread is suitable; for a bearish view, a put ratio spread would be applicable.
Objective: The primary goal is to benefit from the premium decay of the short positions outweighing the cost of the long positions. This is enhanced if the market moves slowly towards the strike price of the short options or remains at a standstill.
Risk Management: It's crucial to manage risks as these spreads can lead to limited losses if the market moves against the trader, or surprisingly to many, to unlimited losses if the market moves sharply in the desired direction. Proper stop-loss settings, adjustments and continual market analysis are imperative.
Focused Strategy: Bullish Call Ratio Spread
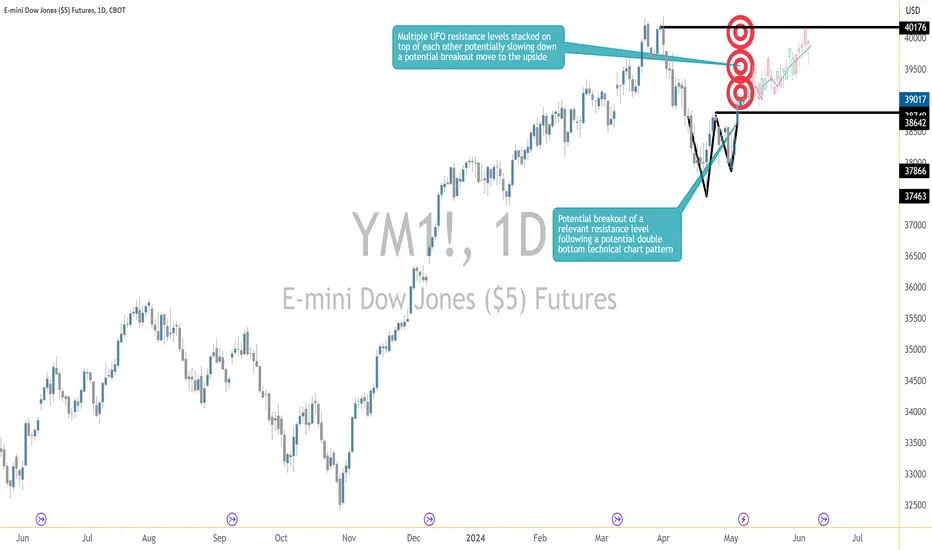
In the context of the E-mini Dow Jones, considering the current upward trend with potential slow advancement due to overhead UFO (UnFilled Orders) Resistances, a Bullish Call Ratio Spread can be particularly effective. This strategy allows traders to capitalize on the gradual upward movement while keeping a lid on risks associated with faster, unexpected spikes.
Strategy Setup:
Selecting Strikes: Choose a lower strike where the long calls are bought and a higher strike where more calls are sold. The selection depends on the resistance levels indicated by the UFOs.
Position Sizing: Typically, the number of calls sold is higher than those bought, maintaining a ratio that aligns with the trader's risk tolerance and market outlook.
Market Conditions: Best implemented when expecting a gradual increase in the market, allowing time decay to erode the value of the short call positions advantageously.
Real-time Market Example: Bullish Call Ratio Spread on E-mini Dow Jones Futures
Given the current market scenario where the Dow Jones Index is experiencing a bullish breakout, it’s crucial to align our options trading strategy to take advantage of potential slow upward movements signaled by overhead UFO Resistances. This setup suggests a favorable environment for a Bullish Call Ratio Spread, aiming to maximize the benefits of time decay while managing risk exposure effectively.
Setting Up the Bullish Call Ratio Spread:
1. Selection of Strike Prices:
Long Calls: Choose a strike price near the current market level (Strike = 39000).
Short Calls: Set the higher strike prices right at or above the identified UFO Resistances (Strike = 41000). The rationale here is that these levels are expected to cap the upward movement, thus enhancing the likelihood that these short calls expire worthless or decrease in value, maximizing the time decay benefit.
2. Ratio of Calls:
Opt for a ratio that reflects confidence in the bullish movement but also cushions against an unexpected rally. A common setup might be 1 long call for every 2 short calls.
Execution:
Trade Entry: Enter the trade when you observe a confirmed break above a minor resistance or a pullback that respects the upward trend structure.
Monitoring: Regularly monitor the price action as it approaches the UFO Resistances. Adjust the position if the market shows signs of either stalling or breaking through these levels more robustly than anticipated.
Trade Management:
Adjustments: If the market advances towards the higher strike more quickly than expected, consider buying back some short calls to reduce exposure.
Risk Control: Implement stop-loss orders to mitigate potential losses should the market move sharply against the position. This could be set at a level where the market structure changes from bullish to bearish.
This real-time scenario provides a practical example of how advanced traders can utilize Bullish Call Ratio Spreads to navigate complex market dynamics effectively, leveraging both market sentiment and technical resistance points to structure a potentially profitable trade setup.
Advantages of Ratio Spreads in Options Trading
Ratio Spreads offer a strategic advantage in options trading by balancing the potential for profit with a controlled risk management approach. Here are some key benefits of incorporating Ratio Spreads into your trading arsenal:
1. Maximizing Time Decay
Optimized Premium Decay: By selling more options than are bought, traders can capitalize on the accelerated decay of the premium of short positions. This is particularly advantageous in markets exhibiting slow to moderate price movements, as expected with the current Dow Jones trend influenced by UFO resistances.
2. Cost Efficiency
Reduced Net Cost: The cost of purchasing options is offset by the income received from selling options, reducing the net cost of entering the trade. This can provide a more affordable way to leverage significant market positions without a substantial upfront investment. The Net Debit paid is 403.4 (690 – 143.3 – 143.3) = $2,017 since each YM point is worth $5.
Note: We are using the CME Group Options Calculator in order to generate fair value prices and Greeks for any options on futures contracts.
3. Profit in Multiple Market Conditions
Versatile Profit Scenarios: Depending on the setup, Ratio Spreads can be profitable in a stagnant, slightly bullish, or slightly bearish market. The key is the strategic selection of strike prices relative to expected market behavior, enabling profits through slight directional moves while protected against losses from significant adverse moves.
4. Flexible Adjustments
Scalability and Reversibility: Given their structure, Ratio Spreads allow for easy scaling or reversing positions depending on market movements and trader outlook. This flexibility can be a critical factor in dynamic markets where adjustments need to be swift and cost-effective.
Risk Management in Ratio Spreads
While Ratio Spreads offer several benefits, they are not without risks, particularly from significant market moves that can lead to potentially unlimited losses. Here’s how to manage those risks:
Stop-Loss Orders: Setting stop-losses at predetermined levels can help traders exit positions that move against them, preventing larger losses.
Position Monitoring: Regular monitoring and analysis are crucial, especially as the market approaches or reaches the strike price of the short options.
Adjustments: Being proactive about adjusting the spread, either by buying back short options or by rolling the positions to different strikes or expiries, can help manage risk and lock in profits.
Conclusion
Ratio Spreads, particularly in the format of Bullish Call Ratio Spreads demonstrated with E-mini Dow Jones Futures, offer a sophisticated strategy that balances potential profit with manageable risks. This approach is suited for traders who have a nuanced understanding of market dynamics and can navigate the complexities of options with strategic finesse.
When charting futures, the data provided could be delayed. Traders working with the ticker symbols discussed in this idea may prefer to use CME Group real-time data plan on TradingView: tradingview.sweetlogin.com This consideration is particularly important for shorter-term traders, whereas it may be less critical for those focused on longer-term trading strategies.
General Disclaimer:
The trade ideas presented herein are solely for illustrative purposes forming a part of a case study intended to demonstrate key principles in risk management within the context of the specific market scenarios discussed. These ideas are not to be interpreted as investment recommendations or financial advice. They do not endorse or promote any specific trading strategies, financial products, or services. The information provided is based on data believed to be reliable; however, its accuracy or completeness cannot be guaranteed. Trading in financial markets involves risks, including the potential loss of principal. Each individual should conduct their own research and consult with professional financial advisors before making any investment decisions. The author or publisher of this content bears no responsibility for any actions taken based on the information provided or for any resultant financial or other losses.
Futurestrading
Today's Gold Price and Future DirectionAmidst prolonged tensions in the Middle East, global gold prices have surged, defying expectations despite robust economic data from the U.S. The sharp rise in gold prices comes as Israel signals readiness to retaliate against Iran's attacks, disregarding calls for restraint from Western nations.
In the face of escalating geopolitical tensions, global gold prices show no signs of slowing down, with projections pointing towards a potential climb to the $2460 mark. Additionally, the metal is approaching a critical Fibonacci 1.618 profit-taking level, aligning with predictions from Dow Theory."

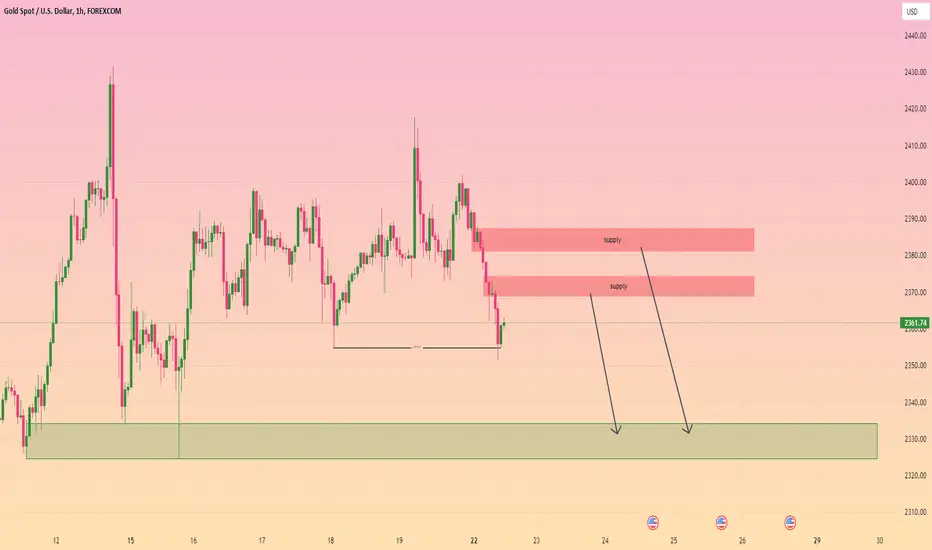
Gold Shows Sell Signals Amidst DowntrendStay informed with our latest analysis of the XAUUSD market! Gold prices are currently trading around $2400, exhibiting a downtrend with sell signals. Recent price action has breached key support levels, with technical indicators like moving averages and RSI indicating selling pressure. Explore potential trading opportunities with our detailed analysis now!
📈Bitcoin Analysis: Market Outlook for the Week👑📈 BTC Technical Analysis - Weekly Outlook 📈
As traders return to the market on this Tuesday, the first day of the trading week, let's delve into the analysis of Bitcoin (BTC). With Bitcoin analysis lacking for the past eight days and most of last week's focus on spot trading, it's opportune to switch gears and explore Bitcoin's potential for day trading in the futures market.
🔍Bitcoin remains within the range of $73,305 to $60,850, demonstrating resilience even amidst geopolitical tensions between Iran and Israel. Although a selloff briefly breached the $60,850 support, the market swiftly bounced back within the range. Currently, it faces minor resistance at $66,413, denoted in gray. A breach above this level could lead to a potential rally towards $71,277. Conversely, a rejection at $66,413 may signal seller dominance, potentially breaking below $60,850 and initiating a corrective phase.
📉Despite geopolitical concerns, the cryptocurrency market sentiment remains positive, suggesting that the market may not be overly speculative. Smart money typically enters the market when retail investors, lacking financial literacy, flood in with substantial investments. However, the market is not yet at a level of excessive speculation where such influxes occur.
📊Volume analysis is inconclusive due to the lower trading volumes typically observed during weekends and Mondays. However, recent bullish 4-hour green candlesticks exhibited promising volume, while red candle volumes remained relatively subdued. Additionally, the RSI indicator broke through a crucial resistance at 58.44, signaling a bullish trend, potentially providing confirmation for entry positions.
💡For entry positions, consider the $66,413 resistance level, currently under scrutiny. A break above this level, confirmed by candlestick validation, could present a viable entry opportunity. Alternatively, patience is advised for a retest of the $60,850 support level or a formation of a new market structure before committing to positions.
📝As we navigate the Bitcoin market this week, it's essential to remain vigilant and adaptable to changing market dynamics. The $66,413 level serves as a critical juncture, potentially determining the short-term direction of Bitcoin. Stay tuned for further updates and trading insights.
🧠💼It's important to acknowledge the inherent risks in futures trading, with the potential for margin calls if risk management is neglected. Always adhere to strict capital management principles and utilize stop-loss orders, ensuring that the initial target offers a risk-to-reward ratio of 2

ONG exhausted?After receiving our aggressive FBuy, we had a good 11% increase. Now it's seems that it's going down as the bears are in control.
First target: 0.50 and more.
DYOR. Anything above 0.57 is trend continuation

NQ! futures, Update analysis 18/04/2024our setup still running to the target, Our analysis indicate that the weekly low was created yesterday 17/04/2024. we will be bullish to take our target and the market will go very very bearish.
If any explication fell free to contact me here

MRF correction analysis and Swing position
Price has just reacted to Monthly Supply n there is a Fresh Quarterly Demand till which Price should retrace.
Following is the Curve Analysis
Price after reacting to the Monthly Supply has formed a Fresh Weekly Supply and has violated a Weekly Demand hence this Fresh Weekly Supply is a Trade Supply.
Following is the Positional Swing Short Trade.

Options Blueprint Series: The Collar Strategy for Risk ReductionIntroduction to Nasdaq Futures
Nasdaq Index Futures offer traders exposure to the Nasdaq-100 index, a benchmark for U.S. technology stocks, without directly investing in the index's component stocks. Trading on the Chicago Mercantile Exchange (CME), Nasdaq Futures provide a critical tool for managing market exposure on the future of technology and biotech sectors.
Key Contract Specifications:
Point Value: Each point of the index equates to $20 per contract.
Margins: As determined by the CME, margins vary, reflecting the volatility and current market conditions. As of the time of this publication the CME website shows a maintenance margin of $17,700 per contract.
Trading Hours: Nearly 24-hour trading capability, aligning with global market hours to provide continuous access for traders.
It's important to note that similar strategies and benefits are available with Micro Nasdaq Futures , which are scaled down to a tenth of the standard Nasdaq Futures, making them accessible to a broader range of traders due to their lower margin requirements (Margin is 10 times less, point values are 10 times less, etc.)
Basics of the Collar Strategy
The Collar strategy is a risk management tool used by traders to protect against large losses in their investments while also capping potential gains. It is particularly useful in volatile markets or when significant price swings are expected but their direction is uncertain.
Components of the Collar Strategy:
Own the Asset: Typically involves owning the underlying asset, but in the case of futures, it involves holding a long position in the Nasdaq Futures contract.
Buy a Protective Put: This put option gives the right to sell your futures contract at a predetermined strike price, serving as insurance against a significant drop in the market.
Sell a Covered Call: This call option grants someone else the right to buy your futures contract at a set strike price, generating income that can offset the cost of the put option, but it limits the profit potential if the market rises sharply.
This strategy forms a price collar around the current value of the futures contract, protecting against drastic movements in both directions. The use of this strategy in Nasdaq Futures trading can be especially effective given the index's exposure to high-growth, high-volatility sectors.
Application to Nasdaq Futures
Implementing the Collar strategy with Nasdaq Futures involves selecting the right put and call options to effectively hedge the position. Here's how you can set up this strategy:
Choose the Underlying Contract: Decide whether to use standard E-mini Nasdaq-100 Futures or Micro mini Nasdaq-100 Futures based on your investment size and risk tolerance.
Select the Put Option: Identify a put option with a strike price below the current market price of the Nasdaq Futures. This strike should represent the maximum loss you are willing to accept. The graphics of this article show UFO Support Price Levels below which accepting a larger loss could be seen as a form of hope. Using UFO Support Price Levels as a reference to select the Put strike could be an efficient manner to determine the desired risk.
Choose the Call Option: Pick a call option with a strike price above the current market level, where you believe gains will be limited. The premium received from selling this call helps offset the cost of the put, reducing the overall expense of the setup. Selecting a call with its premium equal to the put price would allow for the Collar strategy to be cost-free (not risk-free).
Risk Profile Visualization: A graphical representation of the risk profile will show a flat line of loss limited to the downside by the put and capped gains on the upper side by the call. This visualization helps traders understand the potential financial outcomes and their likelihood.
Forward-Looking Trade Idea
Considering the recent market dynamics, Nasdaq Futures have been experiencing a range-bound pattern after reaching all-time highs. With current geopolitical tensions such as the recent conflict between Iran and Israel, there's a potential for sudden market movements.
Scenario Analysis:
Continuation of Uptrend: If the market breaks above the range, selling the covered call may yield limited gains but will provide premium income.
Significant Drop: If the market drops due to intensified conflicts, the protective put limits the potential loss, safeguarding the investment. That is knowing that if the market was to rebound after a significant drop, the strategy could end up as profitable as long such rebound would happen prior to the Options expiration date.
Trade Setup:
Entry Point: Current market price of Nasdaq Futures.
Put Option: Select a put option below the current market price. The chart example uses the UFO Support Level located around 18,000. Premium paid for the 18,000 Put is estimated to be 511.79 points * $20 ($10,235.8).
Call Option: Choose a call option above the current market price targeting the same level of premium as the premium paid for the put. The 18,300 Call is estimated to provide 522.65 points * $20 ($10,453).
Expiration: Options with a 1-3 month expiration to balance cost and protection level. This trade example uses June Expiration which is 67 days away from expiration.
As seen on the above screenshot, we are using the CME Options Calculator in order to generate fair value prices and Greeks for any options on futures contracts.
This setup aims to utilize the Collar strategy to navigate through uncertain times with controlled risk, taking into account both the potential for continuation of the uptrend and a protective mechanism against a sharp decline.
Risk Management Discussion
Effective risk management is crucial when trading futures and options. The Collar strategy inherently incorporates risk management by design, but understanding and applying additional risk control measures is essential for successful trading.
Key Risk Management Techniques:
Limited Risk: By default, the Collar strategy is a limited risk strategy where the risk is calculated by looking at the current Nasdaq Futures price compared to the Put strike price and adding or subtracting the Collar execution price for a debit or credit respectively.
Use of Stop-Loss Orders: Although the Collar strategy provides a natural hedge, setting stop-loss orders beyond the put option's strike can provide an extra safety net against gap risk and extraordinary market events.
Regular Review and Adjustment: As market conditions change, the relevance of the chosen strike prices may alter. Regularly reviewing and adjusting the positions to ensure they still reflect your risk appetite and market outlook is advised.
Diversification: While the Collar strategy protects an individual position, diversifying across different asset classes can further protect the portfolio from concentrated risks associated with any single market.
Conclusion
The Collar strategy offers Nasdaq Futures traders a structured way to manage risk while maintaining the potential for profit. By capping potential losses with a protective put and limiting gains with a covered call, traders can navigate uncertain markets with increased confidence. This strategy is particularly applicable in volatile markets or during periods of geopolitical tension, providing a buffer against significant fluctuations.
When charting futures, the data provided could be delayed. Traders working with the ticker symbols discussed in this idea may prefer to use CME Group real-time data plan on TradingView: tradingview.sweetlogin.com This consideration is particularly important for shorter-term traders, whereas it may be less critical for those focused on longer-term trading strategies.
General Disclaimer:
The trade ideas presented herein are solely for illustrative purposes forming a part of a case study intended to demonstrate key principles in risk management within the context of the specific market scenarios discussed. These ideas are not to be interpreted as investment recommendations or financial advice. They do not endorse or promote any specific trading strategies, financial products, or services. The information provided is based on data believed to be reliable; however, its accuracy or completeness cannot be guaranteed. Trading in financial markets involves risks, including the potential loss of principal. Each individual should conduct their own research and consult with professional financial advisors before making any investment decisions. The author or publisher of this content bears no responsibility for any actions taken based on the information provided or for any resultant financial or other losses.

Grain Futures Gain GroundGrain futures are higher in the early morning trade as some as headline risk looms into the weekend.
Corn
Technicals (May)
May corn futures are fractionally lower in the early morning trade as prices linger near our pivot pocket from 431 1/2-435, which just happens to be right near the middle of first support and first resistance. We like the upside potential in corn but some of the deferred contracts have a more friendly technical landscape than the May.
Bias: Bullish/Neutral
Resistance: 441 3/4-444 1/2***, 447 1/2-450****
Pivot: 431 1/2-435
Support: 421-422***
Fund Positioning
Friday’s Commitment of Traders report showed that Funds were net sellers of about 8k contracts (through 4/2/24), that puts their net short position at 259,556.
Seasonal Trends
(Past performance is not necessarily indicative of future results)
Below is a look at price averages for December corn, using the 5, 10, 15, 20, and 30 year averages.
Technicals (May)
May soybean futures are fractionally higher in the early morning trade. Support from 1170-1175 will continue to be very important for the Bulls to defend through this week's trade. A break and close below could spark another wave of pressure. On the resistance side of things, they want to see a close above resistance from 1198-1205 1/2.
Bias: Neutral/Bullish
Resistance: 1198-1205 1/2***, 1212 3/4-1216***
Pivot: 1187
Support: 1170-1175***, 1161-1167****
Fund Positioning
Friday's Commitment of Traders report showed Funds were net sellers of roughly 3.5k contracts, trimming their net short position to 138,256 contracts.
Seasonal Trends
(Past performance is not necessarily indicative of future results)
Below is a look at price averages for November soybeans, using the 5, 10, 15, 20, and 30 year averages.
Wheat
Technicals (May)
Wheat futures broke out above trendline resistance last week which adds to the recent trend of higher highs and higher lows. If the Bulls can achieve a close above resistance from 568 1/2-570 we could see it open the door for an extension towards the psychologically and technically significant $6.00 level.
Bias: Neutral/Bullish
Resistance: 568 1/2-570***, 595 3/4-600***, 608 1/2-611**
Pivot: 550-555
Support: 525**
Seasonal Trends
(Past performance is not necessarily indicative of future results)
Below is a look at price averages for July wheat, using the 5, 10, 15, 20, and 30 year averages. Historically this isn't the most friendly time of year.
Check out CME Group real-time data plans available on TradingView here: tradingview.sweetlogin.com
Disclaimers:
CME Real-time Market Data help identify trading set-ups and express my market views. If you have futures in your trading portfolio, you can check out on CME Group data plans available that suit your trading needs tradingview.sweetlogin.com
*Trade ideas cited above are for illustration only, as an integral part of a case study to demonstrate the fundamental concepts in risk management under the market scenarios being discussed. They shall not be construed as investment recommendations or advice. Nor are they used to promote any specific products, or services.
Futures trading involves substantial risk of loss and may not be suitable for all investors. Trading advice is based on information taken from trade and statistical services and other sources Blue Line Futures, LLC believes are reliable. We do not guarantee that such information is accurate or complete and it should not be relied upon as such. Trading advice reflects our good faith judgment at a specific time and is subject to change without notice. There is no guarantee that the advice we give will result in profitable trades. All trading decisions will be made by the account holder. Past performance is not necessarily indicative of future results.
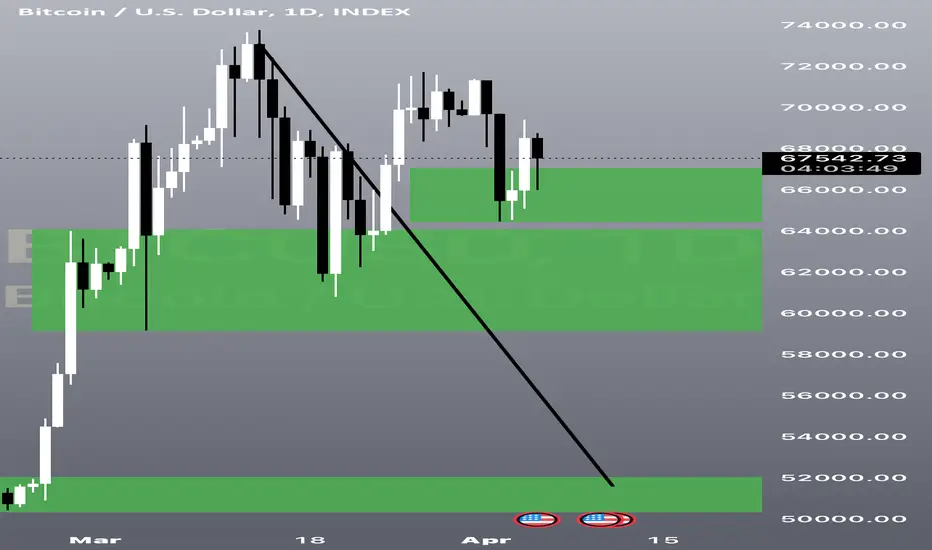
BITCOIN ANALYSIS I'm still bullish #bitcoin but I'm not as certain as I was before! The 2 green highlighted levels are still holding up. I'm my view, either bank's & institutions are filling orders before the next leg up which will be a new all time high again! However, if this is a battle between buyers & sellers, I'm not too confident these levels will hold. If they don't, expect it to fall to the highlighted demand zone/support level below @ GETTEX:52K level/zone!
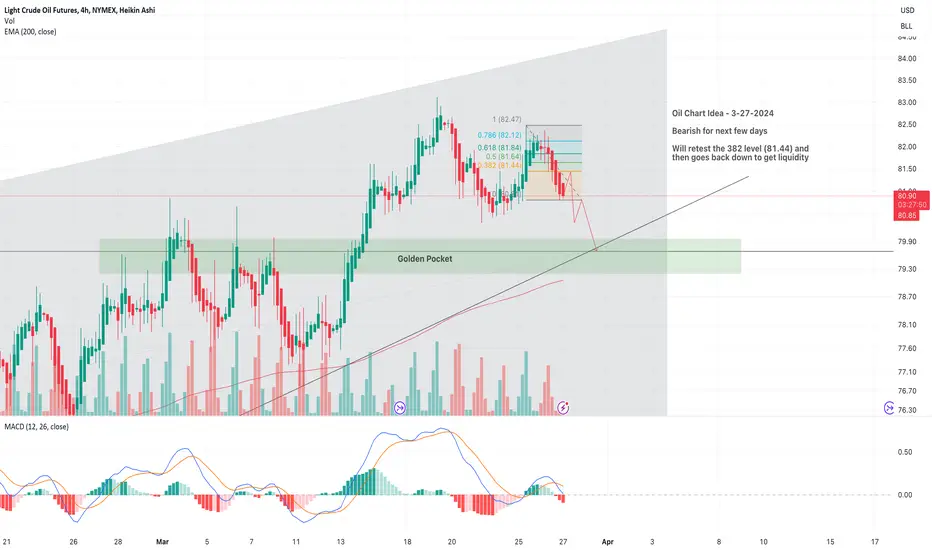
CL Chart Idea - 3/27/2024 - Bearish for next few days/weekOil Chart Idea - 3-27-2024
Bearish for next few days/week
IMO, It should retest the 0.382 (81.44 to 81.62) region and then goes back down to get liquidity from golden pocket (79.97 to 79.68).
BIGTIME DOUBLE BOTTOM BULLISH PATTERNBIGTIME has formed a double bottom pattern on 15m and 1 hour time frame, a good short term quick scalp.
TP: 0.355-0.3566
SL: 0.34
Leverage: 20-50x

CHARTOLOGY 101 --- 43 years in the makingThe bigger the pattern
the bigger the consolidation
the more explosive the move
how about this Chart Porn?
Cup and handle
I expect the log tgt not only to be made but surpassed given yesterdays event's in #baltimore
Yup Massive east coast supply chain disruptions to be expected
Ports jammed
Aviation fuel disruptions
Major economic ripples could transpire form this
the east coast is home to 120 million people I believe ..
Wow
Stock up on your Cadbury's and many other things ... :0

How to Start Future and Options Trading?Future and option trading are popular investment strategies in the world of finance. Both involve making investments in financial instruments with the expectation of making a profit. While the two types of trading have their similarities, they are also quite different in terms of their structure and the risks involved.
Before you start trading in the Future and Options segment, you need to understand the basics of F&O first.
So, let’s understand its basics first.
What are futures?
Futures are financial contracts that allow traders to buy or sell an asset at a predetermined price and date in the future.
The price of the asset in the future is agreed upon at the time the contract is made. Futures trading can involve a wide range of assets, such as stocks, commodities, currencies, and bonds.
The main advantage of futures trading is that it allows traders to make investments in assets that they may not otherwise have access to.
It also provides a way for traders to hedge their existing investments. For example , if a trader owns a stock that they expect to decrease in value, they can sell a futures contract for that stock and lock in the current market price.
If the stock does decrease in value, the trader can buy back the futures contract at a lower price and make a profit.
What are the options?
Options are contracts that give traders the right, but not the obligation, to buy or sell an asset at a predetermined price and date in the future.
The price of the asset in the future is agreed upon at the time the contract is made, but the trader is not obligated to follow through with the trade. Options trading can also involve a wide range of assets.
The main advantage of options trading is that it provides traders with flexibility.
They can choose to buy or sell an option, depending on their investment goals. Options also provide traders with a way to limit their losses.
For example , if a trader owns a stock that they expect to decrease in value, they can buy a put option for that stock. If the stock does decrease in value, the trader can exercise the option and sell the stock at the predetermined price, limiting their losses.
Lot Size:
In the context of Futures and Options (F&O) trading, lot size refers to the standardized quantity of the underlying asset specified in the contract.
It represents the minimum number of units of the underlying asset that can be bought or sold in a single F&O transaction.
For example , if the lot size of a stock in the F&O market is 500, then a trader has to buy or sell a minimum of 500 units of that stock in a single transaction. The lot size is determined by the stock exchange and is specified in the contract specifications for each F&O instrument.
The lot size is an important factor in F&O trading as it determines the margin required for trading, the minimum quantity that can be traded, and the maximum loss that can be incurred in a single transaction.
Traders need to be aware of the lot size of the F&O contract they wish to trade to ensure they have sufficient capital to cover the margin requirements and to avoid inadvertently taking a larger position than intended.
It is also worth noting that the lot size of F&O contracts can change over time. Stock exchanges may adjust the lot size based on factors such as the liquidity of the underlying asset, market conditions, and regulatory requirements.
Traders should regularly check the contract specifications of the F&O instruments they are interested in trading to ensure they have the most up-to-date information on lot sizes.
Differences between futures and options:
While futures and options have some similarities, they also have some key differences. One of the main differences is that futures contracts are binding, while options contracts are not.
This means that traders who buy futures contracts are obligated to follow through with the trade, while traders who buy options contracts have the flexibility to choose whether or not to follow through with the trade.
Another difference is the level of risk involved. Futures trading is generally considered to be riskier than options trading because traders are obligated to follow through with the trade, even if the market conditions are not favourable.
Options trading, on the other hand, provides traders with more flexibility to limit their losses.
Future and option trading can be complex, and it is important for traders to understand the risks involved before making any investments.
It is also important for traders to have a clear understanding of their investment goals and to choose the trading strategy that best aligns with those goals.
Steps to start future and option trading:
Here are some steps to help you get started with F&O trading:
Learn the basics of F&O trading: F&O trading involves complex financial instruments and can be risky if you do not understand how it works.
You should educate yourself about the basics of F&O trading, including concepts such as lot size, margin, expiry, and strike price.
Develop a Trading Plan: Before you start trading, it is important to have a well-defined trading plan that includes your investment goals, risk tolerance, trading strategy, and money management rules.
You should also decide on the F&O instruments you want to trade, based on factors such as liquidity, volatility, and your level of expertise.
Start with a small investment: F&O trading involves high leverage and can result in significant profits or losses.
It is advisable to start with a small investment and gradually increase your exposure as you gain experience and confidence.
Monitor your positions: F&O trading requires active monitoring of your positions as the market can move quickly and your profit or loss can change rapidly.
You must use tools such as stop-loss orders and trailing stop-loss orders to manage your risk.
In conclusion:
F&O trading can be a profitable investment opportunity for traders who are willing to put in the time and effort to learn and develop a trading plan. However, it is important to understand the risks involved and to trade with caution.
___________________________
💻📞☎️ always do your research.
💌📫📃 If you have any questions, you can write me in the comments below, and I will answer them.
📊📌❤️And please don't forget to support this idea with your likes and comment
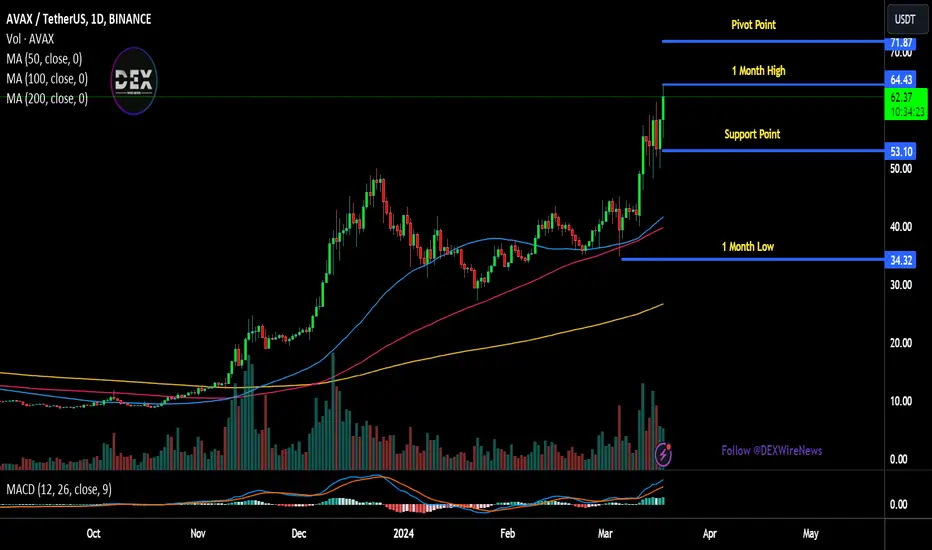
Avalanche Price Rallies 12% Amid Binance AnnouncementThe cryptocurrency market is abuzz with excitement as Avalanche ( CRYPTOCAP:AVAX ) experiences a remarkable surge of nearly 12%. This surge coincides with a strategic announcement from Binance, the leading crypto exchange, signaling a significant shift in market dynamics.
Binance's Endorsement Fuels Momentum:
The surge in CRYPTOCAP:AVAX price underscores the growing confidence of investors, propelled by Binance's latest move. With the introduction of a USDC-margined AVAX Perpetual Contract offering up to 75x leverage on its Futures platform, Binance aims to enhance trading options and user experience, stimulating trading activity and liquidity for $AVAX.
Expanding Trading Options:
Scheduled for March 20, 2024, Binance's USDC-margined CRYPTOCAP:AVAX Perpetual Contract opens new avenues for traders, enabling them to capitalize on increased leverage options. The 10% promotional trading fee discount until April 3, 2024, further incentivizes trading, while the Multi-Assets Mode feature provides flexibility across multiple margin assets.
Binance's Strategic Commitment:
Binance's endorsement through the introduction of the CRYPTOCAP:AVAX Perpetual Contract underscores its strategic commitment to expanding offerings and meeting user needs. By providing access to CRYPTOCAP:AVAX trading with enhanced leverage options, Binance reinforces its position as a key player in the crypto market.
Impact on Market Sentiment:
Binance's endorsement signals a vote of confidence in Avalanche's potential, driving positive market sentiment and investor interest. With increased access to CRYPTOCAP:AVAX trading and favorable trading conditions, demand for CRYPTOCAP:AVAX is poised for further upticks, potentially driving its price higher.
Avalanche Foundation's Board Expansion:
In addition to Binance's announcement, the recent expansion of the Avalanche Foundation's board has bolstered market sentiment. These developments underscore the growing significance of CRYPTOCAP:AVAX within the cryptocurrency ecosystem, attracting attention from investors and enthusiasts alike.
Current Status and Future Outlook:
As of writing, Avalanche ( CRYPTOCAP:AVAX ) price surged to $62.52, marking a significant gain of 12.73% with a monthly increase of around 50%. With trading volume holding steady and the potential for further upticks, CRYPTOCAP:AVAX continues to capture the attention of investors, positioning itself as a promising asset within the cryptocurrency market.
GOLD Analysis - Continuous, Just as the Markets !This is a Thread, so Follow for Technical Analysis performed with TrapZone Pro & UMVD Indicators.
* Trend is Based on TrapZone Color
* Bar Colors give us Momentum Green from strong Up Moves. Red Bars point to strong Down Moves.
* Red UMVD = Selling Pressure & Green UMVD = Buying Pressure. Purple is for Divergence = Battle of Supply & Demand
--------------------
1-18-2024
GREEN UMVD pushing the price UP with a strong RED TrapZone at the moment.
See higher Time Frame Analysis below

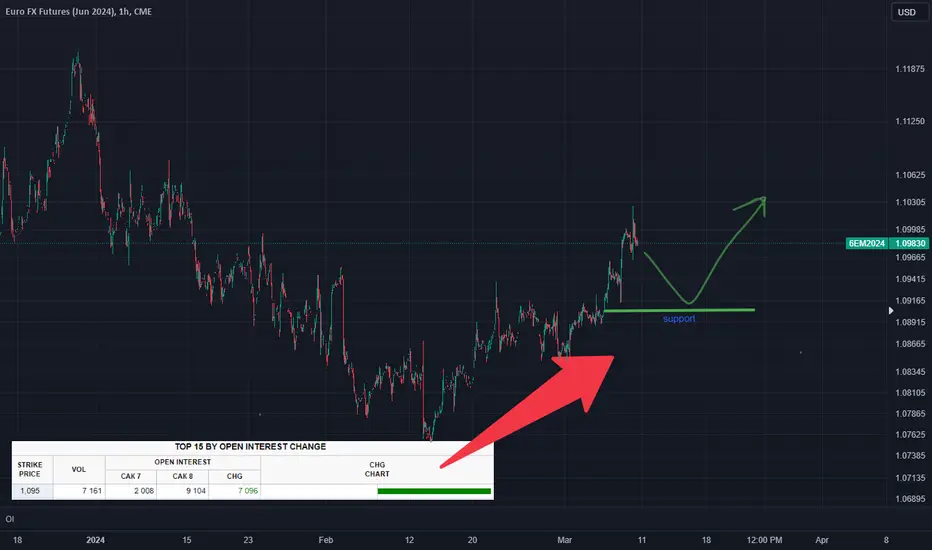
Euro Futures SupportAccording to the latest sentiment analysis data open source, the bullish sentiment on the Euro remains strong. The data shows that the number of short traders are more than long traders which mostly leads for furher upmove.
Option Trades Sentiment
Option trades sentiment is another important factor to consider when making trading decisions for us. Based on the latest option trade analysis data from CME exchange, option trades data on the Euro is also bullish. The baseline is that naked puts can be easily convert in to syntetic long positions.
Options traders commonly use this technique due to the leverage effect in options trading. Buying activity at this level can have a significant impact.
However, the presence of strong support does not guarantee that quotes will head towards this level. Growth may continue without a break.
Quick NQ Assessment- Do we remain BullishThinking of a possible trend shift.
Added my thoughts to this video mostly to show myself what I missed today
CME_MINI:NQ1!

Market Profile vs Volume Profile: Which one is a better tool?There is an ongoing discussion within the trading community about which tool is better for analyzing market behavior: Market Profile (MP) or Volume Profile (VP). The former was popularized by Jim Dalton in his book "Mind Over Markets," while the latter has many advocates as well, including Peter Reznicek (aka ShadowTrader). With the release of the new "Time Price Opportunities" (TPO) indicator by TradingView, we can now closely examine the disparities between the two and explore which one works better.
For starters, I won't delve into explaining what Market Profile is and all its related artifacts (e.g., TPO, single-prints, poor high/low, etc.). TradingView has done a commendable job explaining key concepts in the indicator description. For those seeking more, Jim Dalton's "Markets in Profile" is a recommended resource, an easier and more up to date reading than the original book. Additionally, there are numerous free webinars available on YouTube.
Both MP and VP serve similar purposes:
1. Assess day character by analyzing shape of intraday distribution (price-time/price-volume)
2. Identify important levels that are not visible on the standard bar chart (VAH, VAL, POC)
3. Spot structural weaknesses and anomalies.
The key difference is in the basic building block: Market Profile uses time at certain price level whereas Volume Profile uses volume.
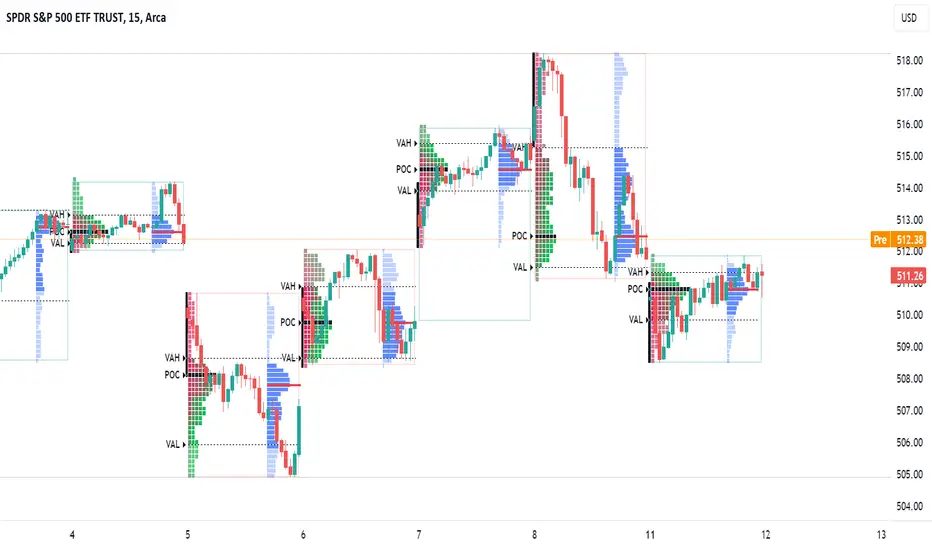
Let’s look at AMEX:SPY chart to explore the differences
What stands out is that intraday distributions are nearly identical. There are slight differences in key levels (VAH, VAL, POC) but they are negligible. Note how on Wednesday, the price first retests Tuesday's VAH, then Monday's VAL, then again Tuesday's VAH. After confirming support, it rallies up the next day.
From the perspective of the stated goals, we can efficiently achieve the first two, regardless of the tool we use. The third goal is a bit tricky and requries a seperate long discussion. So I won't dwell on it here
In overall, we can see that Market and Volume profiles are pretty much alike and it doesn’t make much difference which one you’ll be using.
Or does it? So far, we looked at the regular hours chart (RTH). What about futures and similar instruments that trade 24 hours? Let's look at CME_MINI:NQ1! chart
Here, the difference in distributions and levels is much more pronounced. The best example is Friday where not only POCs are completely misaligned but even the shapes of distribution (MP is more like a bullish p-shape, whereas VP is a bearish trend day).
The disparity in distributions is explained by the difference in volume traded during regular hours (high volume) and extended hours (low volume). Due to this asymmetry, Volume Profile is always heavily skewed towards RTH. Meanwhile, Market Profile is session-neutral, giving the same weight to overnight and regular hours TPOs.
Understanding of disparity doesn’t answer question of which tool is better. For example, when it comes to key levels, price sometimes respects MP levels and sometimes VP ones. My take is that we need to pay attention to both when they are pronounced. Good example is Tuesday’s prominent MP POC. Although it was built up overnight on low volume, it was revisited the day after and acted as resistance.
To conclude:
For tickets that trade primarily in the regular session (or if you look on RTH session chart only) there is no difference whether to use Market or Volume profile. Both provide same information. (note that volume data on lower timeframes depends on your broker and/or whether you buy real-time data from exchange; reliability of volume data is a separate discussion topic).
If you’re trading 24h instruments I find more useful using MP as it can give important information about non-regular low-volume sessions. For RTH, it will still give the same results as VP. You can also use a combination of two but then you’ll face a challenge of reconciling difference in distribution shape (like the Friday example). As there is no clear answer how to do it, I recommend sticking to one tool at a time.
P.S. I have not done any research on very low timeframe (<5m) for intraday accumulations/distributions. As MP was originally developed to analyze day character (Jim Dalton suggests using 30m TPO) it might not be well suited for lower timeframes (e.g. if you trade within 1h range), and this is the area where VP has advantage. Another point to consider is that currently TradingView provides a wider range of VP tools, incl fixed range, anchored, etc…
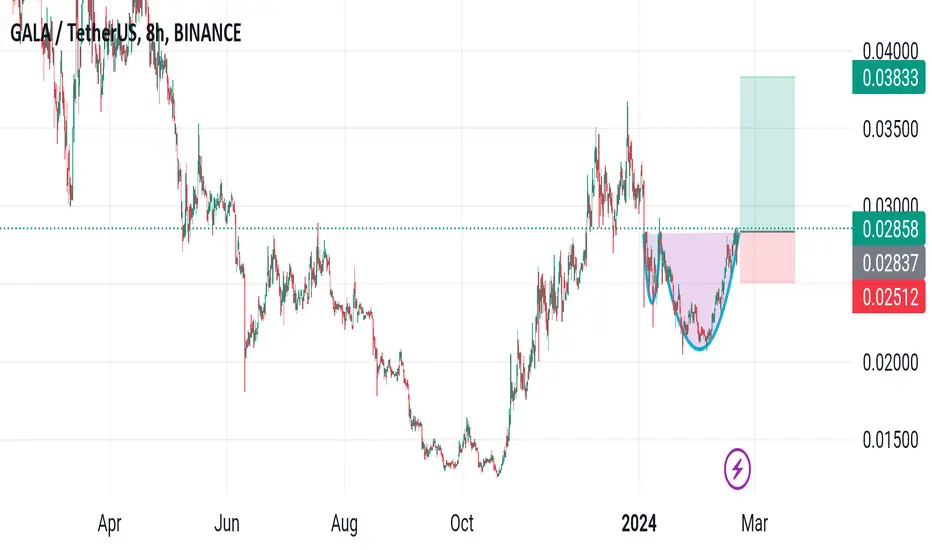
GALAUSDT CUP HANDLE??!
As seen in the chart, the cup formation appears. I expect an increase in the direction I specified as long as the market allows it.
note to myself!
Options Blueprint Series: The Covered Call Strategy DecodedIntroduction
In the ever-evolving world of financial markets, savvy investors and traders continuously seek strategies to optimize returns while managing risk. Among the plethora of strategies available, the covered call stands out for its simplicity and efficacy, especially when applied to a dynamic asset like Euro Futures. This article delves deep into the intricacies of the covered call strategy, using Euro Futures as the underlying asset. Through this exploration, we aim to equip you with the knowledge and tools necessary to navigate the complexities of the futures and options markets. By the end of this journey, you'll gain a comprehensive understanding of how to implement covered calls with Euro Futures, enhancing your trading arsenal with a strategy that balances potential returns against the inherent risks of the forex futures market.
Understanding Euro Futures: The Beacon of Currency Markets
Euro Futures on the Chicago Mercantile Exchange (CME) represent a contract for the future delivery of the Euro against the US dollar. These futures are pivotal for traders and investors looking to hedge against currency risk or to speculate on the fluctuations of the Euro's value relative to the dollar. Each Euro Futures contract is standardized, with each contract representing a specific amount of Euros.
Trading Euro Futures offers a transparent, regulated market environment with deep liquidity, making it an attractive instrument for a broad spectrum of market participants. The futures are marked-to-market daily, and gains or losses are credited or debited from the trader's account, providing a clear view of financial exposure.
Key Features of Euro Futures:
Contract Size: Each contract represents 125,000 Euros.
Tick Size: The minimum price fluctuation is $ 0.000050 per Euro, equating to $6.25 per contract.
Trading Hours: Euro Futures markets are accessible nearly 24 hours a day, allowing traders from around the globe to react to market-moving news and events in real-time.
Leverage: Futures trading involves leverage, allowing traders to control a large contract value with a relatively small amount of capital. However, while leverage can amplify gains, it also increases the potential for losses.
Market Participants:
Hedgers: Corporations and financial institutions may use Euro Futures to protect against adverse movements in the Euro's exchange rate, securing pricing or costs for future transactions.
Speculators: Individual and institutional traders may speculate on the future direction of the Euro's value against the dollar, aiming to profit from price movements.
Importance in the Financial Landscape: The Euro is the second most traded currency in the world, making Euro Futures a critical tool for managing currency exposure in the international financial markets. The contracts provide a gauge of market sentiment towards the Eurozone's economic outlook, influenced by factors such as interest rate differentials, political stability, and economic performance.
The Basics of Covered Calls: Charting a Course
The covered call is a conservative strategy where the trader owns the underlying asset — in this case, Euro Futures — and sells call options on that same asset to generate income from the option premiums. This strategy is particularly appealing in flat to moderately bullish market conditions because it allows the trader to earn an income from the premium, which can provide a cushion against a downturn in the market and potentially enhance returns in a stagnant or slightly bullish market.
Key Concepts of Covered Calls:
Ownership: The trader must own the Euro Futures contracts or be long on a futures position to write (sell) a covered call.
Option Premium: The income received from selling the call option. This premium is the trader's to keep, regardless of the option's outcome.
Strike Price: The price at which the underlying futures can be bought (call) by the option buyer. The trader selects a strike price that reflects their expectation of the market direction and their willingness to part with the futures if the option is exercised.
Expiration Date: All options have an expiration date. The covered call strategy involves choosing an expiration date that balances the desire for premium income with the market outlook.
Implementing the Strategy:
Selection of Euro Futures Contracts: The first step is to have a long position in Euro Futures. This position is the "cover" in the covered call strategy.
Selling the Call Option: The trader then sells a call option on the Euro Futures they own, receiving the option premium upfront. This option is sold with a specific strike price and expiration date in mind.
Outcome Scenarios:
If the Euro Futures price stays below the strike price at expiration, the call option will likely expire worthless, allowing the trader to keep the premium as income while still holding the futures position.
If the Euro Futures price rises above the strike price, the call option may be exercised by the buyer, requiring the trader to sell the futures at the agreed strike price. This caps the trader's upside potential but secures the premium as profit.
Risk Profile Graphic for the Covered Call Strategy on Euro Futures:
This graph illustrates the profit and loss potential of a covered call strategy applied to Euro Futures. The strategy involves holding a long position in Euro Futures while selling a call option at a specific strike price. If the Euro Futures price at expiration is below the strike price, the trader's loss is offset by the premium received from selling the call option. However, the profit potential is capped if Euro Futures rise above the strike price, as the trader may have to deliver the futures at the strike price, missing out on further gains.
Implied Volatility and CVOL: A Navigator's Tool
In the strategy of covered calls, understanding Implied Volatility (IV) is essential. IV reflects the market's expectation of a security's price fluctuation and significantly influences option premiums. For traders employing covered calls, especially with Euro Futures, high IV can mean higher premiums, offering better income potential or protection against the underlying asset's price movements.
Since the Euro Futures is a CME product, examining CVOL could provide an advantage to the trader as CVOL is a comprehensive measure of 30-day expected volatility from tradable options on futures which can help to:
Determining Premiums: By gauging current IV, traders can identify optimal premium levels for their call options.
Deciding which Strategy to use: High IV periods might indicate advantageous times to implement covered calls, leveraging CVOL's insights for timing entry and exit points.
Benefits and Risks of Covered Calls:
Income Generation: The most apparent benefit of the covered call strategy is the ability to generate income through the premiums received from selling call options.
Downside Protection: The premium received can offer some “protection” against a decline in the futures price, effectively lowering the break-even point.
Profit Limitation: A significant risk of this strategy is that the trader's profit potential on the futures is capped. If the market rallies strongly beyond the strike price, the trader misses out on those additional gains, as they are obligated to sell the futures at the strike price.
Initiating a Covered Call with Euro Futures: Setting Sail
Implementing the covered call strategy with Euro Futures involves a blend of strategic foresight and meticulous planning. The objective is to enhance potential returns or protect against downside risk through the calculated sale of call options against a long Euro Futures position. Here's a step-by-step guide to navigate through the process:
Step 1: Selection of Euro Futures Contracts
Long Position Establishment: Begin by establishing a long position in Euro Futures. This position acts as your safety net, providing the necessary coverage for the call options you're about to sell.
Margin: When going long Euro Futures, the Margin Requirement (suggested by CME on Feb-21 2024 is USD 2,100 per contract)
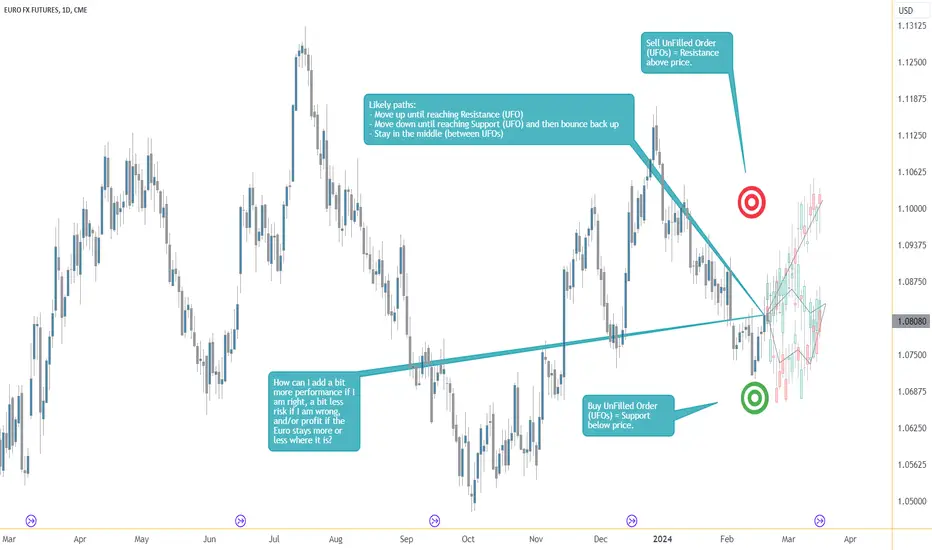
Market Analysis: Conduct a thorough analysis of the Euro Futures market. Consider factors like historical volatility, economic indicators affecting the Eurozone, and any impending events that might influence the Euro's value against the dollar. The chart shows how careful key Support and Resistances have been selected in order to decide when to buy long Euro Futures as well as deciding the Call Strike Price to use. Other techniques can be employed depending on the trader’s plan and methods.
Step 2: Selling the Call Option
Strike Price Decision: Choose a strike price that aligns with your market outlook. A strike price above the current market price can offer potential for capital appreciation, plus the income from the premium. Since the Resistance is located around 1.10, selling the 1.10 Call could be an appropriate decision.
Expiration Date Selection: The expiration date should reflect your market perspective and risk tolerance. Shorter-term options can provide more frequent income opportunities but require closer management. We will be using December 2024 in this educational idea.
Premium: When selling a 1.10 Call using DEC24 expiration on Feb-21 2024, the premium collected would be between 0.02180 and 0.02280. The midpoint being 0.0223 and the contract size being USD 125,000, this means we would collect USD 2787.5 in premium, which would either add to the profit or subtract from risk.
Step 3: Managing the Trade
Monitoring Market Movements: Keep a vigilant eye on market trends and Euro Futures price movements. Be prepared to adjust your strategy in response to significant changes.
Adjustment Strategies: If the market moves unfavorably, consider rolling out the option to a further expiration date or adjusting the strike price to manage risk effectively.
Case Study: A Voyage on Euro Seas
Let's illustrate this strategy with a hypothetical trader, Elena. Elena holds a long position in Euro Futures, expecting slight bullish momentum in the upcoming months. To capitalize on this and earn additional income, she sells call options with a strike price slightly above the current futures price, receiving an upfront premium.
As the market progresses, two scenarios unfold:
Bullish Outcome: The Euro strengthens, but not enough to reach the strike price. Elena retains her futures position, benefits from its appreciation, and keeps the premium from the call options.
Bearish Downturn: The Euro weakens. The premium received provides a cushion against the loss in her futures position's value, mitigating her overall risk.
Risk Management: Navigating Through Storms
Implementing covered calls doesn't eliminate risk but redistributes it. Effective risk management is crucial:
Use of Stop-Loss Orders: These can limit potential losses on the futures position if the market moves against your expectations.
Position Sizing: Ensure your position size in Euro Futures aligns with your overall risk management strategy, avoiding overexposure to a single trade.
Diversification: Consider diversifying your strategies and holdings beyond just Euro Futures and covered calls to mitigate systemic risks.
Conclusion: Docking at Safe Harbors
The covered call strategy, when applied to Euro Futures, offers traders an efficient way to navigate the forex futures market. By generating income through premiums and potentially benefiting from futures price movements, traders can strategically position themselves in varying market conditions.
However, the journey doesn't end here. Continuous learning, market analysis, and strategy adjustments are paramount to sailing successfully in the dynamic waters of futures trading. As with all trading strategies, the covered call approach requires a balance of knowledge, risk management, and practical experience to master.
Embarking on this voyage with Euro Futures and covered calls can lead to rewarding destinations, provided you navigate with caution, preparation, and an eye towards the horizon of market opportunities and challenges.
When charting futures, the data provided could be delayed. Traders working with the ticker symbols discussed in this idea may prefer to use CME Group real-time data plan on TradingView: tradingview.sweetlogin.com This consideration is particularly important for shorter-term traders, whereas it may be less critical for those focused on longer-term trading strategies.
General Disclaimer:
The trade ideas presented herein are solely for illustrative purposes forming a part of a case study intended to demonstrate key principles in risk management within the context of the specific market scenarios discussed. These ideas are not to be interpreted as investment recommendations or financial advice. They do not endorse or promote any specific trading strategies, financial products, or services. The information provided is based on data believed to be reliable; however, its accuracy or completeness cannot be guaranteed. Trading in financial markets involves risks, including the potential loss of principal. Each individual should conduct their own research and consult with professional financial advisors before making any investment decisions. The author or publisher of this content bears no responsibility for any actions taken based on the information provided or for any resultant financial or other losses.
F&O MasalaF&O Masala -
New Series - In this F&O Masala Series, I would like to share some good potential scrips.
Remember- this is for Educational Purpose & NOT a Buy or Sell Call.
Do you own Research (DYOR) before indulging into Buying/Selling.
