DIYWallSt Trade Journal: How I Navigated Powell Firing Rumors & 07/16/25 Trade Journal, and ES_F Stock Market analysis
EOD accountability report: +428.75
Sleep: 7 hours
Overall health: Good
VX Algo System Signals from (9:30am to 2pm)
— 4:17 AM Market Structure flipped bullish
— 9:50 AM Market Structure flipped bearish
— 12:00 PM VXAlgo NQ X3 Buy Signal
— 1:02 PMMarket Structure flipped bullish
What’s are some news or takeaway from today? and What major news or event impacted the market today?
Today was a crazy trading day with a bunch of wild moves because Trump said they were going to fire Powell and then cancelled the threat.
Overall health and sleep have been good this week and our trading balance is reflecting that.
News
— 10:30 AM *SCOTT BESSENT: “FORMAL PROCESS” TO REPLACE FED CHAIR POWELL UNDERWAY
— 12:11 PM
*TRUMP ASKED IF HE WILL FIRE POWELL: NOT PLANNING ON DOING ANYTHING
What are the critical support levels to watch?
--> Above 6290= Bullish, Under 6280= Bearish
Video Recaps -->https://tradingview.sweetlogin.com/u/WallSt007/#published-charts
Futurestrading


Could OIL Slide to $60? a 5% Drop Might Be on the Table? Hey Realistic Traders!
Price action is weakening. Will USOIL find support or slide further?
Let’s Break It Down..
On the 4H timeframe, oil has formed a double top pattern followed by a neckline breakout, which is a classic sign of a potential shift from a bullish to a bearish trend.
This breakout was confirmed by a break below the bullish trendline, accompanied by consecutive bearish full-body candlesticks that reinforce the bearish momentum. Afterward, the price formed a bearish continuation pattern known as a rising wedge, which was followed by a breakdown.
The combination of bearish reversal and continuation pattern breakouts signals further downside movement and confirms the shift into a bearish trend.
Therefore, we foresee the price forming lower lows and lower highs toward the first target at 63.21, with a potential extension to the close the gap at 60.73.
The bearish outlook remains valid as long as the price stays below the key stop-loss level at 69.66.
Support the channel by engaging with the content, using the rocket button, and sharing your opinions in the comments below.
Disclaimer: This analysis is for educational purposes only and should not be considered a recommendation to take a long or short position on USOIL.

Trading Day SummaryTrading Day Summary
Today wasn’t a winning day on the books, but it was a major win in discipline.
I hit my daily loss limit before 10 AM, stopped live trading, and switched over to paper trades to protect my capital.
The setups I took—especially in Gold and Euro—lacked full confirmation, and one overnight trade didn’t align with my plan.
I experienced around $200 in slippage, which added to the loss.
The bright side? I stayed in control. No revenge trades. No emotional spirals.
My paper trade afterward was textbook—5R+ potential. That tells me the strategy is sound. Execution and timing just need to be sharper.
Bottom line: this is a marathon, not a sprint. I’m proud of the discipline and the mindset. Tomorrow, we reset and refocus.

Mid-Session Market ReviewMid-Session Market Review
S&P 500: After some initial volatility from the 8:30 news, the market accepted above the prior day’s levels but has since pulled back within range, consolidating just below the highs.
NASDAQ: The NASDAQ remains above all of yesterday’s levels and is currently balancing between the high of the day and the 23,100 level, showing a rotational pattern.
Russell 2000: This market is rotational within the prior day’s range and has accepted below the CVA and PVA. Potential trade opportunities might come with a pullback to the 2,245 area.
Gold: Gold has accepted below the prior value area and is still rotational within the CVA. Trade opportunities could present themselves near the prior day’s low.
Crude Oil: The market is quite choppy, hovering around the prior day’s low and value area low. Caution is advised, with potential long opportunities on a pullback, as long as conditions align.
Euro Dollar: The Euro is dropping significantly, moving below all key levels without much respect for them. This could provide short opportunities if there’s a pullback.
Yen: Similar to the Euro, the Yen is also pushing below previous levels. It’s getting choppy near the CVA low, so caution is needed until it shows more respect for those levels.
Natural Gas: The market is rotational within the prior day’s range and respecting the CVA high. Long opportunities might be possible if conditions are right.
Aussie Dollar: It’s showing some respect for the CVA low and is still rotational. There could be a potential long setup forming, depending on how it plays out.
British Pound: The Pound has accepted below all key levels, and a pullback to the CVA low might provide short opportunities, though caution is needed around the VWAP.

DIYWallSt Trade Journal:The Importance of Your First Trade **07/14/25 Trade Journal, and ES_F Stock Market analysis **
EOD accountability report: +158.75
Sleep: 7 hours
Overall health: Good
** VX Algo System Signals from (9:30am to 2pm) **
— 8:00 AM Market Structure flipped bullish on VX Algo X3!
— 10:30 AM VXAlgo NQ X1DD Buy Signal
— 11:50 AM VXAlgo ES X1 Sell Signal
— 1:00 PM VXAlgo NQ X1DD Buy Signal
**What’s are some news or takeaway from today? and What major news or event impacted the market today? **
I need to really be careful with my first trade and making sure it is a high probability trade, otherwise a bad early start is likely to ruin my whole day.
News
— 1:42 PM *TRUMP TO UNVEIL $70 BILLION IN AI AND ENERGY INVESTMENTS
— 4:08 PM *S&P 500 ENDS HIGHER AS STOCKS RISE AFTER TRUMP SAYS OPEN TO DEALS ON TARIFFS
**What are the critical support levels to watch?**
--> Above 6295= Bullish, Under 6285= Bearish
Video Recaps -->https://tradingview.sweetlogin.com/u/WallSt007/#published-charts

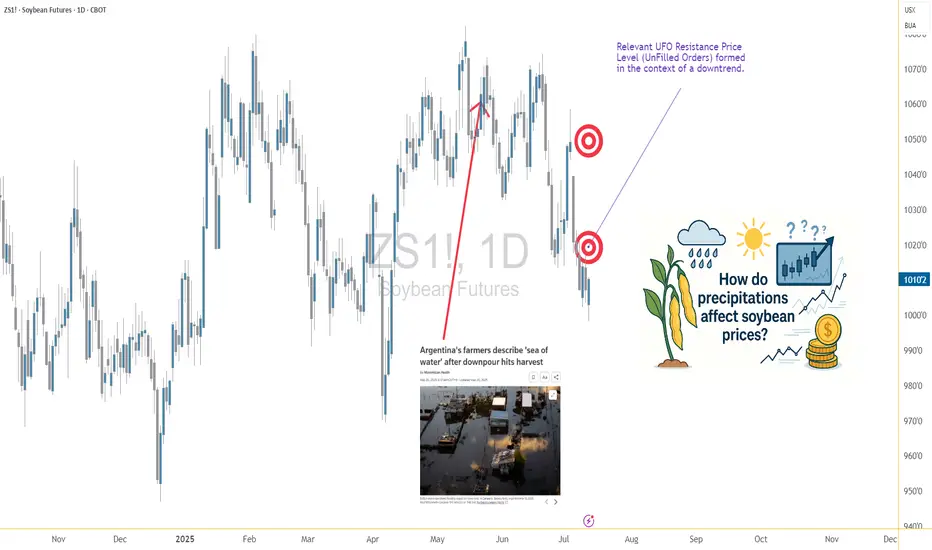
Soybeans and Rain: Moisture’s Market Impact on the Bean Trade1. Introduction: Moisture & Market Momentum
Soybeans, often referred to as “the oilseed king,” are a cornerstone of global agriculture. As a leading source of protein for both humans and animals, their price fluctuations affect industries ranging from food production to biofuels. One key variable traders often monitor? Rainfall. 🌧️
Moisture plays a critical role in soybean development, influencing yield and quality from the moment the seed is sown. It’s no surprise that many market participants assume a strong correlation between rainfall and price behavior. But is that assumption truly supported by data?
In this article, we analyze how varying precipitation levels impact weekly soybean futures returns. As you'll see, the results might not be as clear-cut as you’d expect—but they still offer meaningful insights.
2. Biological Realities: Soybeans’ Water Needs
Soybeans thrive under specific conditions. While they’re generally resilient, rainfall—or the lack thereof—can tip the balance between bumper harvests and disappointing yields.
During early vegetative stages, sufficient moisture ensures healthy root development. Later, during the pod-fill phase, rainfall becomes even more essential. Too little water at this point leads to incomplete pods or aborted seeds. On the flip side, too much rain can invite fungal diseases and delay harvests, especially in lower-lying regions.
In countries like Brazil and Argentina, soybean fields often face seasonal extremes, while the U.S. Midwest typically enjoys more consistent conditions—though droughts and floods have both hit the Corn Belt in recent years. These environmental realities create natural volatility in both yield and pricing expectations.
3. Methodology: How We Analyzed Weather vs. Futures
To explore the potential connection between rainfall and soybean futures prices, we collected weekly weather data for major soybean-growing cities across the globe. Each week’s precipitation was categorized using a normalized percentile system:
Low Rainfall: below the 25th percentile
Normal Rainfall: between the 25th and 75th percentiles
High Rainfall: above the 75th percentile
We then matched this data against weekly returns of standard soybean futures (ZS) and micro soybean futures (MZS), both traded on the CME Group.
This allowed us to compare average price behavior in different rainfall scenarios—and test whether there was any statistically significant difference between dry and wet weeks.
4. Statistical Findings: Is There a Signal in the Noise?
When examining the data, the initial visual impression from boxplots was underwhelming—return distributions across rainfall categories looked surprisingly similar. However, a deeper dive showed that the difference in mean returns between low and high precipitation weeks was statistically significant, with a p-value around 0.0013.
What does that mean for traders? While the signal may not be obvious to the naked eye, statistically, rainfall extremes do impact market behavior. However, the magnitude of impact remains modest—enough to be part of your strategy but not enough to drive decisions in isolation.
Soybean prices appear to be influenced by a mosaic of factors, with precipitation being just one tile in that complex picture.
5. Charting the Relationship: Visual Evidence
While statistical tests gave us the green light on significance, we know traders love to “see” the story too. Boxplots of weekly soybean futures returns segmented by rainfall categories offered a subtle narrative:
Low-precipitation weeks showed slightly higher average returns and tighter interquartile ranges.
High-precipitation weeks had broader return distributions and more frequent downside outliers.
Normal weeks exhibited relatively stable behavior, reinforcing the idea that the market reacts most during extremes.
This kind of visualization may not scream alpha at first glance, but it reinforces the idea that precipitation events—particularly dry spells—tend to nudge prices upward, possibly as market participants price in production risk.
6. Trading Implications: Positioning Around Weather
Here’s where things get practical. While weather alone won’t dictate every trading decision, it can be a key filter in a broader strategy. For soybean traders, rainfall data can help inform:
Bias assessment: Low-precipitation weeks may suggest bullish tendencies.
Risk control: Expect wider return distributions in high-precip weeks—adjust stops or contract sizing accordingly.
Event trading: Pair weather anomalies with technical signals like trendline breaks or volume surges for potential setups.
It’s also worth noting that weekly weather forecasts from reputable sources can serve as a forward-looking indicator, giving traders a head start before the market fully reacts.
7. Margin Efficiency with Micro Soybeans
For traders looking to scale into soybean exposure without the capital intensity of full contracts, the CME Group’s micro-sized futures offer a compelling alternative.
📌 Contract Specs for Soybean Futures (ZS):
Symbol: ZS
Contract size: 5,000 bushels
Tick size: 1/4 of one cent (0.0025) per bushel = $12.50
Initial margin: ~$2,100 (varies by broker and volatility)
📌 Micro Soybean Futures (MZS):
Symbol: MZS
Contract size: 500 bushels
Tick size: 0.0050 per bushel = $2.50
Initial margin: ~$210
These smaller contracts are perfect for strategy testing, risk scaling, or layering exposure around key macro events like WASDE reports or weather disruptions. For traders aiming to build weather-aligned positions, MZS is a powerful tool to balance conviction with capital efficiency.
8. Wrapping It All Together
Rain matters. Not just in fields, but in futures prices too. While soybean markets may not overreact to every drizzle or downpour, extreme rainfall conditions—especially drought—can leave noticeable footprints on price action.
For traders, this means opportunity. By incorporating precipitation metrics into your workflow, you unlock a new layer of context. One that doesn’t replace technical or fundamental analysis, but enhances both.
And remember: this article is just one piece of a larger exploration into how weather affects the commodity markets. Make sure you also read prior installments.
When charting futures, the data provided could be delayed. Traders working with the ticker symbols discussed in this idea may prefer to use CME Group real-time data plan on TradingView: tradingview.sweetlogin.com - This consideration is particularly important for shorter-term traders, whereas it may be less critical for those focused on longer-term trading strategies.
General Disclaimer:
The trade ideas presented herein are solely for illustrative purposes forming a part of a case study intended to demonstrate key principles in risk management within the context of the specific market scenarios discussed. These ideas are not to be interpreted as investment recommendations or financial advice. They do not endorse or promote any specific trading strategies, financial products, or services. The information provided is based on data believed to be reliable; however, its accuracy or completeness cannot be guaranteed. Trading in financial markets involves risks, including the potential loss of principal. Each individual should conduct their own research and consult with professional financial advisors before making any investment decisions. The author or publisher of this content bears no responsibility for any actions taken based on the information provided or for any resultant financial or other losses.
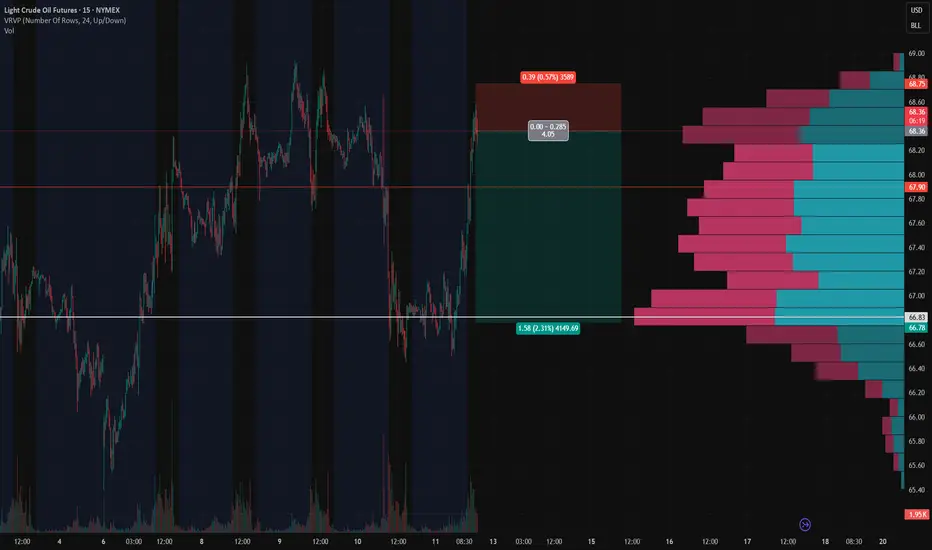
CL1! Short Setup – Fading Into Volume Shelf📉 CL1! Short Setup – Fading Into Volume Shelf
🔹 Context:
Price just tapped into a heavy upper volume shelf (68.35–68.50) — the exact area where the prior breakdown started. This zone aligns with rejection highs and the upper edge of the VRVP profile.
📌 Setup Logic:
🔺 Entry: 68.36–68.50 (into supply zone)
⛔ Stop: 68.75 (above liquidity peak)
🎯 Target: 66.78 (prior demand + volume node)
📐 RRR: ~4.0:1
⚠️ Trigger: Do not enter early — wait for rollover of price which it looks like we are getting now.
📊 Why It Matters:
📈 VRVP shows clear upper and lower volume shelves
📛 Price has overextended into a prior rejection zone
🔁 Potential for a mean-reversion leg once we confirm momentum breakdown
📷 See attached chart for full zone layout
🧠 Let me know if you’re entering or watching this one 👇
#CrudeOil #CL1 #FuturesTrading #VolumeProfile #SciQua #OrderFlow
Kiwi on the Edge: Sell the Bounce Below 0.6080Among major currencies, the New Zealand Dollar (NZD) is often viewed as peripheral in global capital flows. Yet it consistently ranks among the world’s top 10 most traded currencies. Its relevance stems from New Zealand’s strong exposure to international trade, especially with China and Australia, and an economy heavily reliant on commodity exports. As a result, the NZD is classified as a "pro-risk" currency, highly sensitive to global cyclical dynamics, interest rate differentials, and Asian demand. It also maintains a strong correlation with the Australian Dollar (AUD), due to similar macroeconomic drivers and trade linkages.
In the FX community, the NZD is often affectionately referred to as the "Kiwi," a nod to the iconic flightless bird native to New Zealand and depicted on the country’s coins. Despite being a smaller player on the geopolitical scene, New Zealand’s currency frequently presents appealing opportunities for FX traders, particularly in times of shifting risk sentiment or commodity market volatility.
With the Reserve Bank of New Zealand (RBNZ) having just announced its latest policy decision, it’s time to reassess the Kiwi’s fundamental landscape, technical backdrop, and market sentiment to refine our directional trading outlook.
Fundamental Outlook: RBNZ holds rates, but easing bias remains
As widely expected, the RBNZ held its Official Cash Rate (OCR) steady at 3.25% during its July 9 policy meeting. This pause comes after an aggressive easing cycle that saw the OCR lowered by 225 basis points since August 2024. The move reflects the central bank’s aim to stabilize inflation without undermining the fragile recovery.
The tone of the accompanying statement remains dovish. Policymakers clearly left the door open for further rate cuts later in the year, conditional on continued disinflation and signs of weaker demand. For now, however, inflation is running at a comfortable 2.5% year-over-year, right in the middle of the RBNZ’s 1–3% target band. Meanwhile, the economy has shown some resilience: Q1 2025 GDP posted a quarterly gain of +0.8%, confirming a technical exit from the recession experienced in 2024.
Nonetheless, external headwinds remain a concern. Sluggish data from China (New Zealand’s largest trading partner) continue to cast a shadow over the medium-term outlook. Slower Chinese demand for dairy and meat exports, as well as raw materials, could limit the momentum of New Zealand’s recovery, thereby reinforcing the need for accommodative policy.
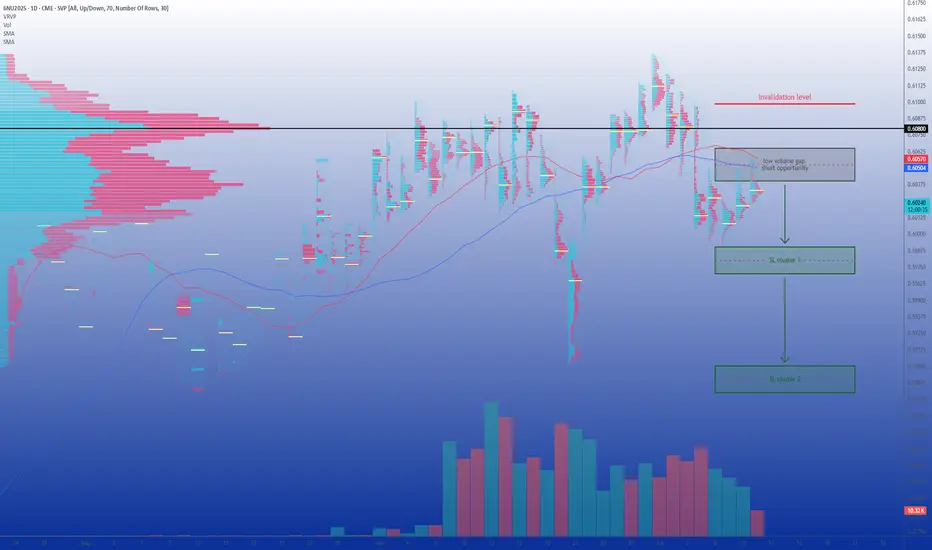
Technical Analysis: Key resistance near 0.6080
Technically, the picture has deteriorated significantly on the 6NU2025 contract since Monday, with a sharp downside acceleration toward the psychological 0.60 level. Price is still hovering around this threshold.
Volume profile analysis reveals a clear liquidity gap between 0.6040 and 0.6065, a zone that could be filled before any new directional move unfolds. Just above, a major congestion area emerges around 0.6080, where the point of control (POC) is located. This area represents a key short-term pivot and a potential resistance level, especially as it also sits just above the 10- and 20-day simple moving averages.
As long as price remains capped beneath 0.6080, the bias remains moderately bearish. A rejection in the 0.6060–0.6080 area would confirm resistance and suggest renewed downside risk. However, a decisive daily close above 0.6100 would invalidate the bearish scenario and open the door toward 0.6150 and possibly above. In the near term, the setup favors a cautious bearish stance, but timing remains critical.
Sentiment and Positioning: Retail crowded longs raise red flags
Commitment of Traders (COT) data provides additional context. As of the latest report, non-commercial speculators hold a net long position of approximately +4,150 contracts in the 6N futures. This moderately bullish stance likely reflects the unwinding of prior bearish bets in response to the sustained weakness of the US dollar over the past quarter. Meanwhile, commercial hedgers, typically exporters and importers, remain net short, which is structurally consistent with hedging flows rather than directional speculation.
From a retail perspective, the sentiment skew is more concerning. Aggregated positioning data across FX/CFD brokers shows that nearly 60% of retail traders are long NZD/USD. Some platforms report even more extreme figures, with bullish retail exposure above 80%. Historically, such one-sided positioning often foreshadows downside risk, especially if stop losses are triggered en masse below recent support levels.
Volatility conditions also merit attention. The VIX, Wall Street’s fear index, remains near its annual lows, suggesting a market backdrop of complacency. While this environment typically supports pro-risk currencies like the NZD, the fact that the S&P 500 just notched fresh all-time highs raises the possibility of profit-taking or corrective flows, potentially weighing on risk-correlated assets in the short term.
Trade Idea: Sell the rally toward 0.6060–0.6080
Given the current macro setup, sentiment profile, and technical resistance overhead, a sell-the-bounce approach appears tactically appropriate. We propose the following directional futures trade on the September contract (6NU2025):
Entry Point: Short at 0.6060, to take advantage of a potential fill of the low-volume gap
Stop Loss: 0.6100 on a daily close basis, just above the POC and confluence resistance
Target 1: 0.5985, below the recent swing low
Target 2 (extended): 0.5890, just under the June 23 bottom
This setup aims to capture a continuation of the downtrend that began in early July. It relies on disciplined risk management and realistic target zones, while respecting key technical structures and the crowded long positioning among retail traders. The strategy will be invalidated if prices manage to close above 0.6100 on a daily basis, signaling a shift in near-term momentum.
---
When charting futures, the data provided could be delayed. Traders working with the ticker symbols discussed in this idea may prefer to use CME Group real-time data plan on TradingView: tradingview.com/cme/.
This consideration is particularly important for shorter-term traders, whereas it may be less critical for those focused on longer-term trading strategies.
General Disclaimer:
The trade ideas presented herein are solely for illustrative purposes forming a part of a case study intended to demonstrate key principles in risk management within the context of the specific market scenarios discussed. These ideas are not to be interpreted as investment recommendations or financial advice. They do not endorse or promote any specific trading strategies, financial products, or services. The information provided is based on data believed to be reliable; however, its accuracy or completeness cannot be guaranteed. Trading in financial markets involves risks, including the potential loss of principal. Each individual should conduct their own research and consult with professional financial advisors before making any investment decisions. The author or publisher of this content bears no responsibility for any actions taken based on the information provided or for any resultant financial or other losses.
Crude Oil Trade Idea: Intraday mechanicsNYMEX:CL1! NYMEX:MCL1!
Bigger Picture:
Traders should note that news headlines do not always drive the price action. More often, news outlets look for narrative to align with the price action.
Previously, it was about the supply glut and worsening demand due to an uncertain outlook. Now the latest news flow is about Aramco OSP rising, OPEC+ adding another 548K bpd in August — higher than anticipated 411K — of the wounding of involuntary cuts. News outlets now view this as signs of demand growth and low inventories.
What has the market done?
Market has consolidated, building acceptance around microComposite Volume Point of Control at 65.50 (mcVPOC). Market then broke out of this balance.
What is it trying to do?
Market is building value higher; 2-day mcVPOC is at 68.29.
How good of a job is it doing?
Market is holding support and has tested resistance multiple times. It has also held support.
What is more likely to happen from here?
Further movement higher as long as it holds above support and yearly open confluence in the short term.
Key Levels:
• Resistance zone: 68.95 - 68.85
• pHi: 68.87
• 2-day VPOC: 68.29
• pSettlement: 68.38
• yOpen: 67.65
• Support zone: 67.70 - 67.50
• pLow: 67.89
Primary Scenario:
Crude oil pit session begins with open auction in yesterday’s range. Prices move lower to test prior day's low, 2-day balance support in confluence with yearly open. Prices push back higher towards yesterday's settlement and 2-day Volume Point of Control (VPOC) at 68.33.
Secondary Scenario:
Crude oil pit session begins with open auction in yesterday’s range. Market consolidates and chops around pSettlement and 2-day VPOC. Market takes out overnight high, fails to go further higher, and reverts lower. Settles below overnight low, however staying above prior low to continue one-time framing higher for the regular trading hours (RTH).

DIYWallSt Trade Journal: Starting Down $400 & Patience Pays Off 07/09/25 Trade Journal, and ES_F Stock Market analysis
EOD accountability report: -271
Sleep: 4.5 hours
Overall health: Good
VX Algo System Signals from (9:30am to 2pm) 4/4 success
10:00 AM VXAlgo ES X1 Sell Signal
10:36 AM VXAlgo ES X3 Sell Signal
11:00 AM Market Structure flipped bearish on VX Algo X3!
1:33 PM Market Structure flipped bullish on VX Algo X3!
What’s are some news or takeaway from today? and What major news or event impacted the market today?
I took some short positions overnight and got caught in the big push up this morning and started the day with -400, I was very tempted to go big and tried to trade it back but decided it was better off just to wait for a better day to recover the account instead.
Consider yesterday was a big manipulation day and today was another one but squeezing to the upside for a rug pull downwards.
News
*(US) FOMC JUN MINUTES: COUPLE OF PARTICIPANTS NOTED THEY WOULD BE OPEN TO CONSIDERING A RATE CUT AS SOON AS THE JULY MEETING IF DATA EVOLVE AS THEY EXPECTED (Bowman and Waller have said as much since the FOMC meeting)
What are the critical support levels to watch?
--> Above 6290= Bullish, Under 6280= Bearish
Video Recaps -->https://tradingview.sweetlogin.com/u/WallSt007/#published-charts

How to Spot Flag Patterns on TradingViewLearn to identify and trade flag patterns in TradingView with this step-by-step tutorial from Optimus Futures. Flag patterns are continuation formations that help traders join existing trends by buying high and selling higher, or selling low and buying back lower.
What You'll Learn:
• How to identify bullish and bearish flag patterns on any timeframe
• Breaking down flag patterns into two parts: the flagpole and the flag
• Finding strong flagpole formations with fast, obvious price moves
• Spotting flag consolidation areas that form tight ranges
• Why flag patterns work: buyer and seller psychology explained
• Real chart examples showing how flag patterns develop and play out
This tutorial may help futures traders and technical analysts who want to trade with market trends rather than against them. The concepts covered could assist you in identifying opportunities to join strong price movements when they pause before continuing.
Learn more about futures trading with Tradingview: optimusfutures.com
Disclaimer:
There is a substantial risk of loss in futures trading. Past performance is not indicative of future results. Please trade only with risk capital. We are not responsible for any third-party links, comments, or content shared on TradingView. Any opinions, links, or messages posted by users on TradingView do not represent our views or recommendations. Please exercise your own judgment and due diligence when engaging with any external content or user commentary.
This video represents the opinion of Optimus Futures and is intended for educational purposes only. Chart interpretations are presented solely to illustrate objective technical concepts and should not be viewed as predictive of future market behavior. In our opinion, charts are analytical tools—not forecasting instruments. Market conditions are constantly evolving, and all trading decisions should be made independently, with careful consideration of individual risk tolerance and financial objectives.

07/08/25 Trade Journal, and ES_F Stock Market analysis EOD accountability report: +220
Sleep: 7 hours
Overall health: Good
VX Algo System Signals from (9:30am to 2pm) 4/4 success
— 9:30 AM Market Structure flipped bullish on VX Algo X3! :check:
— 10:30 AM VXAlgo NQ X1 Buy Signal :check:
— 12:24 PM Market Structure flipped bullish on VX Algo X3! :check:
— 1:30 PM Market Structure flipped bearish on VX Algo X3! :check:
What’s are some news or takeaway from today? and What major news or event impacted the market today?
After taking losses, I usually set a lock out on my account after $200 profit to build back small wins and confidence. so luckily I was locked out pretty early today and avoided most of the market whipsaw. But on days like these, if you don't walk away after you make money, you could eventually get triggered and tilted by the whipsaw. a lot of orb traders probably died today.
News
*HOWARD LUTNICK ON TARIFFS: EXPECT ANOTHER 15-20 LETTERS TO GO OUT OVER THE NEXT 2 DAYS- CNB
*Trump announces 50% tariff on copper imports, threatens 200% tariff on pharmaceuticals and maybe chips
What are the critical support levels to watch?
--> Above 6280= Bullish, Under 6260= Bearish
Video Recaps -->https://tradingview.sweetlogin.com/u/WallSt007/#published-charts

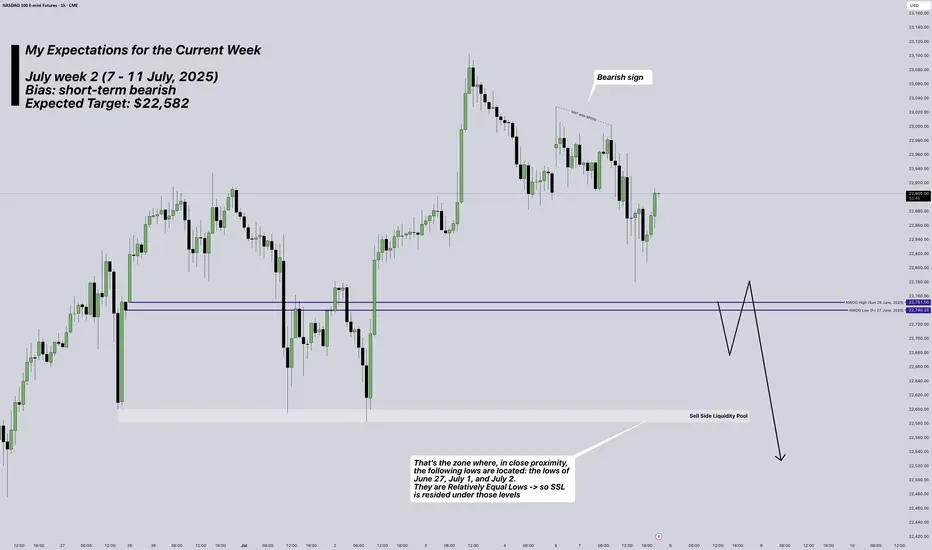
NASDAQ Futures: My Plan for current Week (7-11 July, 2025)Week: July 7–11, 2025
Instrument: NASDAQ Futures (NQ)
Trend: Overall, the market remains bullish, but for this week I anticipate a retracement targeting the $22,582 level.
Bias for the week: Bearish
Overview:
This week, I’m watching NQ for a potential move toward the $22,582 level. This expectation is based on how Thursday (July 3, 2025) played out—specifically the buy-side liquidity that was taken, and the clean sell-side liquidity pool left near $22,582.
I also find it notable how the NWOG (New Week Opening Gap) was opened and how price moved below it, which reinforces the short bias.
I would consider opening a short position once I see a confirmed 4H candle close below $22,760, otherwise no trades will be taken.
* Trade execution details will be published separately if my bias confirms.
* for more information -> review my notes on the chart
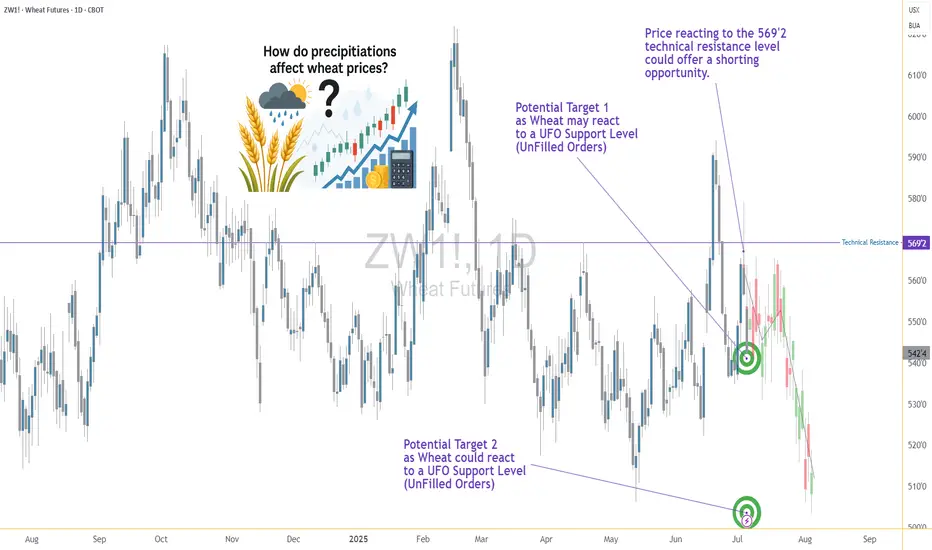
Rain or Ruin? Analyzing Wheat Prices During Precip Extremes1. Introduction: When Rain Means Risk for Wheat Traders
Rain is life for wheat crops—until it isn’t. In the world of agriculture, water is essential, but extremes in precipitation can cause just as much harm as droughts. For traders in the wheat futures market, understanding this relationship between rainfall and price action is not just useful—it’s essential.
Wheat is a crop with a long growth cycle, grown across diverse geographies like the U.S. Plains, the Canadian Prairies, Russia, and Ukraine. Each region has its own precipitation rhythm, and any disruption can ripple through the global supply chain. The question is: can weather signals—especially rainfall—be used to predict market behavior?
This article dives into that question using a data-driven lens. We categorized precipitation data and measured how wheat futures returns responded to different rainfall environments. The results? Revealing, and at times, counterintuitive.
2. The Role of Rainfall in Wheat Production
Wheat, especially spring and winter varieties, is particularly sensitive to soil moisture levels at key phases like germination, tillering, and heading. Too little rain in early development and the crop can fail to establish. Too much rain close to harvest? Risk of disease, sprouting, and quality degradation.
Traders have long known that unexpected wet or dry weeks can trigger speculative surges or hedging activity. But how do these events influence actual futures returns?
Before answering that, we need to translate rain into something traders can use: categories based on historical norms.
3. Methodology: Categorizing Rainfall and Measuring Market Response
To understand how wheat prices respond to different levels of rainfall, we analyzed weekly precipitation data across global wheat-producing regions. We normalized the data using percentiles:
Low Precipitation: Below the 25th percentile
Normal Precipitation: Between the 25th and 75th percentiles
High Precipitation: Above the 75th percentile
We then matched this categorized weather data with weekly returns from wheat futures (symbol: ZW) to explore if price behavior systematically varied depending on how wet or dry a week had been.
To test significance, we used a simple t-test comparing the mean returns of low-precip and high-precip weeks. The p-value (6.995E-06) revealed a compelling result: yes, there is a statistically significant difference.
4. Results: High Rainfall, Higher Price Volatility
The data confirms that weeks with extreme rainfall—especially those with high precipitation—often align with more volatile wheat price movements.
But here’s the twist: while low-precip weeks didn’t consistently show bullish returns, high-precip weeks correlated with negative or erratic returns. That makes sense when you think about harvest delays, rot, and declining grain quality.
Traders watching forecasts for excessive rainfall should consider the implications for grain availability and price stabilization mechanisms. This is where speculative plays or hedging via options and standard or micro futures contracts can become especially useful.
5. Interpreting the Volatility: Why the Market Reacts to Rain
Why does excessive rain lead to such uneven price behavior?
The answer lies in uncertainty. Heavy rainfall often introduces multiple variables into the equation: planting delays, logistical bottlenecks, and downgraded wheat quality due to fungal infections. For example, a wet harvest can reduce protein content, pushing millers to seek alternatives—altering both demand and supply expectations simultaneously.
This dual-sided pressure—reduced high-quality yield and uncertain export capability—tends to shake market confidence. Traders respond not just to the supply data but also to how much trust they place in the supply pipeline itself.
6. Futures Contracts: Navigating Risk with Position Size Control
Traders looking to participate in wheat price action have two main CME-listed options:
Standard Wheat Futures (ZW)
Contract Size: 5,000 bushels
Tick Size: 1/4 cent per bushel (0.0025) has a $12.50 per tick impact
Margin Requirement: Approx. $1,700 (subject to change)
Micro Wheat Futures (MZW)
Contract Size: 500 bushels (1/10th the size of the standard contract)
Tick Size: 0.0050 per bushel has a $2.50 per tick impact
Margin Requirement: Approx. $170 (subject to change)
Micro contracts like MZW offer a lower-cost, lower-risk way to trade wheat volatility—perfect for sizing into weather-related trades with precision or managing risk in a more granular fashion. Many traders use these contracts to test strategies during seasonal transitions or while responding to forecast-driven setups.
7. Visual Evidence: Price Behavior by Precipitation Category
To visually represent our findings, we used box plots to show wheat weekly returns grouped by precipitation category:
The shape of these distributions is revealing. High-precipitation weeks not only show lower average returns but also a wider range of possible outcomes—underscoring the role that rainfall extremes play in price volatility rather than just directional bias.
We are also complementing this visual with a weather map that shows real-time precipitation patterns in major wheat-growing regions. This could help traders align weather anomalies with trading opportunities.
8. Final Thoughts: The Forecast Beyond Forecasts
Precipitation isn’t just an agricultural concern—it’s a market catalyst.
Our analysis shows that rainfall extremes, particularly heavy rain, create meaningful signals for wheat traders. The price response is less about direction and more about uncertainty and volatility, which is equally important when structuring trades.
If you’re serious about trading wheat futures, don’t just watch the charts—watch the clouds.
This article is one piece in our broader series on how weather influences ag futures. Stay tuned for the next one, where we continue to decode the atmosphere’s impact on the markets.
When charting futures, the data provided could be delayed. Traders working with the ticker symbols discussed in this idea may prefer to use CME Group real-time data plan on TradingView: tradingview.sweetlogin.com - This consideration is particularly important for shorter-term traders, whereas it may be less critical for those focused on longer-term trading strategies.
General Disclaimer:
The trade ideas presented herein are solely for illustrative purposes forming a part of a case study intended to demonstrate key principles in risk management within the context of the specific market scenarios discussed. These ideas are not to be interpreted as investment recommendations or financial advice. They do not endorse or promote any specific trading strategies, financial products, or services. The information provided is based on data believed to be reliable; however, its accuracy or completeness cannot be guaranteed. Trading in financial markets involves risks, including the potential loss of principal. Each individual should conduct their own research and consult with professional financial advisors before making any investment decisions. The author or publisher of this content bears no responsibility for any actions taken based on the information provided or for any resultant financial or other losses.
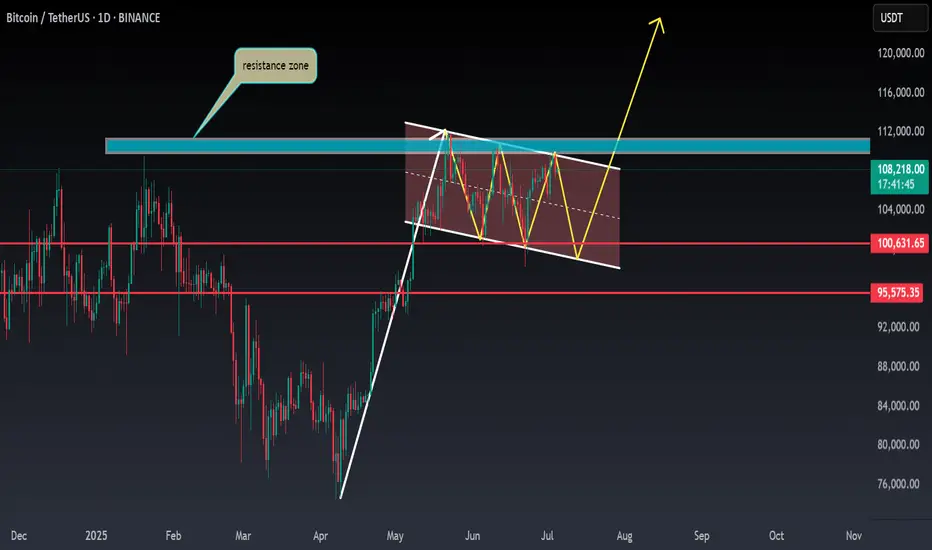
BTC ANALYSIS🌸#BTC Analysis : Bullish Trend 🚀🚀
🚀As we can see that there is a formation of Flag & Pole Pattern in #BTC in daily time frame. Right now we can see that #BTC again retest from the resistance zone and we can see a bounce back from its support zone 💪
🔖 Current Price: $1,08,050
⏳ Target Price: $1,20,000
⁉️ What to do?
- We can trade according to the #BTC chart and make some profits. Keep your eyes on chart price action, observe trading volume. Always observe market sentiments and update yourself everyday.🔰🔰
#BTC #Cryptocurrency #Breakout #TechnicalAnalysis #DYOR
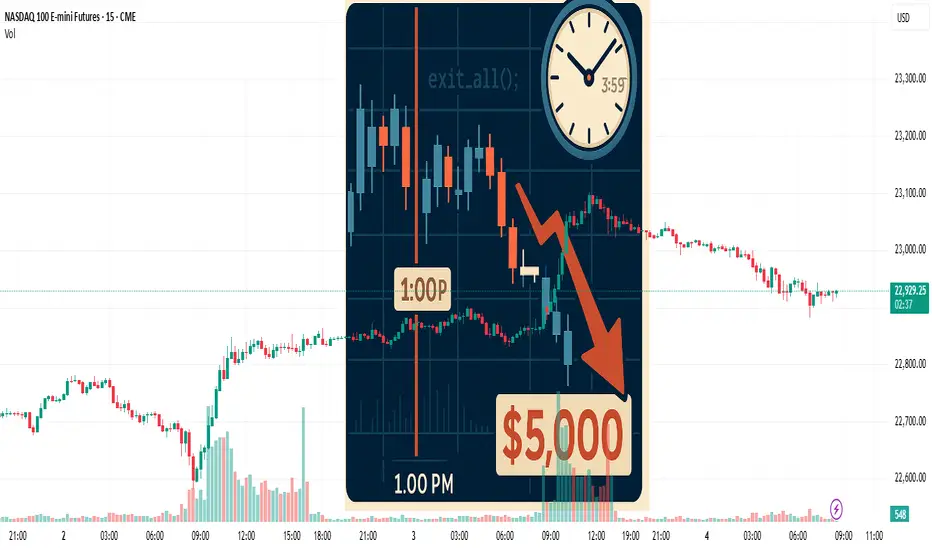
Preventing Holiday Schedule Glitches in Automated Futures Trade
Yesterday the market closed at 1:00 PM, and I still had two open positions. Normally my algorithm sends an “exit all” signal at 3:59 PM EST to close every futures contract, but it didn’t account for the holiday schedule. That glitch cost me $5,000 in just a few hours. Lesson learned.
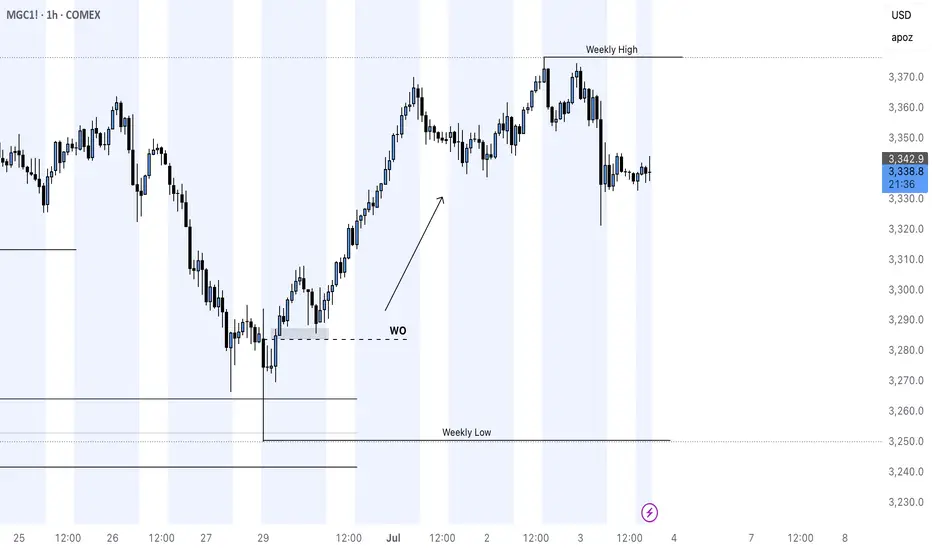
MGC UPDATE 7/2/2025COMEX_MINI:MGC1! played out as expected weekly level was respected and it it clear because of BFI sponsorship Thanks for the people who gave some interest to my last post always happy to help another fellow trader
tradingview.sweetlogin.com
DIYWallSt Trade Journal: Why Price Action Beats News **07/02/25 Trade Journal, and ES_F Stock Market analysis **
EOD accountability report: +763
Sleep: 4.5 hours
Overall health: sleep deprived
** VX Algo System Signals from (9:30am to 2pm) 4/4 success**
— 9:57 AM Market Structure flipped bullish on VX Algo X3! :check:
— 10:30 AM Market Structure flipped bullish on VX Algo X3! :check:
— 11:10 AM VXAlgo ES X1 Sell Signal :x:
**What’s are some news or takeaway from today? and What major news or event impacted the market today? **
You can't trade on news, the only thing that matters in day trading is price action.
Bad news can still make the market go up.
News
The U.S. economy lost 33,000 jobs in June, as per ADP, badly missing forecasts for a gain of 99,000.
MICROSOFT TO LAY OFF AS MANY AS 9,000 EMPLOYEES
Tesla’s NASDAQ:TSLA Q2 deliveries miss consensus expectations
**What are the critical support levels to watch?**
--> Above 6250= Bullish, Under 6240= Bearish
Video Recaps -->https://tradingview.sweetlogin.com/u/WallSt007/#published-charts

06/30/25 Trade Journal, and ES_F Stock Market analysis
EOD accountability report: +212
Sleep: 7 hours
Overall health: Good, caught up on workout and sleep over the weekend.
** VX Algo System Signals from (9:30am to 2pm) 2/4 success**
— 12:20 PM VXAlgo NQ X1 Sell Signal :x:
— 12:30 PM Market Structure flipped bullish on VX Algo X3!:check:
— 1:55 PM VXAlgo NQ X1 Buy Signal :x:
— 2:00 PM Market Structure flipped bearish on VX Algo X3! :check:
**What’s are some news or takeaway from today?
and What major news or event impacted the market today?
**
The X1 Signals today has been happening after market structure signals and usally that means MM is going to change the direction to the opposite way to scam us. Based on that, I decided to lock out my account after making $200 today so i don't get caught in the scam.
News
EU TO ACCEPT TRUMP’S UNIVERSAL TARIFF BUT SEEKS KEY EXEMPTIONS — 2:07 PM
What are the critical support levels to watch?
--> Above 6240= Bullish, Under 6210= Bearish
Video Recaps -->https://tradingview.sweetlogin.com/u/WallSt007/#published-charts

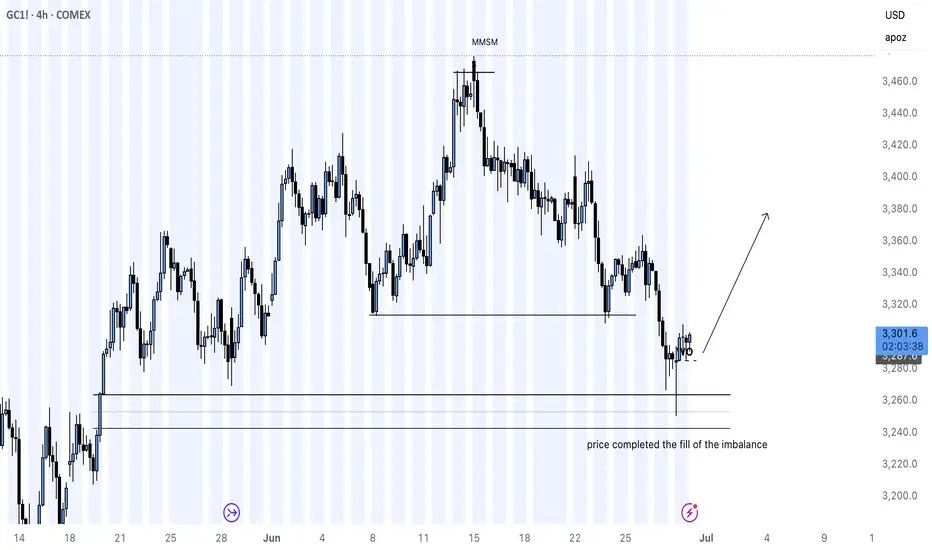
GOLD LONG IDEA MARKET STRUCTURE CHANGEgold futures were on a full sell off due to ongoing global turbulence in the month of June macro news is there to show the bigger picture but price tells the full story
imbalance was filled and the week opened with a bearish candle closing above 3,250 COMEX:GC1! price range now it is time to see It play out to the buyside for the precious metal
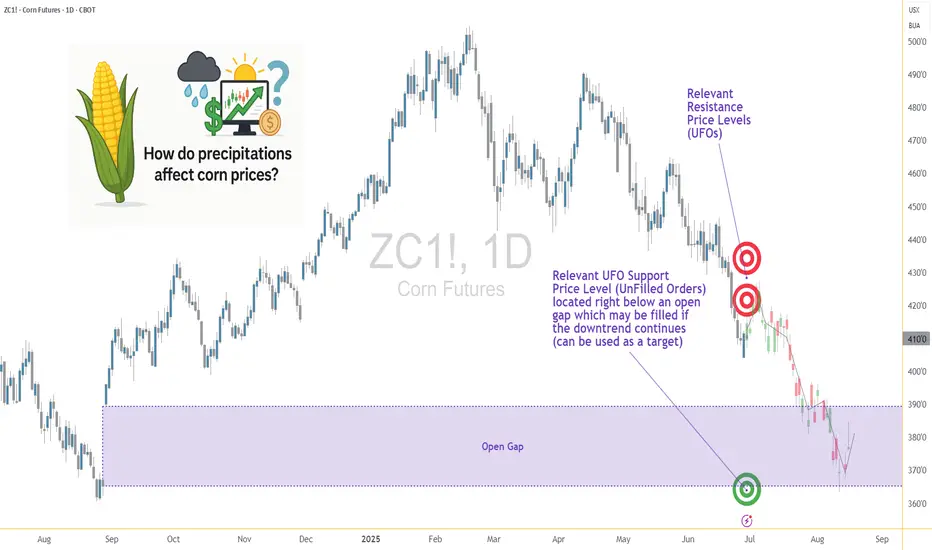
Weather and Corn: Understanding the Precipitation Factor1. Introduction: Rain, Grain, and Market Chain Reactions
In the world of agricultural commodities, few forces carry as much weight as weather — and when it comes to corn, precipitation is paramount. Unlike temperature, which can have nuanced and sometimes ambiguous effects depending on the growth stage, rainfall exerts a more direct and consistent influence on crop performance. For traders, understanding the role of rainfall in shaping market sentiment and price behavior isn't just an agricultural curiosity — it's a trading edge.
This article unpacks the relationship between weekly rainfall levels and corn futures prices. By leveraging normalized weather data and historical returns from Corn Futures (ZC), we aim to translate weather signals into actionable market insights. Whether you're managing large agricultural positions or exploring micro futures like MZC, precipitation patterns can provide vital context for your trades.
2. Corn’s Moisture Dependency
Corn is not just sensitive to water — it thrives or suffers because of it. From the moment seeds are planted, the crop enters a delicate dance with precipitation. Too little moisture during the early stages can impair root development. Too much during germination may lead to rot. And during pollination — particularly the tasseling and silking stages — insufficient rainfall can cause the plant to abort kernels, drastically reducing yield.
On the other hand, excessive rainfall isn't necessarily beneficial either. Prolonged wet periods can saturate soil, hinder nutrient uptake, and encourage fungal diseases. Farmers in the U.S. Corn Belt — particularly in states like Iowa, Illinois, and Nebraska — know this well. A single unexpected weather shift in these regions can send ripple effects across global markets, causing speculators to reassess their positions.
For traders, these weather events aren’t just environmental footnotes — they are catalysts that influence prices, volatility, and risk sentiment. And while annual production is important, it's the week-to-week rhythm of the growing season where short-term trades are born.
3. Our Data-Driven Approach: Weekly Rainfall and Corn Returns
To understand how rainfall impacts price, we collected and analyzed decades of historical weather and futures data, aligning weekly precipitation totals from major corn-growing regions with weekly returns from Corn Futures (ZC).
The weather data was normalized using percentiles for each location and week of the year. We then assigned each weekly observation to one of three precipitation categories:
Low rainfall (<25th percentile)
Normal rainfall (25th–75th percentile)
High rainfall (>75th percentile)
We then calculated the weekly percent change in corn futures prices and matched each return to the rainfall category for that week. The result was a dataset that let us measure not just general trends but statistically significant shifts in market behavior based on weather. One key finding stood out: the difference in returns between low-rainfall and high-rainfall weeks was highly significant, with a p-value of approximately 0.0006.
4. What the Numbers Tell Us
The results are striking. During low-rainfall weeks, corn futures often posted higher average returns, suggesting that the market responds to early signs of drought with anticipatory price rallies. Traders and institutions appear to adjust positions quickly when weather models hint at below-normal moisture during key growth stages.
In contrast, high-rainfall weeks displayed lower returns on average — and greater variability. While rain is essential, excess moisture raises fears of waterlogging, planting delays, and quality issues at harvest. The futures market, ever forward-looking, seems to price in both optimism and concern depending on the volume of rain.
Boxplots of these weekly returns reinforce the pattern: drier-than-usual weeks tend to tilt bullish, while wetter periods introduce uncertainty. For discretionary and algorithmic traders alike, this insight opens the door to strategies that incorporate weather forecasts into entry, exit, and risk models.
📊 Boxplot Chart: Weekly corn futures returns plotted against precipitation category (low, normal, high). This visual helps traders grasp how price behavior shifts under varying rainfall conditions.
5. Strategy: How Traders Can Position Themselves
With the clear statistical link between rainfall extremes and price behavior in corn futures, the logical next step is applying this insight to real-world trading. One straightforward approach is to incorporate weather forecast models into your weekly market prep. If a key growing region is expected to receive below-normal rainfall, that could serve as a signal for a potential bullish bias in the upcoming trading sessions.
This doesn’t mean blindly buying futures on dry weeks, but rather layering this data into a broader trading thesis. For example, traders could combine weather signals with volume surges, technical breakouts, or news sentiment to form confluence-based setups. On the risk management side, understanding how price behaves during extreme weather periods can inform smarter stop-loss placements, position sizing, or even the use of option strategies to protect against unexpected reversals.
Additionally, this information becomes particularly valuable during the planting and pollination seasons, when the corn crop is most vulnerable and the market reacts most strongly. Knowing the historical patterns of price behavior in those weeks — and aligning them with current forecast data — offers a clear edge that fundamental and technical analysis alone may not reveal.
🗺️ Global Corn Map Screenshot: A world map highlighting major corn-growing regions with weather overlay. This helps illustrate the geographic variability in rainfall and how it intersects with key production zones.
6. Corn Futures Contracts: Speculating with Flexibility
For traders looking to act on this kind of seasonal weather intelligence, CME Group provides two practical tools: the standard-size Corn Futures contract (ZC) and the Micro Corn Futures contract (MZC).
Here are some quick key points to remember:
Tick size for ZC is ¼ cent (0.0025) per bushel, equating to $12.50 per tick.
For MZC, each tick is 0.0050 equating to $2.50 per tick.
Standard ZC initial margin is approximately $1,000 and MZC margins are around $100 per contract, though this can vary by broker.
Micro contracts are ideal for those who want exposure to corn prices without the capital intensity of full-size contracts. They’re especially helpful for weather-based trades, where your thesis may rely on shorter holding periods, rapid scaling, or position hedging.
7. Conclusion: Rain’s Role in the Corn Trade
Precipitation isn’t just a farmer’s concern — it’s a trader’s opportunity. Our analysis shows that weather data, especially rainfall, has a statistically significant relationship with corn futures prices. By normalizing historical precipitation data and matching it to weekly returns, we uncovered a clear pattern: drought stress tends to lift prices, while excessive moisture creates volatility and downside risk.
For futures traders, understanding this dynamic adds another layer to market analysis.
As part of a broader series, this article is just one piece of a puzzle that spans multiple commodities and weather variables. Stay tuned for our upcoming releases, where we’ll continue exploring how nature’s forces shape the futures markets.
When charting futures, the data provided could be delayed. Traders working with the ticker symbols discussed in this idea may prefer to use CME Group real-time data plan on TradingView: tradingview.sweetlogin.com - This consideration is particularly important for shorter-term traders, whereas it may be less critical for those focused on longer-term trading strategies.
General Disclaimer:
The trade ideas presented herein are solely for illustrative purposes forming a part of a case study intended to demonstrate key principles in risk management within the context of the specific market scenarios discussed. These ideas are not to be interpreted as investment recommendations or financial advice. They do not endorse or promote any specific trading strategies, financial products, or services. The information provided is based on data believed to be reliable; however, its accuracy or completeness cannot be guaranteed. Trading in financial markets involves risks, including the potential loss of principal. Each individual should conduct their own research and consult with professional financial advisors before making any investment decisions. The author or publisher of this content bears no responsibility for any actions taken based on the information provided or for any resultant financial or other losses.
FX quarter end : a high-probability recurring patternAs we approach the end of June, a well-known phenomenon among FX traders is once again coming into focus: when currencies have diverged significantly over the course of a month or quarter, we often see a technical correction into the final trading session, with partial pullbacks in the pairs that had previously moved the most.
This end-of-month or quarter pattern is not random. It is the predictable result of recurring institutional flows. Recently, the US dollar has notably weakened against most major currencies. As a result, we could anticipate a modest bounce in the dollar to close out the month and start the new week, as various participants are likely to adjust their positions accordingly.
Performance of FX futures contracts from Sunday, June 1 to Friday, June 27:
Swiss Franc +3.71%
Euro +3.61%
British Pound +1.95%
New Zealand Dollar +1.58%
Australian Dollar +1.50%
Canadian Dollar +0.67%
Japanese Yen +0.16%
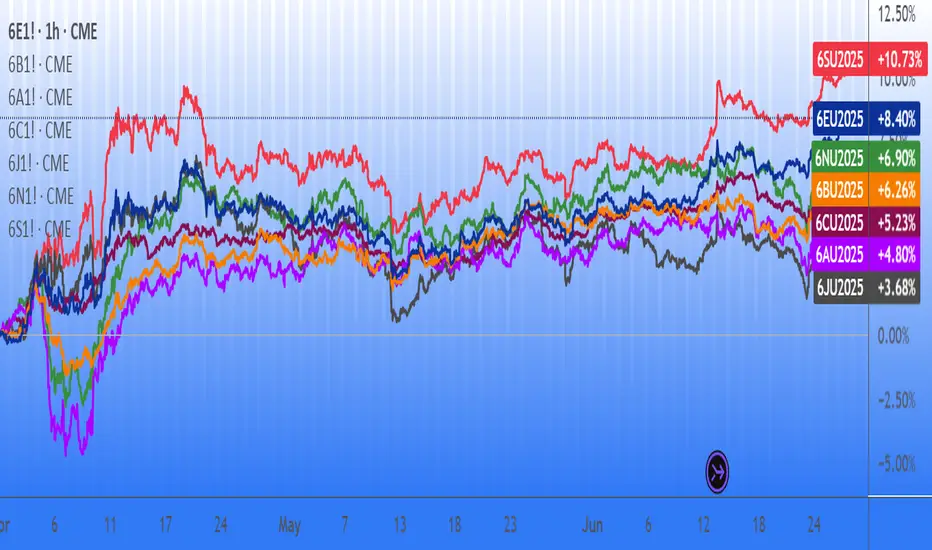
Performance of FX futures contracts from Tuesday, April 1 to Friday, June 27:
Swiss Franc +10.73%
Euro +8.40%
New Zealand Dollar +6.90%
British Pound +6.26%
Canadian Dollar +5.23%
Australian Dollar +4.80%
Japanese Yen +3.68%
These figures illustrate a broad-based decline in the dollar during June and over the entire second quarter. Historically, such imbalances open the door to late-stage adjustments, with currencies that have risen sharply often seeing modest technical pullbacks. This is a setup closely monitored by FX traders, who view it as a high-probability opportunity based on a pattern that is rare, but remarkably consistent.
FX rebalancing: mechanics and market players
At the heart of these adjustments lies one key concept: rebalancing. This is the process by which institutional players, pension funds, insurers, central banks, passive managers, bond funds, corporates adjust their FX exposures to stay in line with the targets defined in their mandates.
Every month, the value of their assets (equities, bonds, alternatives) and currency holdings fluctuate. If a currency appreciates sharply, its weight in the portfolio may become too high. Conversely, if a currency weakens, exposure might fall below target. Rebalancing involves buying or selling FX to return to those target allocations.
This process is recurring, predictable, and usually concentrated in a narrow window, the final hours of the trading month, just before the London 4pm fix. Quarter-ends tend to be even more pronounced, as many investors revisit long-term strategic allocations at that time.
Many of these adjustments are driven by systematic models using fixed thresholds, which adds to the consistency and timing of these flows.
Ideal setup: low volatility, high impact
June 2025 ends in a particularly calm environment: equity markets are stable or even rising, and the VIX is trading near its yearly lows, signs of a quiet and balanced market that favors more technical trading. This context is favorable for strategies aiming to take advantage of rebalancing effects, as in the absence of new announcements or unexpected events, these adjustments are likely to have a tangible impact on prices.
Conversely, in a more volatile market environment, such adjustments could be drowned out by larger flows (such as a flight to quality), thus having a reduced or even negligible impact.
FX options: another layer of flows
Another important factor on Monday, June 30: a large number of FX options expire at 10am New York (3pm London). These expiries cover several major pairs, with significant notional amounts concentrated near current spot levels.
According to what is currently being whispered on trading desk chat rooms, we expect the following large expiries:
EUR/USD: €3.0bn at 1.1650 (below spot)
USD/JPY: $1.6bn at 145.50 (above spot)
USD/CHF: $1.8bn at 0.8000 (above spot)
GBP/USD: £1.0bn at 1.3600 (below spot)
AUD/USD: A$1.1bn at 0.6425 (below spot)
When spot approaches these strikes, option holders or sellers may intervene to "pin" prices, based on their delta exposure. This behavior can amplify technical price movements in the hours before expiration.
When these heavy expirations align with month/quarter end rebalancing flows in a quiet, low-volatility market, it creates a strong potential cocktail for tactical moves, conducive to a dollar rebound into the fix.
How to trade the pattern effectively
Here’s a simplified roadmap to navigate this recurring pattern:
Identify monthly or quarterly extremes: look for the currencies that gained or lost the most over the period;
Assess the market environment: a low VIX, no major data or central bank events, meaningful trends, and significant options expiries are ideal conditions;
Use liquid and transparent instruments: Sep 2025 FX futures (standard, e-mini or micro) are currently the most suitable products for active positioning
Set realistic expectations: aim for a 0.5% to 1.0% pullback, not a full-blown trend reversal
Manage risk properly: as with any strategy, always use a stop-loss. This is quantitative trading, not fortune-telling. If the USD continues to weaken despite the setup, be ready to exit swiftly.
In short...
Quarter/month end FX rebalancing is one of the few market events where anticipated institutional flows can create repeatable, high-probability trading opportunities. These flows stem from real portfolio needs and systematic re-hedging, and are often amplified by option expiries and technical positioning.
This setup provides a great educational case study for any trader seeking to better understand hidden FX dynamics. There’s no secret indicator or crystal ball here, just a solid grasp of structural flows and timing.
From a personal standpoint, after over 20 years trading currencies, this strategy remains one of my favorites: simple, effective, and highly instructive. I encourage you to study it closely, and observe its behavior during upcoming month-end windows.
---
When charting futures, the data provided could be delayed. Traders working with the ticker symbols discussed in this idea may prefer to use CME Group real-time data plan on TradingView: tradingview.com/cme/ .
This consideration is particularly important for shorter-term traders, whereas it may be less critical for those focused on longer-term trading strategies.
General Disclaimer:
The trade ideas presented herein are solely for illustrative purposes forming a part of a case study intended to demonstrate key principles in risk management within the context of the specific market scenarios discussed. These ideas are not to be interpreted as investment recommendations or financial advice. They do not endorse or promote any specific trading strategies, financial products, or services. The information provided is based on data believed to be reliable; however, its accuracy or completeness cannot be guaranteed. Trading in financial markets involves risks, including the potential loss of principal. Each individual should conduct their own research and consult with professional financial advisors before making any investment decisions. The author or publisher of this content bears no responsibility for any actions taken based on the information provided or for any resultant financial or other losses.