MES1!/ES1! Day Trade Plan for 05/01/2025MES1!/ES1! Day Trade Plan for 05/01/2025
📈 5670 5695
📉 5613 5600
Thanks to all my followers! Truly appreciate the support!
Please like and share for more ES/NQ levels Tues & Thurs 🤓📈📉🎯💰
*These levels are derived from comprehensive backtesting and research and a quantitative system demonstrating high accuracy. This statistical foundation suggests that price movements are likely to exceed initial estimates.*
Futurestrading

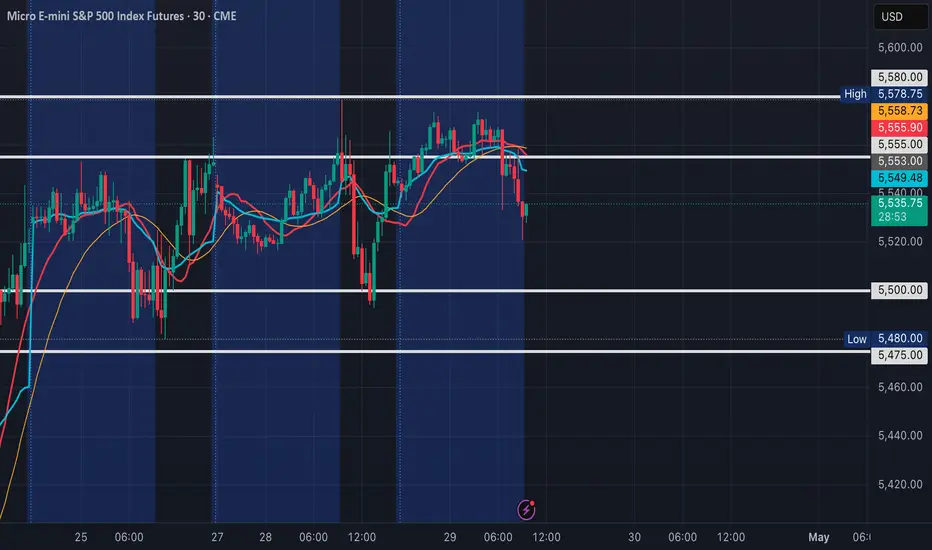
MES!/ES1! Day Trade Plan for 04/29/2025MES!/ES1! Day Trade Plan for 04/29/2025
📈 5555 5580
📉 5500 5475
Thanks to all my followers! Truly appreciate the support!
Please like and share for more ES/NQ levels Tues & Thurs 🤓📈📉🎯💰
*These levels are derived from comprehensive backtesting and research and a quantitative system demonstrating high accuracy. This statistical foundation suggests that price movements are likely to exceed initial estimates.*
BAT ANALYSIS🚀#BAT Analysis :
🔮As we can see in the chart of #BAT that there is a formation of "Falling Wedge Pattern". In a daily timeframe #BAT broke out the pattern. Expecting a bullish move in few days if #BAT retest the levels
⚡️What to do ?
👀Keep an eye on #BAT price action. We can trade according to the chart and make some profits⚡️⚡️
#BAT #Cryptocurrency #TechnicalAnalysis #DYOR

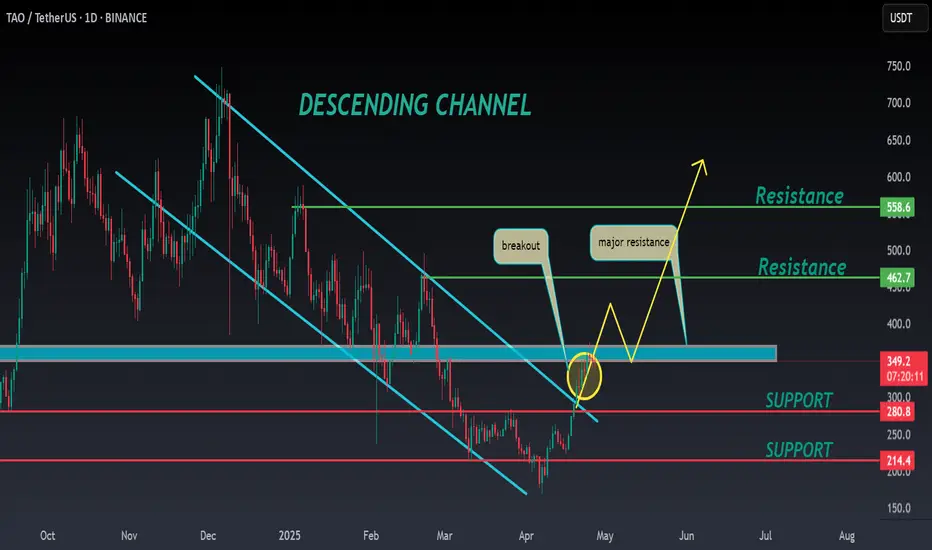
TAO ANALYSIS📊 #TAOAnalysis
✅There is a formation of Descending Channel Pattern in daily time frame in #TAO .
Also there is a perfect breakout and retest. Now we can expect a bullish move. If the price sustains the major resistance zone then we will see more bullish move
👀Current Price: $349
🎯 Target Price : $460
⚡️What to do ?
👀Keep an eye on #TAO price action and volume. We can trade according to the chart and make some profits⚡️⚡️
#TAO #Cryptocurrency #Breakout #TechnicalAnalysis #DYOR
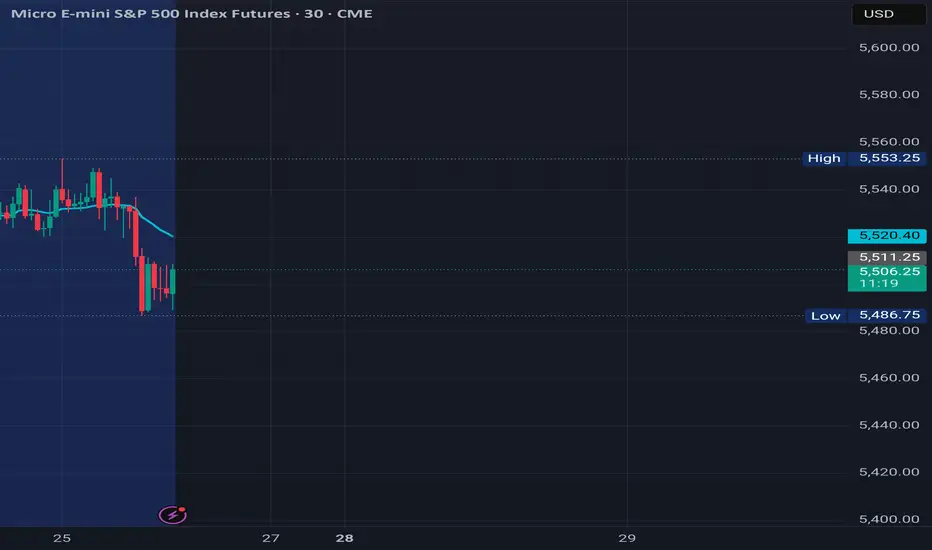
MES!/ES1! Day Trade Plan for 04/25/2025MES!/ES1! Day Trade Plan for 04/25/2025
📈 5530 5560
📉 5475 5445
Thanks to all my followers! Truly appreciate the support!
Please like and share for more NQ levels Tues & Thurs 🤓📈📉🎯💰
*These levels are derived from comprehensive backtesting and research and a quantitative system demonstrating high accuracy. This statistical foundation suggests that price movements are likely to exceed initial estimates.*
MNQ1!/NQ1! Day Trade Plan for 04/25/2025MNQ1!/NQ1! Day Trade Plan for 04/25/2025
📈 19430 19580
📉 19140 18980
Thanks to all my followers! Truly appreciate the support!
Please like and share for more NQ levels Tues & Thurs 🤓📈📉🎯💰
*These levels are derived from comprehensive backtesting and research and a quantitative system demonstrating high accuracy. This statistical foundation suggests that price movements are likely to exceed initial estimates.*

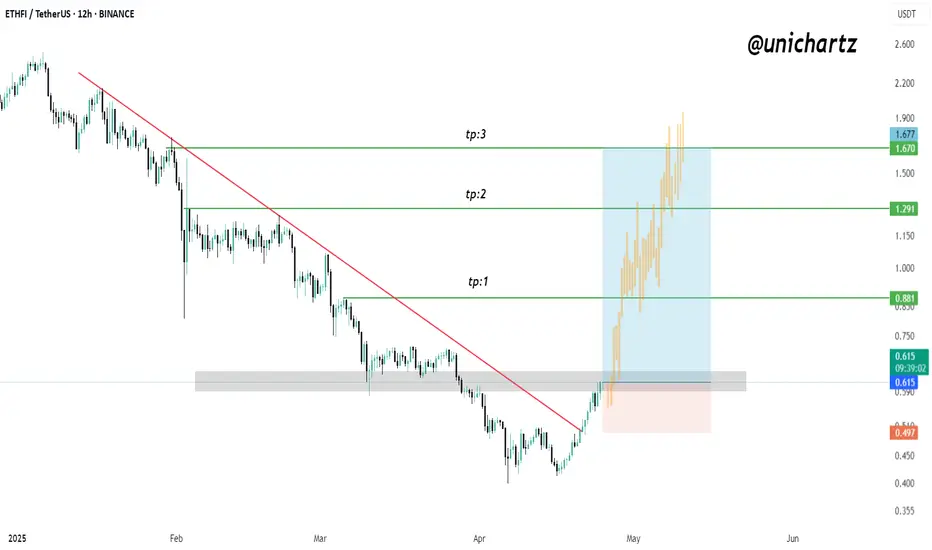
ETHFI Breakout Loading? Targets Up to $1.67!$ETHFI/USDT Analysis
Price is currently trading around a key resistance zone after a strong recovery from recent lows. While momentum looks bullish, the resistance has not been broken yet — making this a crucial level to watch.
A clean breakout and candle close above this zone could confirm a potential rally toward the next targets.
🎯 Upside Targets (if breakout confirms):
TP1: $0.881
TP2: $1.291
TP3: $1.677
📌 For now, stay patient. Let the price action confirm before entering — this zone could act as a rejection point if bulls fail to push through.
DYOR, NFA
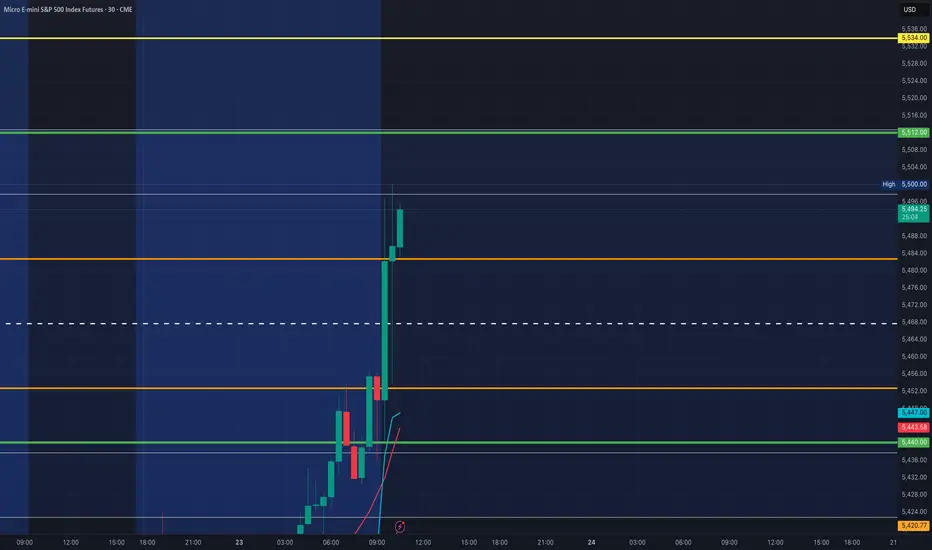
MES1!/ES1! Day Trade Plan for 04/23/2025MES1!/ES1! Day Trade Plan for 04/23/2025
📈 5512
📉 5440
Thanks to all my followers! Truly appreciate the support!
Please like and share for more NQ levels Tues & Thurs 🤓📈📉🎯💰
*These levels are derived from comprehensive backtesting and research and a quantitative system demonstrating high accuracy. This statistical foundation suggests that price movements are likely to exceed initial estimates.*
MNQ!/NQ1! Day Trade Plan for 04/22/2025MNQ!/NQ1! Day Trade Plan for 04/22/2025
📈18210 18365
📉17910 17760
Thanks to all my followers! Truly appreciate the support!
Please like and share for more NQ levels Tues & Thurs 🤓📈📉🎯💰
*These levels are derived from comprehensive backtesting and research and a quantitative system demonstrating high accuracy. This statistical foundation suggests that price movements are likely to exceed initial estimates.*

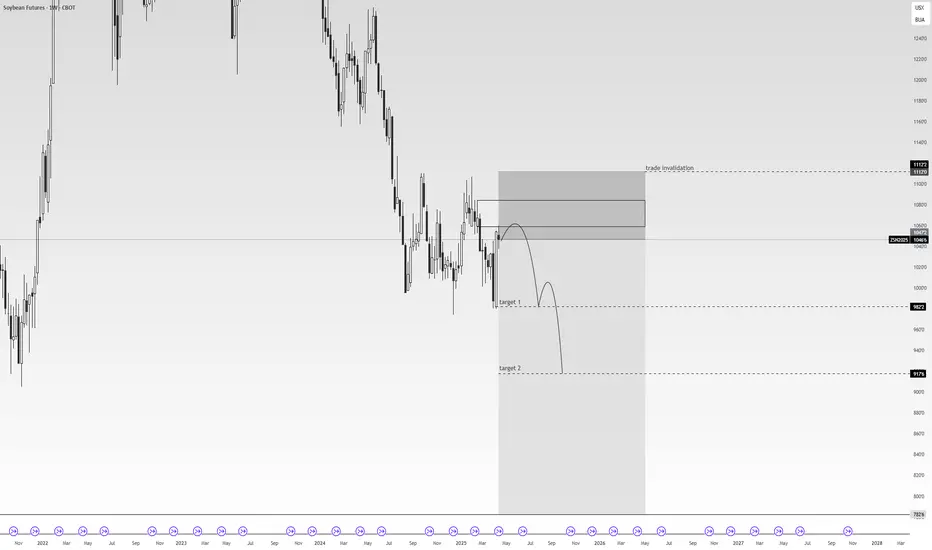
SOYBEAN, Weekly Supply/Demand+fundamentals we are kicking of the year with a clear technical rejection from $1050 to $1112 weekly supply zone. Price pushed agressively into this area and has now printed multiple rejection candles on the daily, confirming the zones strength.
fundamentals are showing bearish positioning aligned with the technical setup.
entry wil be at market open. first target is at break of recent support and if fundamentals stil support the bias by then we wil also aim for target two.
simple structure, clean confirmation. lets see if price delivers.
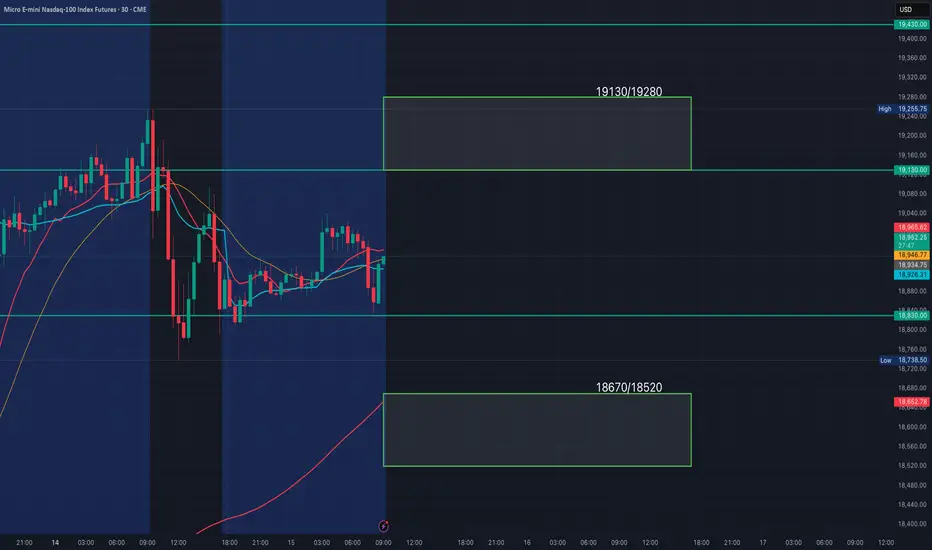
MNQ!/NQ1! Day Trade Plan for 04/15/2025MNQ!/NQ1! Day Trade Plan for 04/15/2025
📈19130 19280
📉18670 18520
Thanks to all my followers! Truly appreciate the support!
Please like and share for more NQ levels Tues & Thurs 🤓📈📉🎯💰
*These levels are derived from comprehensive backtesting and research and a quantitative system demonstrating high accuracy. This statistical foundation suggests that price movements are likely to exceed initial estimates.*
ETH ANALYSIS🔮 #ETH Analysis
🌟🚀 #ETH is trading in an Ascending Triangle Pattern in 1hr timefram and there is a breakdown of the pattern. Ascending trendline works as a resistance line and #ETH is moving towards the ascending trendline. There are 2 scenario in #ETH; either it will again come in the pattern and move upward and it will retest the major support zone first.
🔖 Current Price: $1589
⁉️ What to do?
- We have marked crucial levels in the chart . We can trade according to the chart and make some profits. 🚀
#ETH #Cryptocurrency #Breakout #DYOR

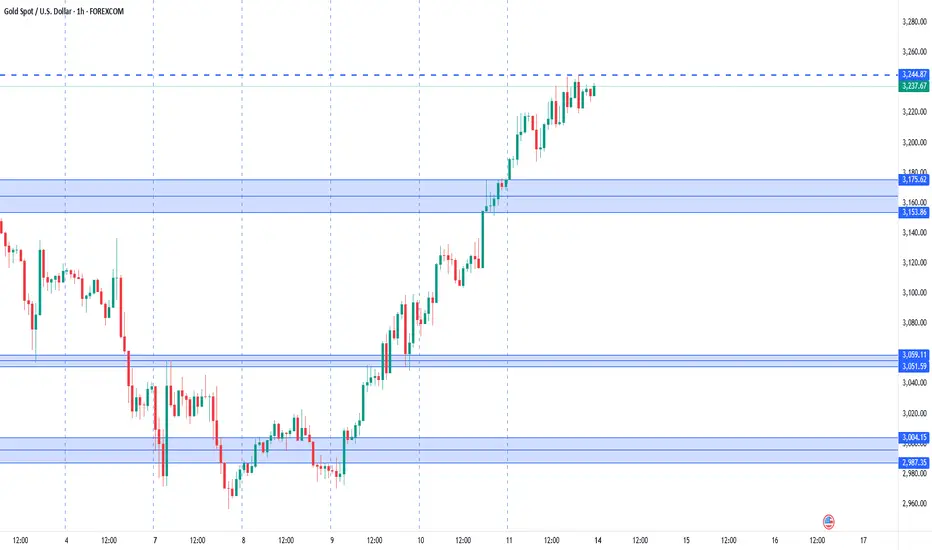
XAUUSD. Weekly trading levels 14 - 18.04.2025During the week you can trade from these price levels. Finding the entry point into a transaction and its support is up to you, depending on your trading style and the development of the situation. Zones show preferred price ranges WHERE to look for an entry point into a trade.
If you expect any medium-term price movements, then most likely they will start from one of the zones.
Levels are valid for a week, the date is in the title. Next week I will adjust the levels based on new data and publish a new post.
! Please note that brokers have a difference in quotes, take this into account when trading.
The history of level development can be seen in my previous posts. They cannot be edited or deleted. Everything is fair. :)
----------------------------------------------
I don’t play guess the direction (that’s why there are no directional arrows), but zones (levels) are used for trading. We wait for the zone to approach, watch the reaction, and enter the trade.
Levels are drawn based on volumes and data from the CME. They are used as areas of interest for trading. Traded as classic support/resistance levels. We see the reaction to the rebound, we trade the rebound. We see a breakout and continue to trade on a rollback to the level. The worst option is if we revolve around the zone in a flat.
Do not reverse the market at every level; if there is a trend movement, consider it as an opportunity to continue the movement. Until the price has drawn a reversal pattern.
More information in my RU profile.
Don't forget to like Rocket and Subscribe!!! Feedback is very important to me!
GBPUSD. Weekly trading levels 14 - 18.04.2025During the week you can trade from these price levels. Finding the entry point into a transaction and its support is up to you, depending on your trading style and the development of the situation. Zones show preferred price ranges WHERE to look for an entry point into a trade.
If you expect any medium-term price movements, then most likely they will start from one of the zones.
Levels are valid for a week, the date is in the title. Next week I will adjust the levels based on new data and publish a new post.
! Please note that brokers have a difference in quotes, take this into account when trading.
The history of level development can be seen in my previous posts. They cannot be edited or deleted. Everything is fair. :)
----------------------------------------------
I don’t play guess the direction (that’s why there are no directional arrows), but zones (levels) are used for trading. We wait for the zone to approach, watch the reaction, and enter the trade.
Levels are drawn based on volumes and data from the CME. They are used as areas of interest for trading. Traded as classic support/resistance levels. We see the reaction to the rebound, we trade the rebound. We see a breakout and continue to trade on a rollback to the level. The worst option is if we revolve around the zone in a flat.
Do not reverse the market at every level; if there is a trend movement, consider it as an opportunity to continue the movement. Until the price has drawn a reversal pattern.
More information in my RU profile.
Don't forget to like Rocket and Subscribe!!! Feedback is very important to me!

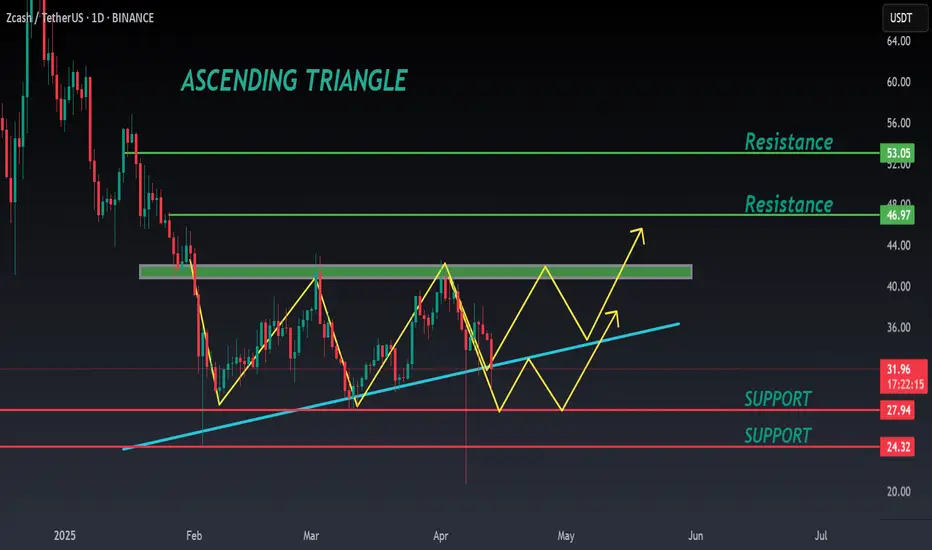
ZEC ANALYSIS🔮 #ZEC Analysis
🌟🚀 #ZEC is trading in an Ascending Triangle Pattern and here we can see that #ZEC testing the ascending trendline. Also there is an instant major support zone. We can see a pullback from its major support zone.
🔖 Current Price: $32
⏳ Target Price: $40
⁉️ What to do?
- We have marked crucial levels in the chart . We can trade according to the chart and make some profits. 🚀
#ZEC #Cryptocurrency #Breakout #DYOR
MNQ!/NQ1! Day Trade Plan for 04/11/2025MNQ!/NQ1! Day Trade Plan for 04/11/2025 (Just because 😏)
📈18670 18820
📉18220 18060
Thanks to all my followers! Truly appreciate the support!
Please like and share for more NQ levels Tues & Thurs 🤓📈📉🎯💰
*These levels are derived from comprehensive backtesting and research and a quantitative system demonstrating high accuracy. This statistical foundation suggests that price movements are likely to exceed initial estimates.*
ORCA/USDT – Futures Setup: Potential Short OpportunityORCA is currently testing a resistance zone at 2.940 USDT, an area where selling pressure has historically emerged. Price action indicates a potential rejection, setting up a possible short trade targeting lower support levels.
📌 Futures Trading Levels:
Entry Zone: 2.920 - 2.940 – short positions could be considered upon confirmation of rejection.
Stop-Loss: 3.075 – placed above resistance to limit risk exposure.
Take-Profit Targets:
First TP: 2.79
Second TP: 2.665
Third TP: 2.51
This structure aligns with futures trading principles while maintaining risk management. Let me know if you’d like further refinements! 🚀📊

MNQ!/NQ1! Day Trade Plan for 04/10/2025MNQ!/NQ1! Day Trade Plan for 04/10/2025
📈19130
📉18530
Thanks to all my followers! Truly appreciate the support!
Please like and share for more NQ levels Tues & Thurs 🤓📈📉🎯💰
*These levels are derived from comprehensive backtesting and research and a quantitative system demonstrating high accuracy. This statistical foundation suggests that price movements are likely to exceed initial estimates.*

The quinquennial Bear Trap Update Crude Oil Futures Update on the video I posted 5 days prior , giving a heads up about the Quinquennial pivots at 55 USD .
Congrats if you took this trade as it was a big one ! Support my work with a like and any comments I welcome beneath the video .

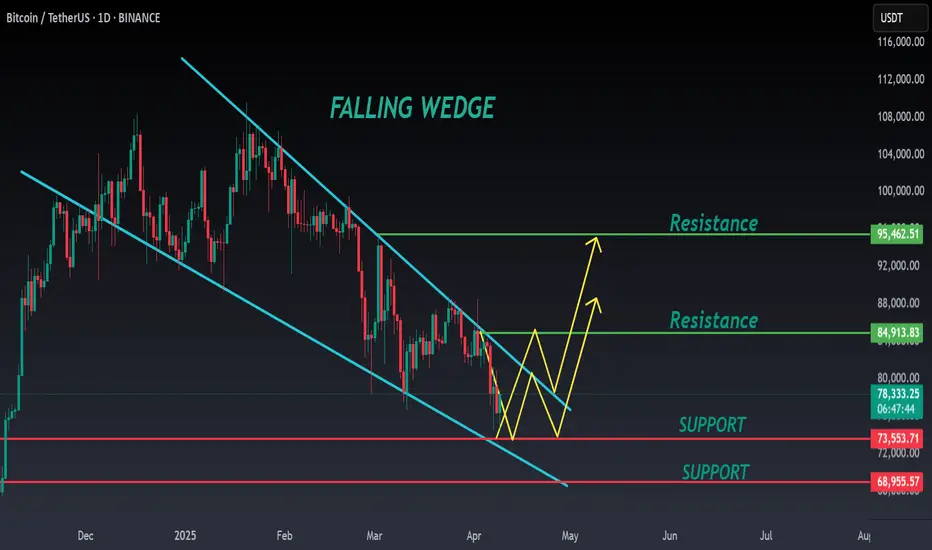
BTC ANALYSIS📊 #BTC Analysis
✅There is a formation of Falling Wedge Pattern on 12 hr chart and currently trading around its major support zone🧐
Pattern signals potential bullish movement incoming after a breakout
👀Current Price: $78,150
🚀 Target Price: $84,900
⚡️What to do ?
👀Keep an eye on #BTC price action and volume. We can trade according to the chart and make some profits⚡️⚡️
#BTC #Cryptocurrency #TechnicalAnalysis #DYOR
MNQ!/NQ1! Day Trade Plan for 04/08/2025MNQ!/NQ1! Day Trade Plan for 04/08/2025
📈18365
📉17755
Thanks to all my followers! Truly appreciate the support!
Please like and share for more NQ levels Tues & Thurs 🤓📈📉🎯💰
*These levels are derived from comprehensive backtesting and research and a quantitative system demonstrating high accuracy. This statistical foundation suggests that price movements are likely to exceed initial estimates.*
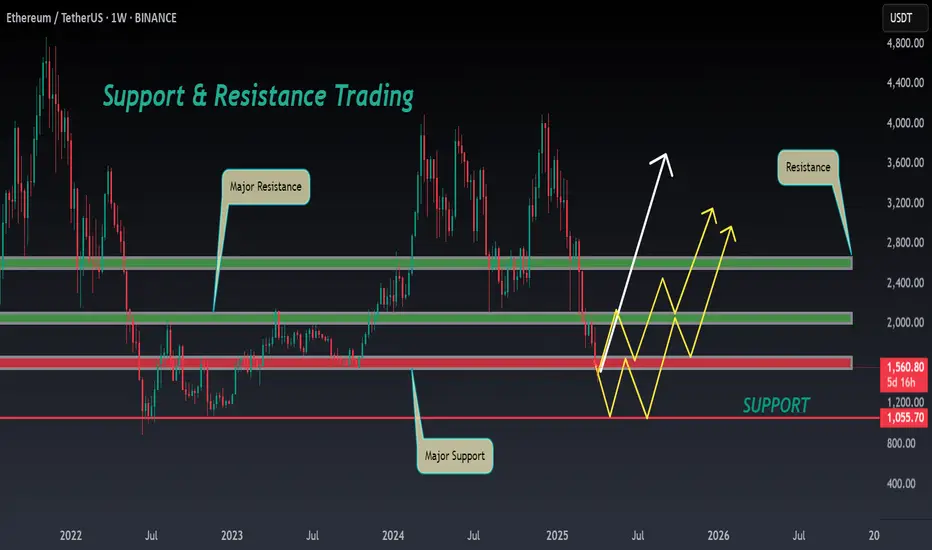
ETH ANALYSIS🔮 #ETH Analysis :: Support & Resistance Trading
💲💲 #ETH is trading between support and resistance area. If #ETH sustains above major support area then we will a bullish move and if not then we will see more bearish move in #ETH then could expect a pullback.
💸Current Price -- $1564
⁉️ What to do?
- We have marked crucial levels in the chart . We can trade according to the chart and make some profits. 🚀💸
#ETH #Cryptocurrency #DYOR
Nasdaq Enters Correction Territory Do we go Deeper
Monthly analysis done on the NQ with the ambition to connect with current price activity and gauge a deeper technical understanding on if this is just the start of a bigger correction for the year ahead . Tools used in this video Standard Fib , TR Pocket , CVWAP/ PVWAP Incorporating PVWAP and CVWAP into trading strategies allows for a more nuanced understanding of market dynamics used to assess trading performance and market trends.
Date and price range and trend line .
Some research below regarding the previous correction that I reference the technicals to in the video .
In November 2021, the Nasdaq reached record highs
However, concerns over rising inflation, potential interest rate hikes by the Federal Reserve, and supply chain disruptions led to increased market volatility. These factors contributed to a correction in the Nasdaq, with the index experiencing notable declines as investors reassessed valuations, particularly in high-growth technology stocks.
VS Today
March 2025 Correction:
As of March 2025, the Nasdaq Composite has faced another significant correction. On March 10, 2025, the index plummeted by 4%, shedding 728 points, marking its third-worst point loss ever, with only earlier losses during the COVID-19 pandemic surpassing this.
This downturn has been attributed to several factors:
Economic Policies: President Trump's announcement of increased tariffs on Canada, Mexico, and China has unsettled markets, raising fears of a potential recession
Inflation Concerns: Investors are closely monitoring upcoming consumer-price index (CPI) reports to gauge inflation trends, as higher-than-expected inflation could hinder the Federal Reserve's ability to lower interest rates, exacerbating stock market declines
Sector-Specific Declines: Major technology companies, including Tesla, have experienced significant stock price declines, contributing to the overall downturn in the Nasdaq
Comparison of the Two Corrections:
Catalysts: The November 2021 correction was primarily driven by concerns over rising inflation and potential interest rate hikes. In contrast, the March 2025 correction has been influenced by geopolitical factors, including new tariff announcements, and ongoing inflation concerns.
Magnitude: While both corrections were significant, the March 2025 correction has been more severe in terms of single-day point losses. The 4% drop on March 10, 2025, resulted in a loss of 728 points, marking it as one of the most substantial declines in the index's history.
Investor Sentiment: Both periods saw increased market volatility and a shift towards risk aversion. However, the recent correction has been accompanied by heightened fears of a potential recession, partly due to inconsistent government messaging regarding economic prospects.
In summary, while both corrections were driven by concerns over inflation and economic policies, the March 2025 correction has been more pronounced, with additional factors such as new tariffs and recession fears playing a significant role.
