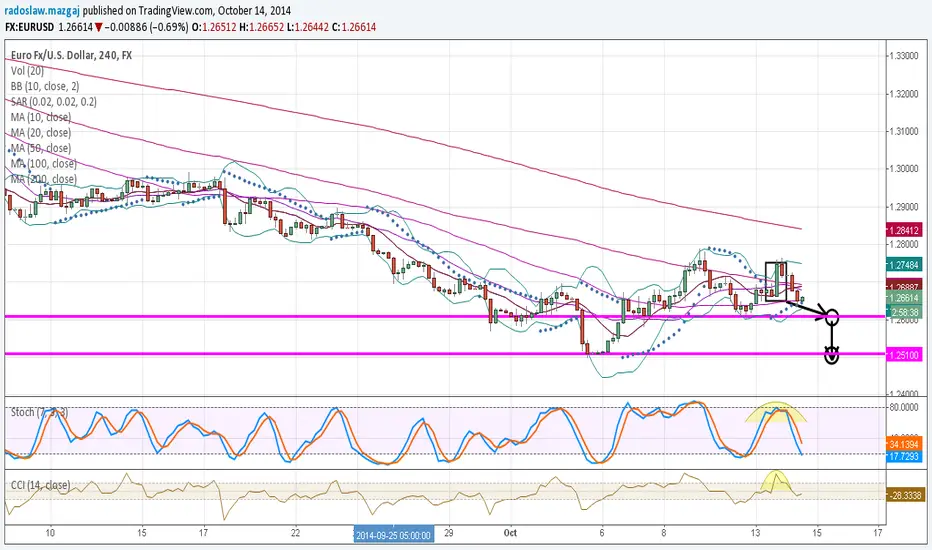
New York Session Watch EURUSDThere was an inside bar candlestick pattern formed on EUR/USD in today's Asian session which could lead the price lower in today's New York session. Over the shorter term horizon, the trend is flat while the long term trend is still down as the price remains below the 200 period golden moving average. Note that the Stochastic indicator and Commodity Channel Index (CCI) are showing the price is overbought at the time that the inside bar candlestick pattern was formed which adds fuel to the bears. With all that being said, we could potentially have great selling opportunities in today's New York session. The lower band of the Bollinger Band and the 1.2610 support level could serve as the first target for sellers and the 1.2510 support level could serve as the second target for sellers to take profits.
Fxsalt
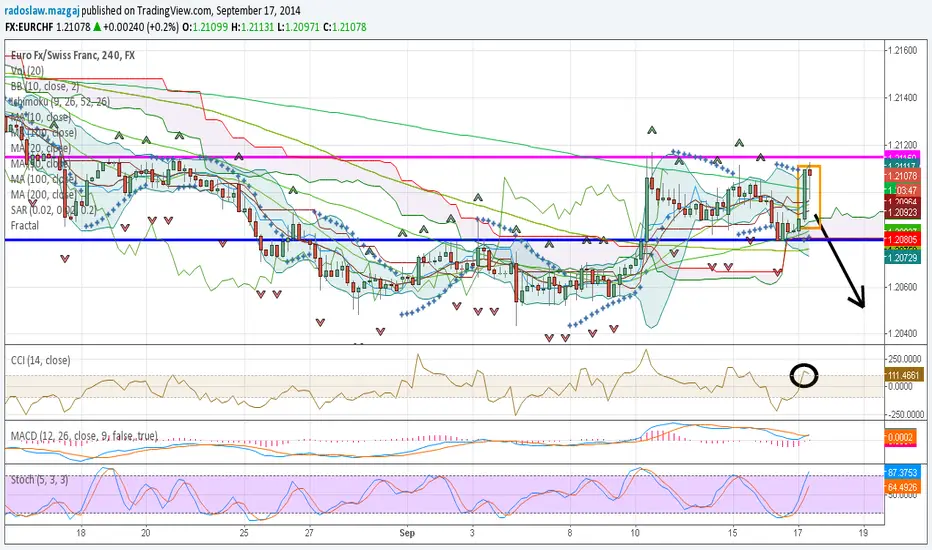
New York Session Watch EURCHFThere’s a bearish pin bar candlestick pattern in the making on EUR/CHF at the 1.2115 resistance level. This pin bar candlestick pattern also pierced through the upper end of the bollinger band and snaps back quickly. The long term trend is still bearish as all the short term moving averages are still below the 200 period long term moving average. The current support level is at 1.2080 and the resistance is at 1.2115. The Commodity Channel Index (CCI) also indicates that this market is overbought at the current price level which could lead the price lower in today’s New York session. If this candle closes as it is right now or slightly lower, we will officially have a bearish pin bar candlestick pattern at this 1.2115 resistance level which could offer a high probability of shorting opportunities in today New York session.