GALA price analysis🪙 Please tell us, is the #GALA project still "alive"?
It's old, has gone through many cycles on the crypto market, and hasn't died yet.
Maybe now (being related to the CRYPTOCAP:ETH Ecosystem) is the best time to “come back to life”?
For this to happen, the price of OKX:GALAUSDT must finally:
1️⃣ confidently hold above $0.01390-0.01460
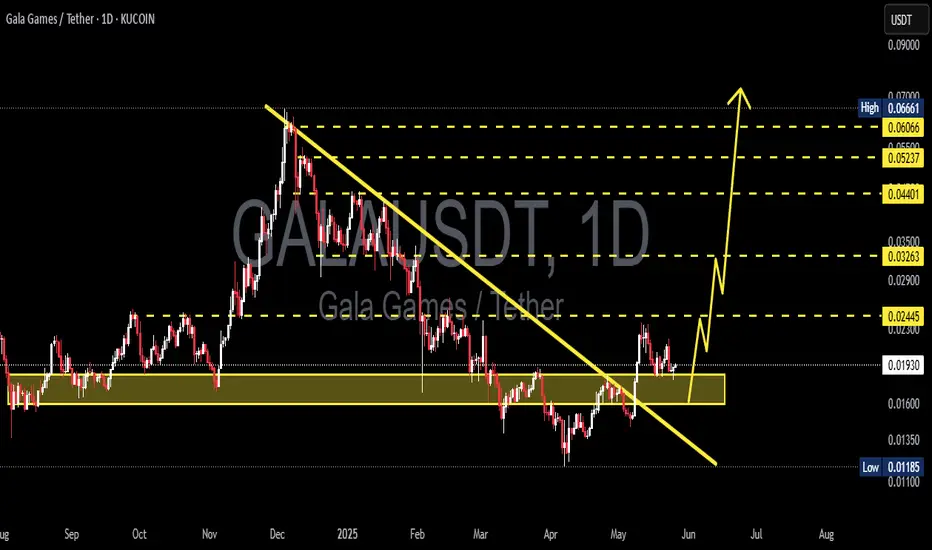
2️⃣ continue to grow confidently to $0.044
3️⃣ And finally, rapidly grow to $0.10-0.11 by the end of the year.
Is this a realistic scenario? Write your thoughts in the comments.
GALAUSD
Can #GALA Sustain the Current Bullish Momentum or Will it Fall?Yello, Paradisers! Is this #GALA pullback just a healthy retest before another explosive rally, or are we about to see a deeper drop that will wipe out impatient bulls? Let’s break it down:
💎After weeks of trading inside a descending channel, #GALAUSDT finally broke above the descending resistance, sparking renewed bullish momentum. The breakout has pushed the price toward the $0.020 zone, but now #GALA has encountered a resistance zone (previously support). The question remains: will GALA maintain this level or revisit lower supports before proceeding higher?
💎The current structure shows #GALAUSD attempting to convert its previous resistance into new support around $0.018–$0.020. A clean retest of this support zone would significantly increase the probability of a sustained bullish continuation. The 50EMA acting as support and positive macro trend in crypto market reinforces our bullish bias.
💎If buyers remain in control, the first upside target is the moderate resistance at $0.0253. However, the major profit-taking and strong selling pressure are expected near the $0.0312 zone, where the strongest resistance lies. A successful break and hold above this level would confirm a more aggressive bullish trend.
💎On the flip side, the bullish setup becomes invalid if #GALA loses the strong demand zone at $0.0162–$0.0134. A confirmed close below $0.0134 would flip the structure bearish and open the door for another leg down.
Stay patient, Paradisers. Let the breakout confirm, and only then do we strike with conviction.
MyCryptoParadise
iFeel the success🌴

#GALA/USDT Gala bull run possible ?#GALA
The price is moving within a descending channel on the 1-hour frame, adhering well to it, and is on its way to breaking strongly upwards and retesting it.
We have support from the lower boundary of the descending channel at 0.01750.
We have a downtrend on the RSI indicator that is about to be broken and retested, supporting the upside.
There is a major support area in green at 0.01770, which represents a strong basis for the upside.
Don't forget a simple thing: ease and capital.
When you reach the first target, save some money and then change your stop-loss order to an entry order.
For inquiries, please leave a comment.
We have a trend to hold above the 100 Moving Average.
Entry price: 0.01975
First target: 0.02020
Second target: 0.02112
Third target: 0.02210
Don't forget a simple thing: ease and capital.
When you reach the first target, save some money and then change your stop-loss order to an entry order.
For inquiries, please leave a comment.
Thank you.

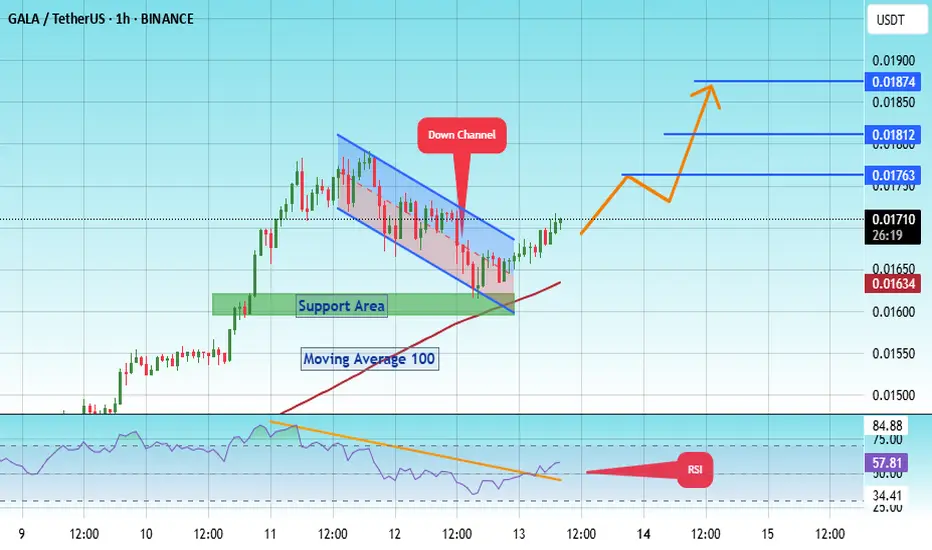
#GALA/USDT Gala bull run possible ?#GALA
The price is moving within a descending channel on the 1-hour frame, adhering well to it, and is poised to break it strongly upwards and retest it.
We have a bounce from the lower boundary of the descending channel. This support is at 0.01630.
We have a downtrend on the RSI indicator that is about to break and retest, supporting the upside.
There is a key support area (in green) at 0.01590, which represents a strong basis for the upside.
Don't forget one simple thing: ease and capital.
When you reach the first target, save some money and then change your stop-loss order to an entry order.
For inquiries, please leave a comment.
We have a trend of stability above the Moving Average 100.
Entry price: 0.01711
First target: 0.01763
Second target: 0.01812
Third target: 0.01874
Don't forget one simple thing: ease and capital.
When you reach the first target, save some money and then change your stop-loss order to an entry order.
For inquiries, please leave a comment.
Thank you.
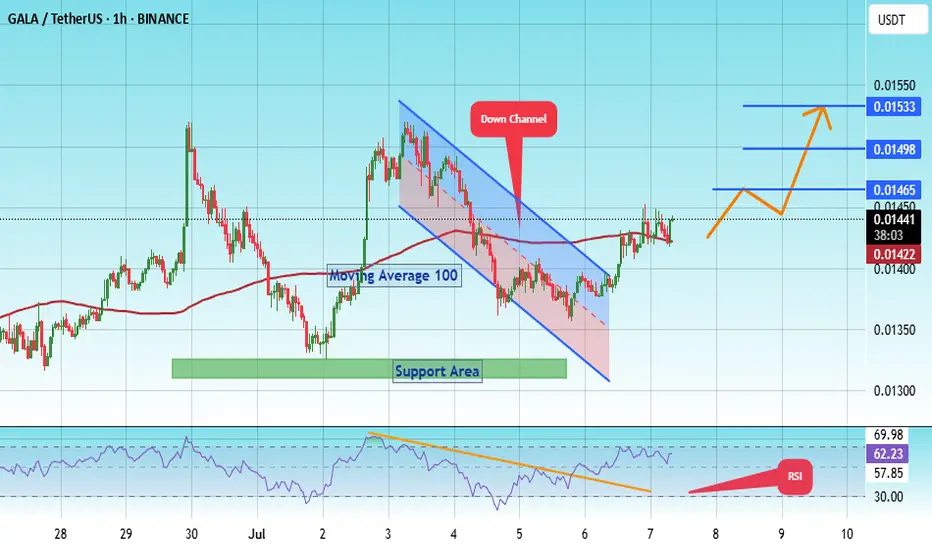
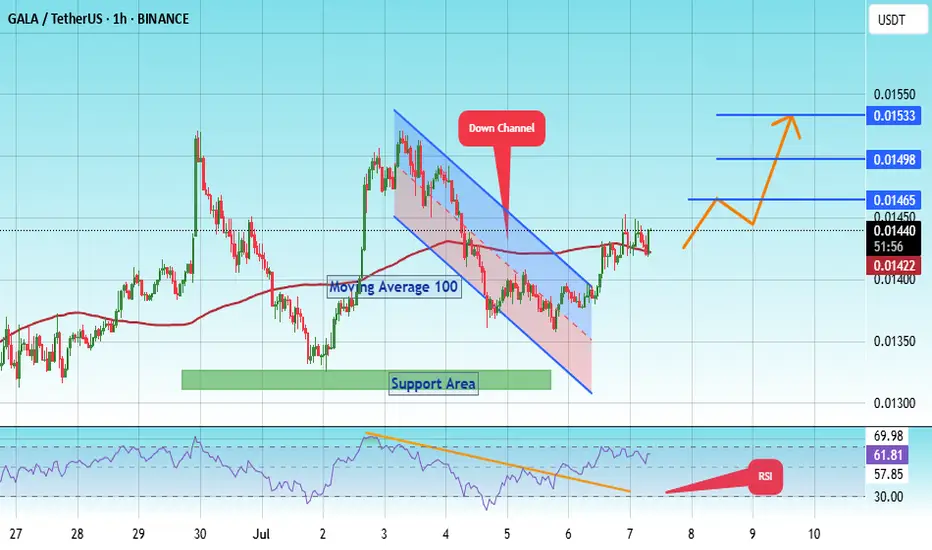
#GALA/USDT#GALA
The price is moving within a descending channel on the 1-hour frame, adhering well to it, and is poised to break it strongly upwards and retest it.
We have a bounce from the lower boundary of the descending channel. This support is at 0.01340.
We have a downtrend on the RSI indicator that is about to break and retest, supporting the upward trend.
There is a key support area in green at 0.01320, which represents a strong basis for the upward trend.
Don't forget one simple thing: ease and capital.
When you reach the first target, save some money and then change your stop-loss order to an entry order.
For inquiries, please leave a comment.
We have a trend of stability above the Moving Average 100.
Entry price: 0.01430
First target: 0.01465
Second target: 0.01500
Third target: 0.01533
Don't forget one simple thing: ease and capital.
When you reach the first target, save some money and then change your stop-loss order to an entry order.
For inquiries, please leave a comment.
Thank you.
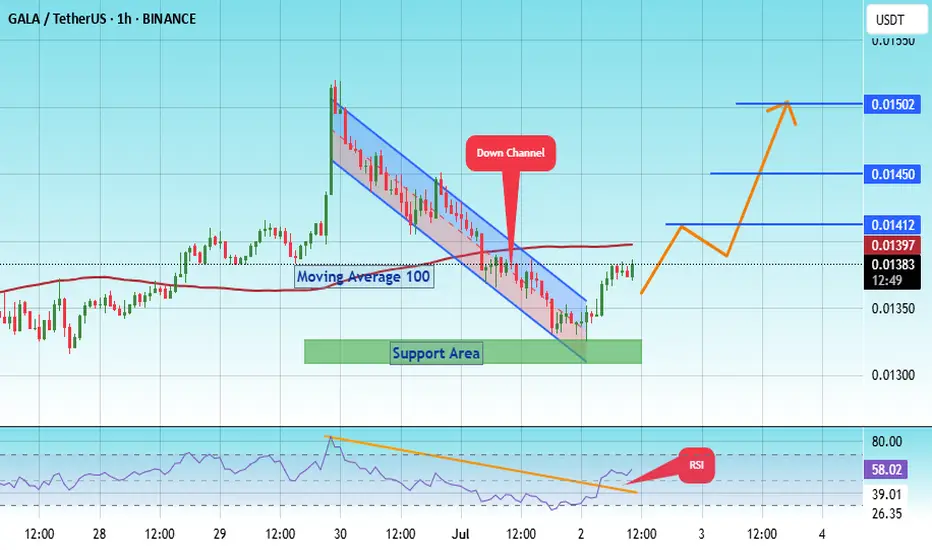
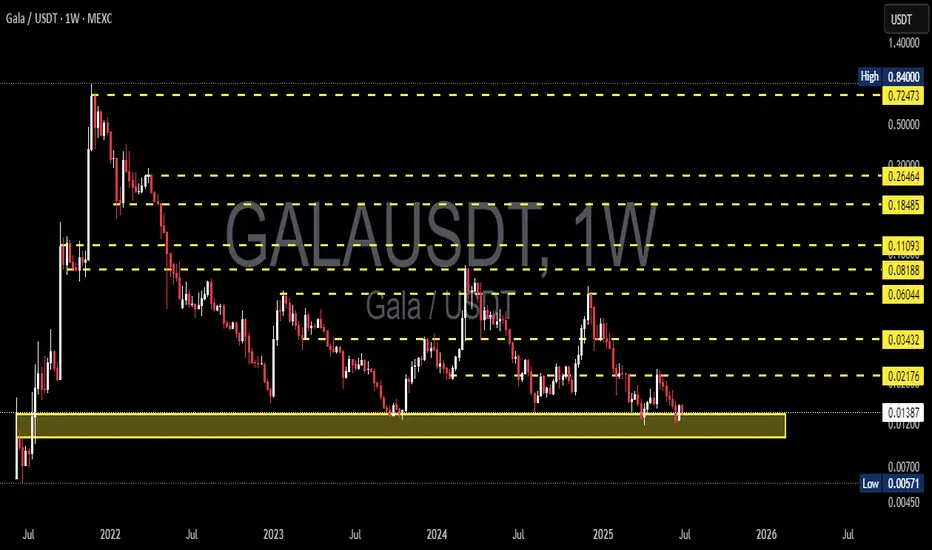
GALA/USDT | Testing Critical Historical Support – Rebound?🧠 Full & Professional Analysis:
GALA/USDT is currently sitting at a critical inflection point on the weekly timeframe. The price has returned to a major historical demand zone between $0.01200 – $0.01400, which has served as a strong support base for over a year.
This level has repeatedly acted as a launchpad for rallies since early 2023, making it a high-interest area for long-term investors and swing traders.
🔍 Key Technical Structure & Zones:
🟨 Major Weekly Support Zone:
$0.01200 – $0.01400 → A historically proven demand zone that has held multiple times. A stronghold for buyers, and a potential accumulation base.
🟦 Layered Resistance Zones (If Rebound Occurs):
$0.02176 → First minor resistance; initial confirmation of a bullish reversal.
$0.03432 → Mid-range resistance within current consolidation.
$0.06044 → Key breakout level to shift trend structure.
$0.11093 – $0.18485 → Medium-term targets if bullish momentum builds.
$0.26464 to $0.72473 → Historical distribution zones if full recovery unfolds.
🟥 Bearish Risk Zone (Breakdown Scenario):
Break below $0.01200 opens downside risk toward the all-time low at $0.00571, or even lower if sentiment worsens.
✅ Bullish Scenario:
If the $0.01200–$0.01400 support holds:
1. A bullish engulfing candle on the weekly chart could be an early reversal signal.
2. Potential formation of a double bottom in this demand zone (yet to be confirmed).
3. Initial target at $0.02176, with possible extension toward $0.06044—a major pivot zone.
4. Sustained buying and volume confirmation could push GALA toward $0.110 – $0.184 in the mid-term.
❌ Bearish Scenario:
If the price fails to hold above $0.01200:
1. A breakdown may trigger a capitulation move to the $0.00700 – $0.00571 range (historical lows).
2. This would invalidate the current sideways base structure and extend the downtrend.
3. Lack of buying interest could open the door to deeper losses.
📐 Pattern & Technical Context:
Accumulation Base Formation: Still possible if support holds and buyers step in.
Tight Range Compression: Price is coiling at the bottom, indicating a potential breakout move soon.
No major reversal patterns confirmed yet, such as Inverse H&S or W-bottom, but structure suggests accumulation pressure.
🧭 Summary:
> GALA is dancing on the edge of a crucial support level. The price action in this zone will likely determine the next major direction. A bounce could ignite a multi-week rally, while a breakdown may send the asset to new lows. Volume and weekly close will be key confirmation points.
📊 Recommendations:
Swing Traders: Watch for bullish candle patterns and breakout above $0.02176.
Long-Term Investors: Consider conservative accumulation in the support zone with clear risk management.
Bearish Traders: Wait for confirmed weekly close below $0.012 before considering short setups.
#GALA #GALAUSDT #CryptoTA #AltcoinAnalysis #WeeklyChart #BullishSetup #BearishScenario #TechnicalAnalysis #AccumulationZone #BreakoutWatch
#GALA/USDT Gala bull run possible ?
#GALA
The price is moving within a descending channel on the 1-hour frame, adhering well to it, and is on its way to breaking it strongly upwards and retesting it.
We have a bounce from the lower boundary of the descending channel, this support at 0.0600.
We have a downtrend on the RSI indicator that is about to break and retest, supporting the upward move.
There is a key support area in green at 0.01312, which represents a strong basis for the upward move.
Don't forget one simple thing: ease and capital.
When you reach the first target, save some money and then change your stop-loss order to an entry order.
For inquiries, please leave a comment.
We have a trend of stability above the Moving Average 100.
Entry price: 0.01360
First target: 0.01412
Second target: 0.01450
Third target: 0.01500
Don't forget one simple thing: ease and capital.
When you reach the first target, save some money and then change your stop-loss order to an entry order.
For inquiries, please leave a comment.
Thank you.
GALA/USDT - 4HR TIME FRAME - BULLISH!!This chart illustrates a bullish reversal setup using Elliott Wave Theory, Fibonacci retracement levels, and RSI divergence. Here's a detailed breakdown:
📉 Elliott Wave Count:
The chart shows a complete 5-wave impulse down labeled (1) to (5), suggesting a potential end of a bearish trend.
Wave (5) appears to have just completed, indicating a possible reversal point.
🔍 Falling Wedge Pattern:
A falling wedge is visible between waves (4) and (5), which is typically a bullish reversal pattern.
Price is near the wedge’s apex, hinting at an imminent breakout.
🟡 Strong Demand Zone:
Price is currently inside a yellow demand zone (roughly $0.0136 to $0.0144).
This zone coincides with the 0.786 Fibonacci retracement level at $0.01363, a common reversal level.
📊 RSI Indicator:
The RSI at the bottom shows a bullish divergence:
Price made a lower low, while RSI made a higher low.
This signals weakening bearish momentum and potential upside ahead.
🧠 Summary:
This is a technically sound bullish setup, suggesting a bottoming structure and an upcoming uptrend. The confluence of Elliott Wave completion, wedge breakout, RSI divergence, and Fibonacci support all point to a strong reversal probability.

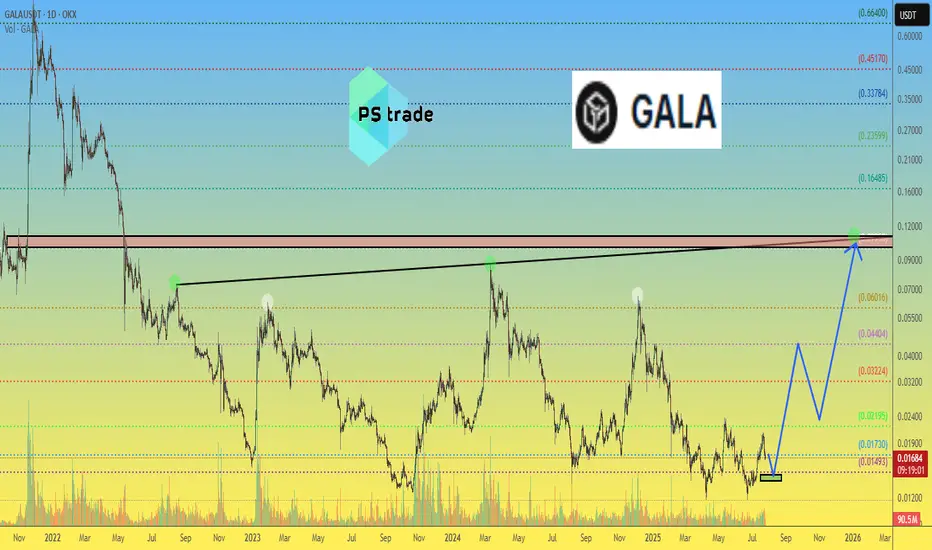
GALAUSDT 1W AnalysisGALA ~ 1W Analysis
#GALA Buy at support block if you still have confidence in this coin with a short term target of at least 20%+ from here.
#GALA/USDT#GALA
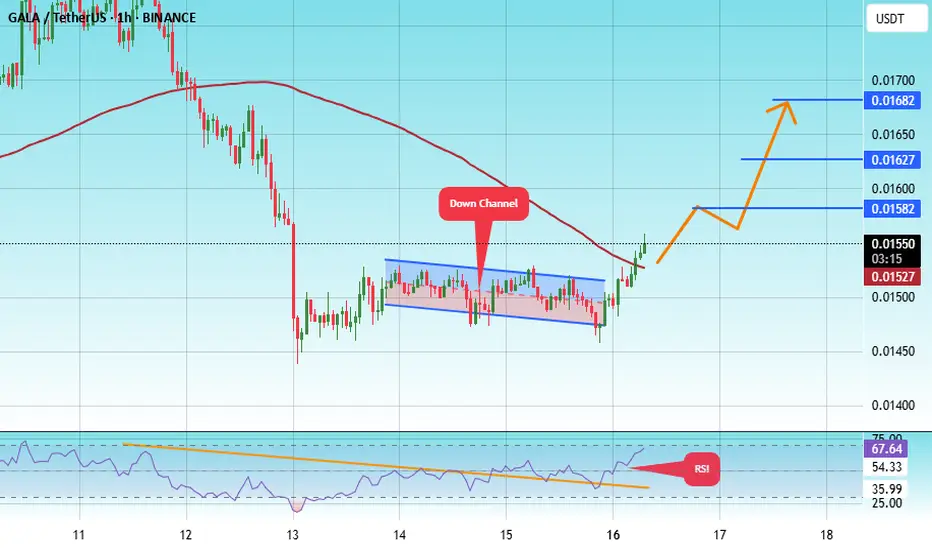
The price is moving within a descending channel on the 1-hour frame, adhering well to it, and is heading towards a strong breakout and retest.
We are experiencing a rebound from the lower boundary of the descending channel. This support is at 0.01477.
We are experiencing a downtrend on the RSI indicator, which is about to break and retest, supporting the upward trend.
We are heading towards stability above the 100 Moving Average.
Entry price: 0.01550
First target: 0.01582
Second target: 0.01627
Third target: 0.01682
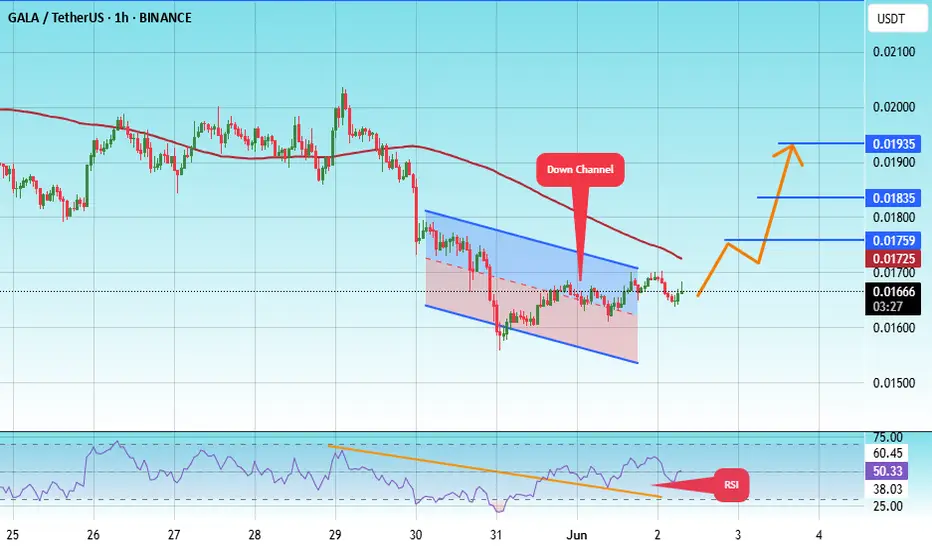
#GALA/USDT#GALA
The price is moving within a descending channel on the 1-hour frame, adhering well to it, and is on its way to breaking it strongly upwards and retesting it.
We are seeing a bounce from the lower boundary of the descending channel, this support at 0.01560.
We have a downtrend on the RSI indicator that is about to break and retest, supporting the upward trend.
We are looking for stability above the 100 moving average.
Entry price: 0.01666
First target: 0.01760
Second target: 0.01835
Third target: 0.01935
GALAUSDT 1D AnalysisGALA ~ 1D Analysis
#GALA Buy back on retest of this support block with short term target of at least 15%+ from here.
#GALA/USDT#GALA
The price is moving within a descending channel on the 1-hour frame and is expected to break and continue upward.
We have a trend to stabilize above the 100 moving average once again.
We have a downtrend on the RSI indicator, which supports the upward move by breaking it upward.
We have a support area at the lower limit of the channel at 0.01940, acting as strong support from which the price can rebound.
Entry price: 0.02042
First target: 0.02101
Second target: 0.02193
Third target: 0.02300
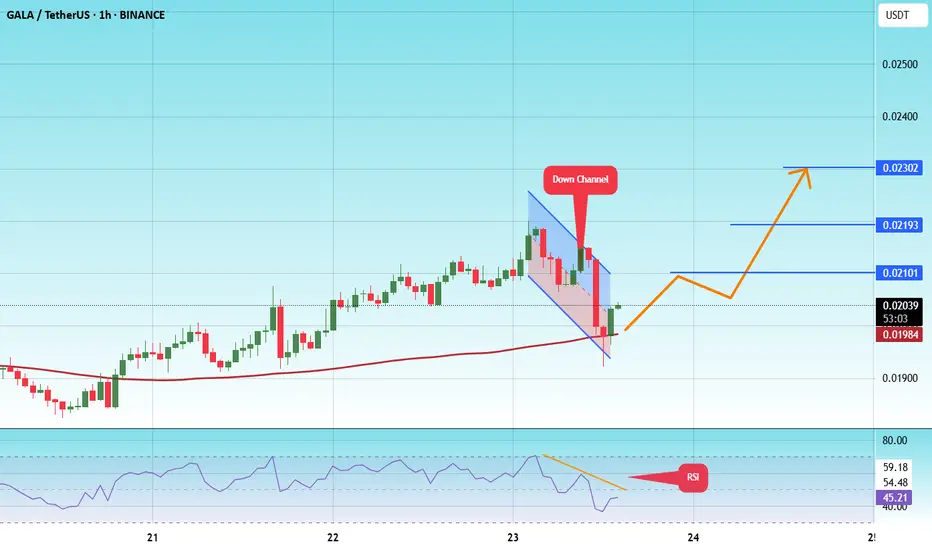
#GALA/USDT#GALA
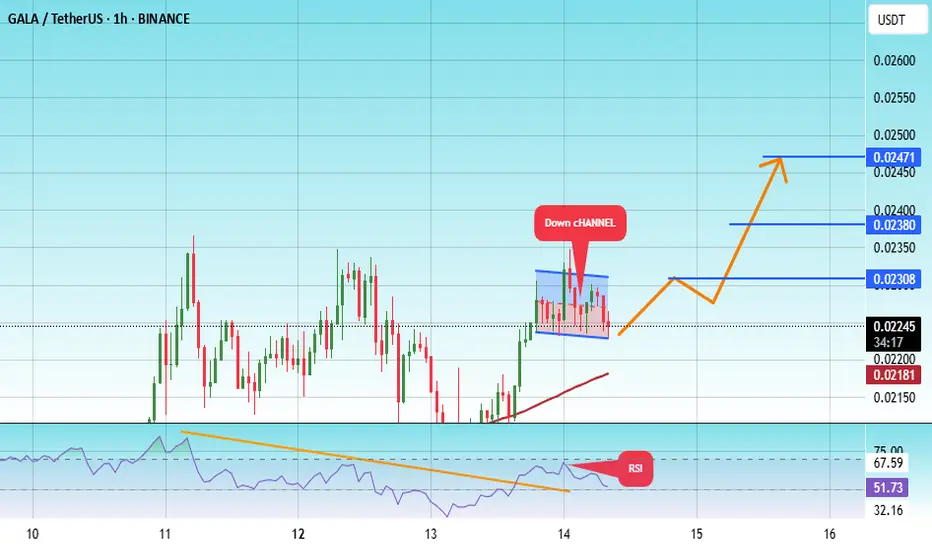
The price is moving within a descending channel on the 1-hour frame, adhering well to it, and is heading for a strong breakout and retest.
We are seeing a bounce from the lower boundary of the descending channel, which is support at 0.02226.
We have a downtrend on the RSI indicator that is about to break and retest, supporting the upward trend.
We are looking for stability above the 100 moving average.
Entry price: 0.02232
First target: 0.02308
Second target: 0.02380
Third target: 0.02471
#GALA/USDT#GALA
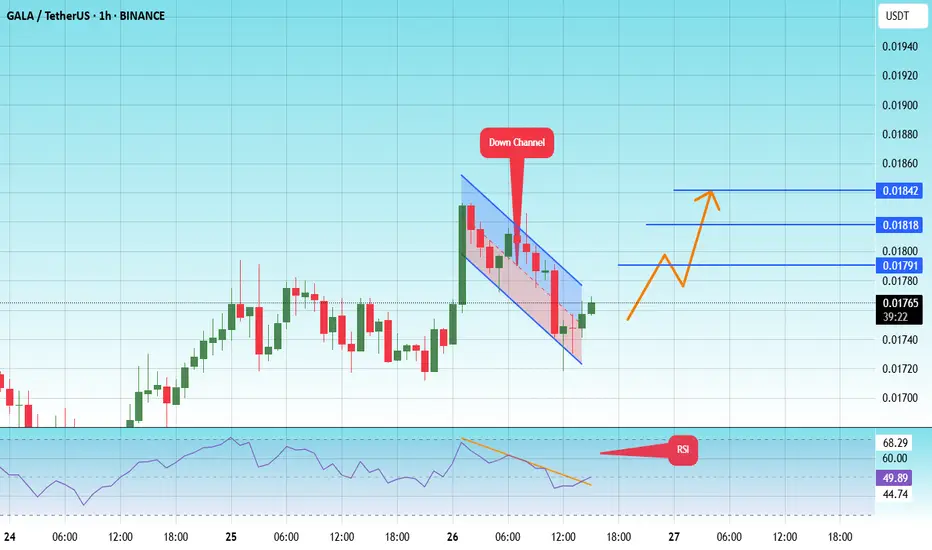
The price is moving within a descending channel on the 1-hour frame and is expected to break and continue upward.
We have a trend to stabilize above the 100 moving average once again.
We have a downtrend on the RSI indicator that supports the upward move with a breakout.
We have a support area at the lower limit of the channel at 0.01727, which acts as strong support from which the price can rebound.
Entry price: 0.01764
First target: 0.01790
Second target: 0.01818
Third target: 0.01842
#GALA/USDT#GALA
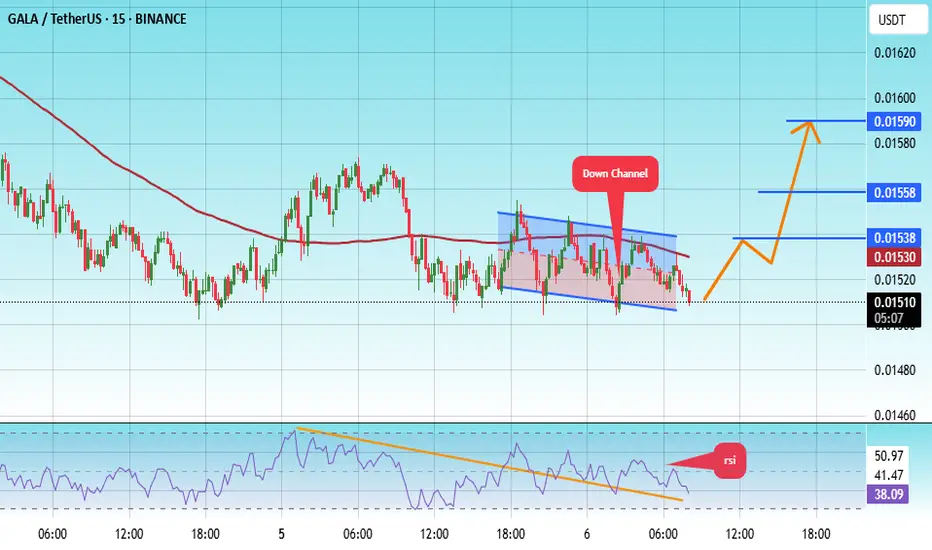
The price is moving within a descending channel on the 1-hour frame, adhering well to it, and is on its way to breaking it strongly upwards and retesting it.
We are seeing a bounce from the lower boundary of the descending channel, which is support at 0.01500.
We have a downtrend on the RSI indicator that is about to break and retest, supporting the upward trend.
We are looking for stability above the 100 Moving Average.
Entry price: 0.01509
First target: 0.01538
Second target: 0.01558
Third target: 0.01590
#GALA/USDT
#GALA
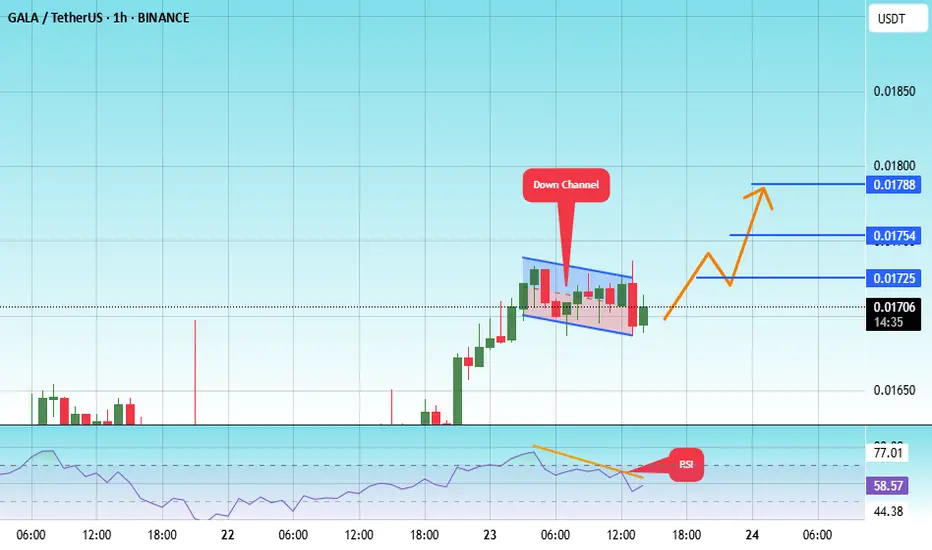
The price is moving within a descending channel on the 1-hour frame, adhering well to it, and is heading for a strong breakout and retest.
We are seeing a bounce from the lower boundary of the descending channel, which is support at 0.01688.
We have a downtrend on the RSI indicator that is about to break and retest, supporting the upward trend.
We are looking for stability above the 100 moving average.
Entry price: 0.01703
First target: 0.01725
Second target: 0.01754
Third target: 0.01788
#GALA/USDT#GALA
The price is moving within a descending channel on the 1-hour frame, adhering well to it, and is on track to break down strongly and retest it.
We are seeing a bounce from the upper boundary of the descending channel. This support is at 0.01533.
We have a downtrend on the RSI indicator that is about to break and retest, which supports the decline.
We are looking to stabilize above the 100 moving average, but the price is on track to touch it first.
Entry price: 0.01516
First target: 0.01489
Second target: 0.01466
Third target: 0.01434

GALAUSDT 1D AnalysisGALA ~ 1D Analysis
#GALA Buy after successfully penetrating this resistant line with a short -term target of at least 10%+ from here.

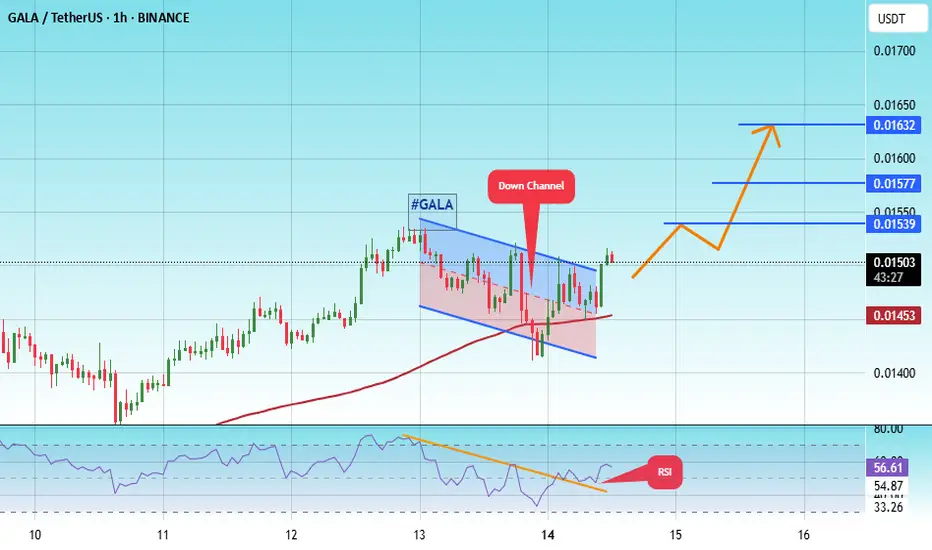
#GALA/USDT#GALA
The price is moving within a descending channel on the 1-hour frame, adhering well to it, and is on its way to breaking it strongly upwards and retesting it.
We are seeing a bounce from the lower boundary of the descending channel, this support at 0.01415.
We have a downtrend on the RSI indicator that is about to break and retest, supporting the upward trend.
We are looking for stability above the 100 moving average.
Entry price: 0.01504
First target: 0.01540
Second target: 0.01577
Third target: 0.016532
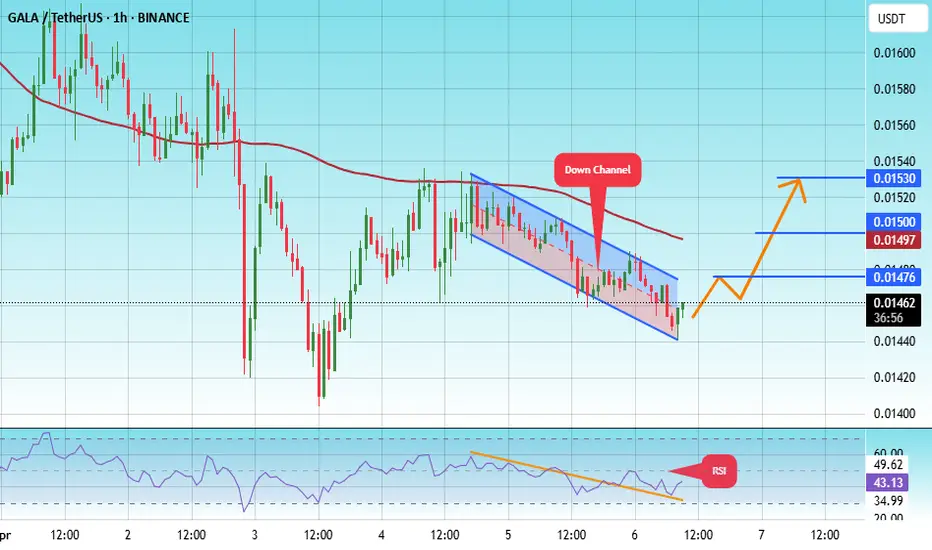
#GALA/USDT#GALA
The price is moving within a descending channel on the 1-hour frame, adhering well to it, and is on its way to breaking it strongly upwards and retesting it.
We are seeing a bounce from the lower boundary of the descending channel, this support at 0.01443.
We have a downtrend on the RSI indicator that is about to break and retest, supporting the upward trend.
We are looking for stability above the 100 Moving Average.
Entry price: 0.1460
First target: 0.01476
Second target: 0.01500
Third target: 0.01530
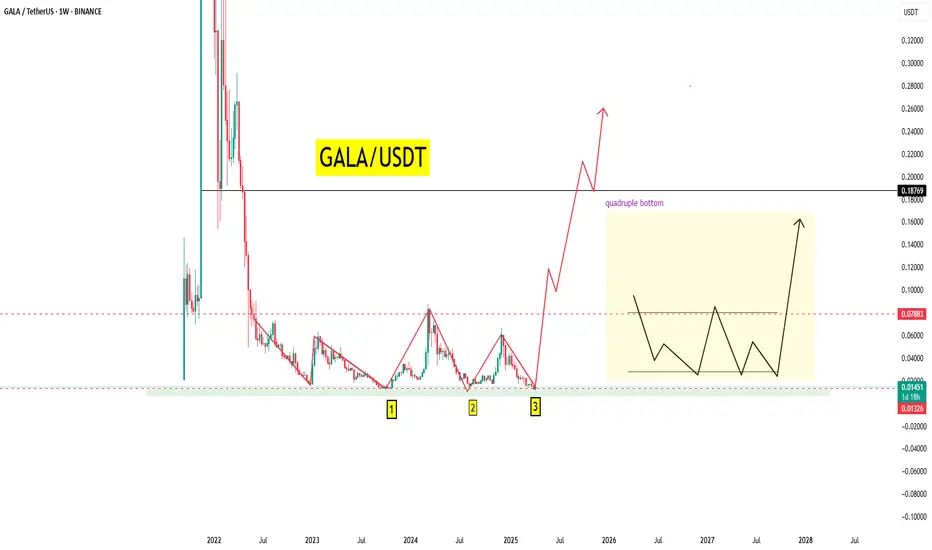
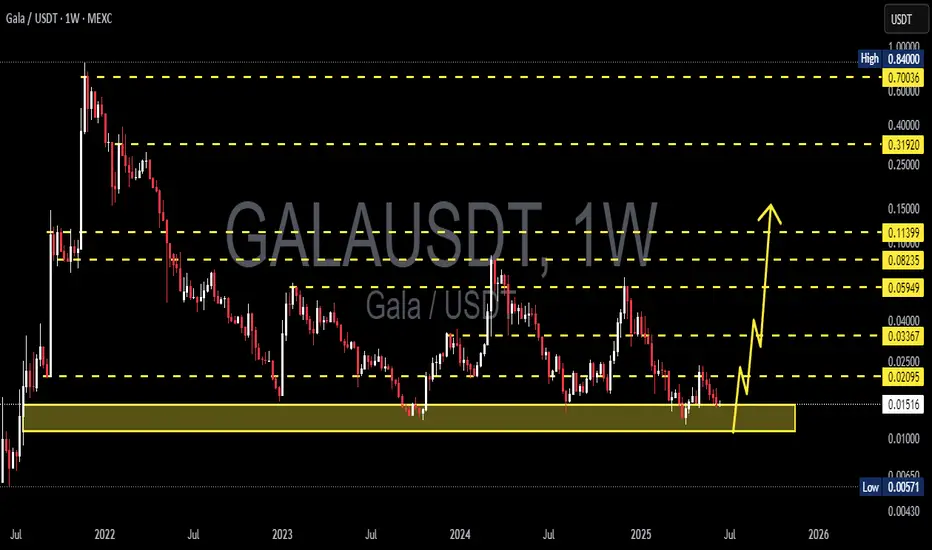
quadruple bottom In Gala GALA Coin – Quadruple Bottom Formation & Long-Term Accumulation
GALA is showing strong signs of a quadruple bottom pattern on the charts, a rare but powerful bullish reversal signal. This formation reflects a solid support level that has been tested multiple times, indicating significant buying interest and strong defense against further downside.
The accumulation zone is observed between $0.012 and $0.07, where long-term investors and smart money are gradually building positions. The price has consistently held within this range, suggesting consolidation and preparing for a potential breakout.
Given the prolonged accumulation and resilient support, a bullish bounce is anticipated within the next 3 months. If the pattern plays out, this could trigger a strong upward move as market sentiment shifts and buying volume increases.