GALAComprehensive Analysis of GALA
🔹 Project Introduction:
GALA is a blockchain-based ecosystem focused on developing decentralized gaming (GameFi) and NFTs. The project aims to give players full control over their in-game assets while introducing a new economic model for the gaming industry.
📊 Technical Analysis of GALA/USDT
🔍 Overall Market Condition:
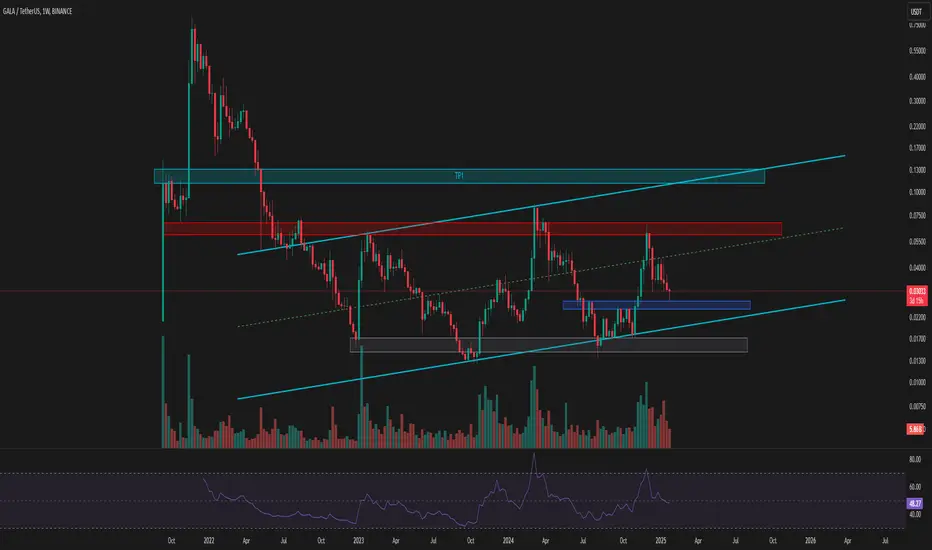
GALA is currently trading within a mid-term ascending channel and is sitting at a key support zone that will determine the next major price direction.
🟢 Bullish Scenario:
Key Support Zone:
$0.02435 – $0.02684 (Blue Box)
If this support holds, the price could move toward the midline of the ascending channel.
The next major resistance lies within the red zone:
$0.05949 – $0.06914
This resistance acts as a crucial ceiling for the price.
🚀 Potential Targets After Breaking the Red Resistance:
✅ TP1: Channel Top
✅ TP2: Breakout Above the Channel → Higher Price Levels
🔴 Bearish Scenario:
If the blue support zone fails to hold:
The price could drop to the bottom of the ascending channel + weekly support
🏁 (Gray Box)
Losing this level may trigger a new bearish trend.
📈 Trend Confirmation Factors:
✔ Increasing volume on breakouts → Confirms bullish momentum
✔ Declining volume on pullbacks → Indicates weak selling pressure
✔ RSI near 50: A move towards 70 (Overbought Zone) signals bullish strength
📌 Summary & Suggested Strategy:
🔹 Holding the blue support → Targeting the red resistance
🔹 Breaking the red resistance → Potential move towards TP1
🔹 Breakout above the channel → Strong bullish rally
🔹 Heavy rejection → Key support at the bottom of the channel (Gray Box)
⚠️Risk Management:
Monitor trading volume & RSI behavior to confirm breakouts or reversals.
GALAUSD
GALA's Explosive Potential – A Technical Outlook for 2025Current Market Structure & Momentum
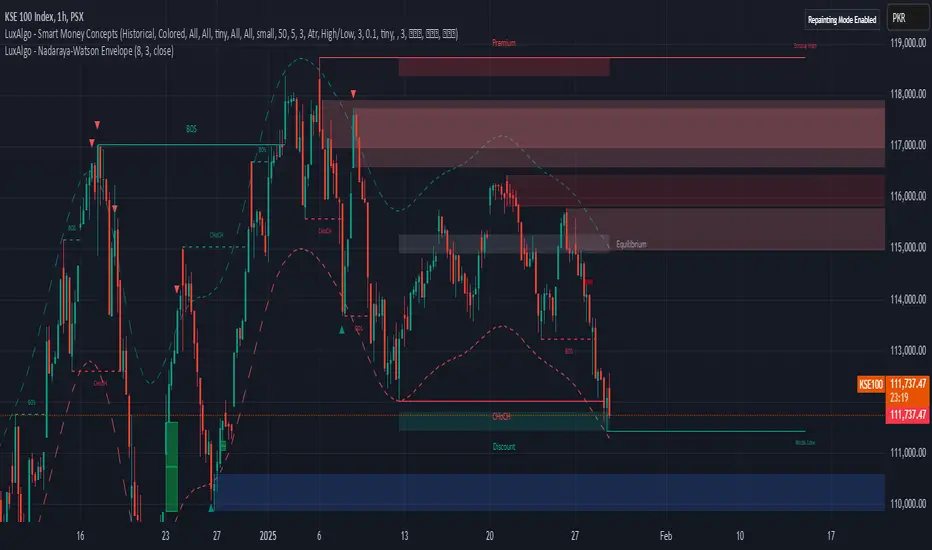
GALA is currently trading at $0.0285, up by +4.61%, showing signs of potential accumulation. The chart presents a strong historical cycle of breakouts (BOS – Break of Structure) and retracements, which typically indicate a high-volatility asset gearing up for another bullish wave.
Key Bullish Indicators
Smart Money Concepts – The presence of Buy-side Liquidity at multiple levels signals that institutional players may be accumulating. Historically, such patterns have preceded massive price surges.
Nadaraya-Watson Envelope Support – The price is currently in a discount zone, meaning this could be a prime accumulation phase before a major rally.
Historical Pump Patterns – Previous price cycles show massive price expansions following extended accumulation periods. The last breakout saw an explosive run from $0.015 to $0.08 (~+400% gain).
Price Targets & Potential Growth
If GALA follows a similar trajectory, a 300% move from the current levels would target $0.12, aligning with historical resistance zones. However, if macro factors, gaming adoption, and broader market trends support the rally, a full-scale bull run could push prices towards the $0.50 to $1.20 range in 2025.
Investor Takeaway
🔹 Current accumulation zone suggests a strong potential for an upcoming rally.
🔹 Break of key resistance levels (around $0.05-$0.07) could fuel a parabolic move.
🔹 Long-term holders and strategic investors may find this an ideal accumulation zone before a potential explosive breakout.
With increasing blockchain gaming adoption, a growing Web3 ecosystem, and GALA's historical patterns, this could be a golden opportunity to position yourself before the next wave of institutional and retail interest floods in! 🚀🔥
#GALA/USDT Ready to go up#GALA
The price is moving in a descending channel on the 1-hour frame and is adhering to it well and is heading to break it strongly upwards
We have a bounce from the lower limit of the descending channel, this support is at a price of 0.02690
We have a downtrend on the RSI indicator that is about to be broken, which supports the rise
We have a trend to stabilize above the moving average 100
Entry price 0.02900
First target 0.03073
Second target 0.03252
Third target 0.03440

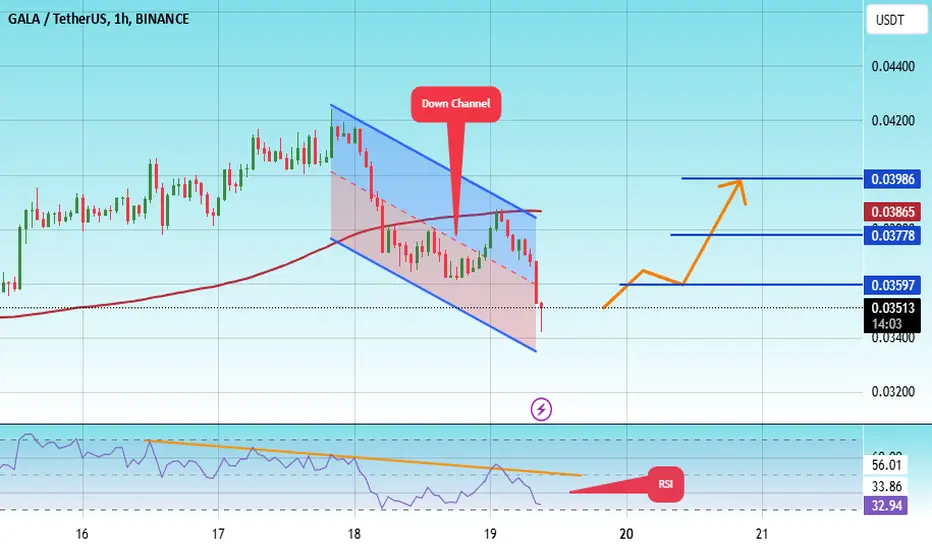
#GALA/USDT Ready to go higher#GALA
The price is moving in a descending channel on the 1-hour frame and sticking to it well
We have a bounce from the lower limit of the descending channel, this support is at 0.03330
We have a downtrend on the RSI indicator that is about to be broken, which supports the rise
We have a trend to stabilize above the moving average 100
Entry price 0.03500
First target 0.03597
Second target 0.03778
Third target 0.03986
#GALA/USDT Ready to go higher#GALA
The price is moving in a descending channel on a 15-minute frame and sticking to it well
We have a bounce from the lower limit of the descending channel, this support is at a price of 0.03532
We have a downtrend on the RSI indicator that is about to be broken, which supports the rise
We have a trend to stabilize above the moving average 100
Entry price 0.03621
First target 0.03743
Second target 0.03865
Third target 0.04017

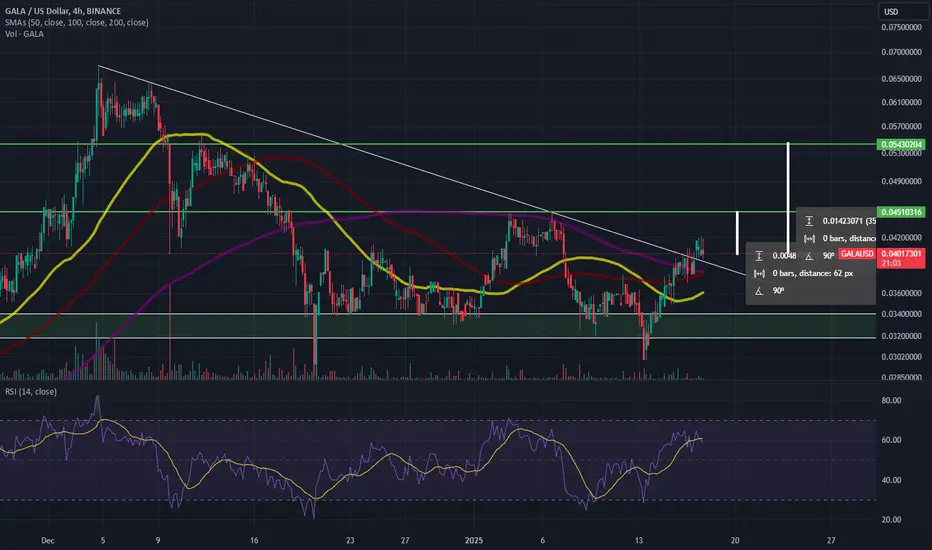
GALA/USD 4H 100-200 sma cross impendingGala is about to experience a 100-200 sma cross on the 4 hour timeframe. This is also occuring as the coin attempts to break the down trend that has been in place since December 4th of last year. Gala is back to trading above its 50, 100 and 200 sma which is a good sign. RSI is 58 at time of publishing. Levels to watch are marked with green horizontal lines. The top most line is the 1.618 extension of the previous high swing low. Gala could gain as much as 12-30% in the coming days.
Not financial advice.
Do your own DD.
Thanks for viewing the idea.
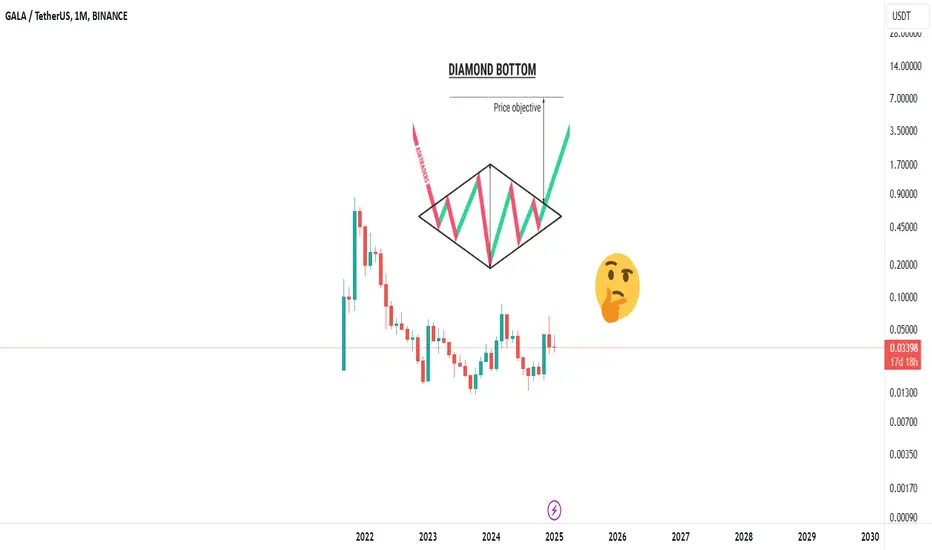
Sounds familiar!After several years of stagnation, Gala seems to be forming a familiar pattern. The well-known Diamond pattern reminds us that sooner or later we will see an explosion in this currency.
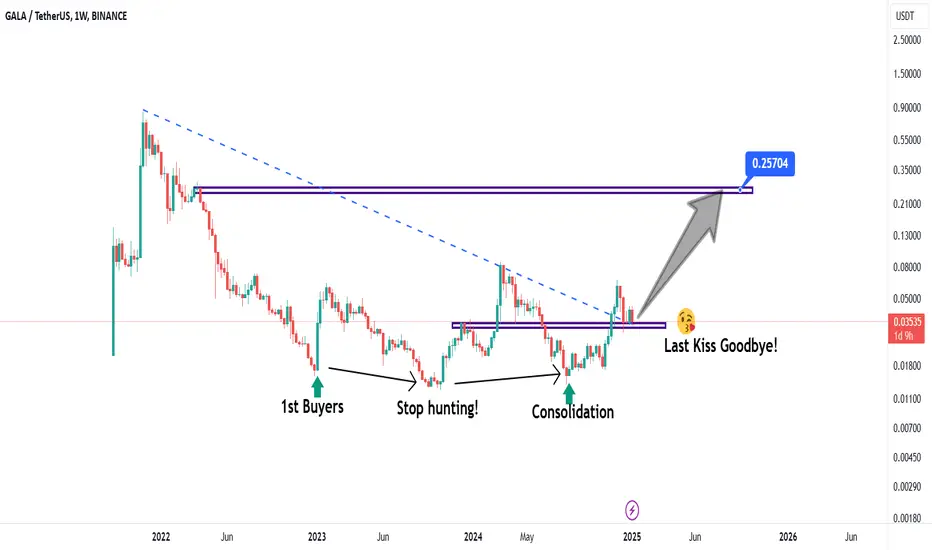
Gala Last ChanceGala is trapped in a rectangle after its 2021 growth. It seems that after a couple of failed attempts, we will see Gala grow again.
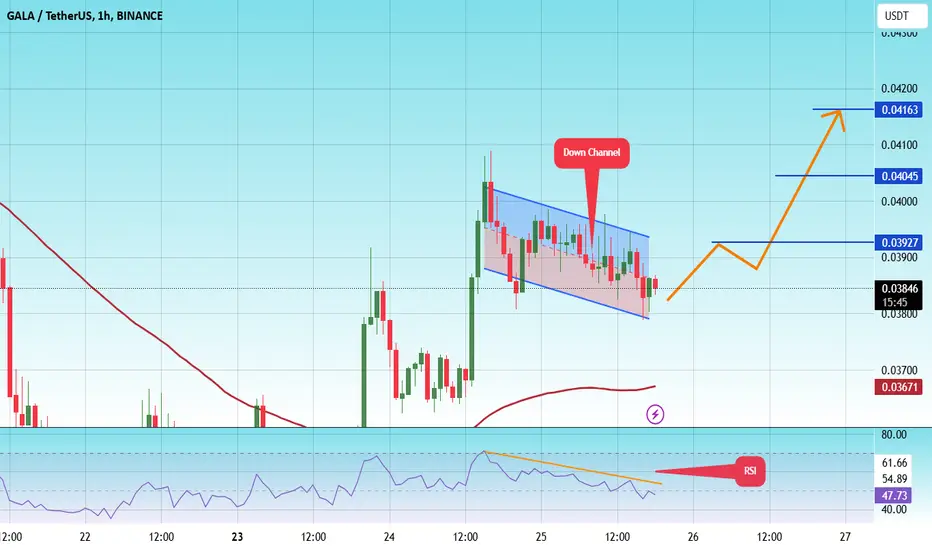
#GALA/USDT Ready to go higher#GALA
The price is moving in a descending channel on the 1-hour frame and sticking to it well
We have a bounce from the lower limit of the descending channel, this support is at 0.04080
We have a downtrend on the RSI indicator that is about to be broken, which supports the rise
We have a trend to stabilize above the moving average 100
Entry price 0.04200
First target 0.04363
Second target 0.04500
Third target 0.04650
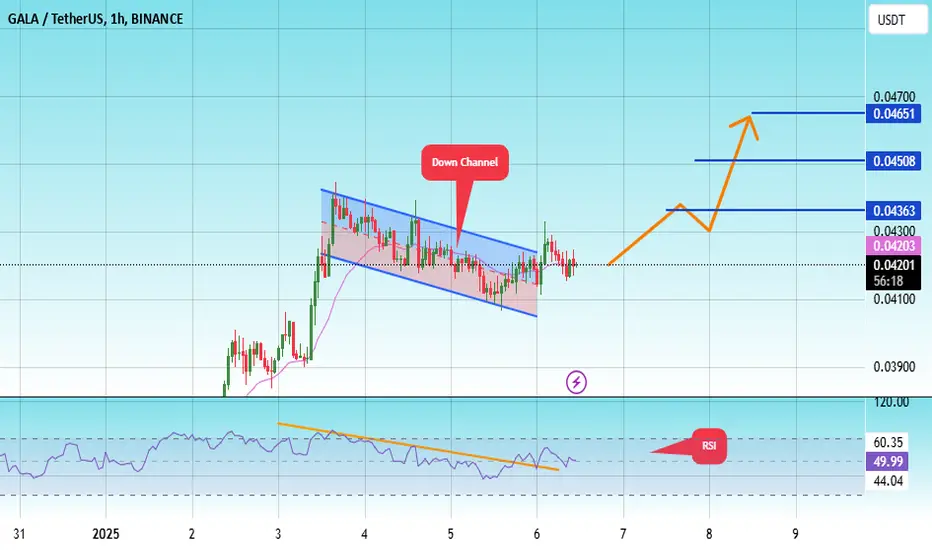
#GALA/USDT#GALA
The price is moving in a descending channel on the 1-hour frame and is expected to continue upwards
We have a trend to stabilize above the moving average 100 again
We have a descending trend on the RSI indicator that supports the rise by breaking it upwards
We have a support area at the lower limit of the channel at a price of 0.03800
Entry price 0.03856
First target 0.03927
Second target 0.04045
Third target 0.04163
GALA Bulls Must Watch This Level—A Major Move Is Coming!Yello, Paradisers! Have you been watching #GALA’s explosive move? The recent breakout from the ascending triangle pattern is sending a clear message—momentum is heating up fast, and the next pivotal level is right around the corner. But will GALA stop at just being bullish, or are we about to see it shift into hyper-bullish territory? Let’s dive in!
💎#GALAUSDT is now heading straight for a critical descending resistance zone around $0.04600. This is the level to watch! A breakout above $0.04600 would trigger a breakout after breakout setup—something that often signals major bullish strength ahead. If the bulls can smash through this level, it’s a game-changer.
💎GALA will likely be targeting $0.054 to $0.056 after clearing the resistance. But if the momentum stays intact, expect GALA to make a run higher for $0.06660, where we see the next big cluster of profit-taking. The $0.06660 to $0.07000 zone is where traders should be cautious, as this level historically brings out sellers.
💎Not only has GALA broken above its pattern, but it’s also reclaimed a major structural level between $0.0395 and $0.0410—a key zone that has acted as both support and resistance in the past. With price now holding above this level, bulls have established a solid base to build on. Below this, we see a layer of ascending and horizontal support, giving GALA strong protection on the downside.
Paradisers, this setup is looking very promising—but don’t forget, discipline and patience are key in this market.
MyCryptoParadise
iFeel the success🌴

Gala- 4h - Accumulation RangeREMEMBER that a lot of investors sell stocks or crypto for fiscal conditions in 2024 to close the year.
For that, we have low buy liquidity , and even with that pressure on the price , GALA is trying to remanin in the same range as 1 week ago, so a breakout can restart a new HH , so patience.
Im bullish on it if the 0.041usd resistance its broken and became a support.

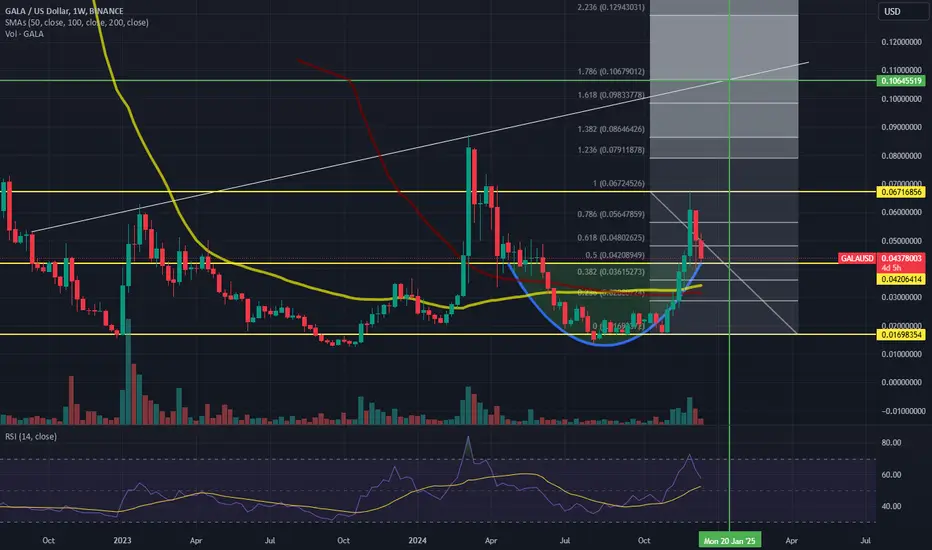
Gala Weekly Chart IdeaGala had a large break out after a cup shaped accumulation period. The price has since pullled back the .5 fibonacci level. This level lines up with the neck line of the cup and accumulation period. We have a potential for a reversal to touch the top of a rising trend line sometime around january. my target is around 10 cents. this lines up with the resistance and the 1.786 extension.
Ill be looking for a candle close above the .5 fib level. Stop loss will be around .038.
Not financial advice. Do your own DD.
Thanks for viewing the idea.
#GALA/USDT Ready to go higher#GALA
The price is moving in a descending channel on the 1-hour frame and sticking to it well
We have a bounce from the lower limit of the descending channel, this support is at 0.04280
We have a downtrend on the RSI indicator that is about to break, which supports the rise
We have a trend to stabilize above the moving average 100
Entry price 0.04338
First target 0.04550
Second target 0.04814
Third target 0.05182

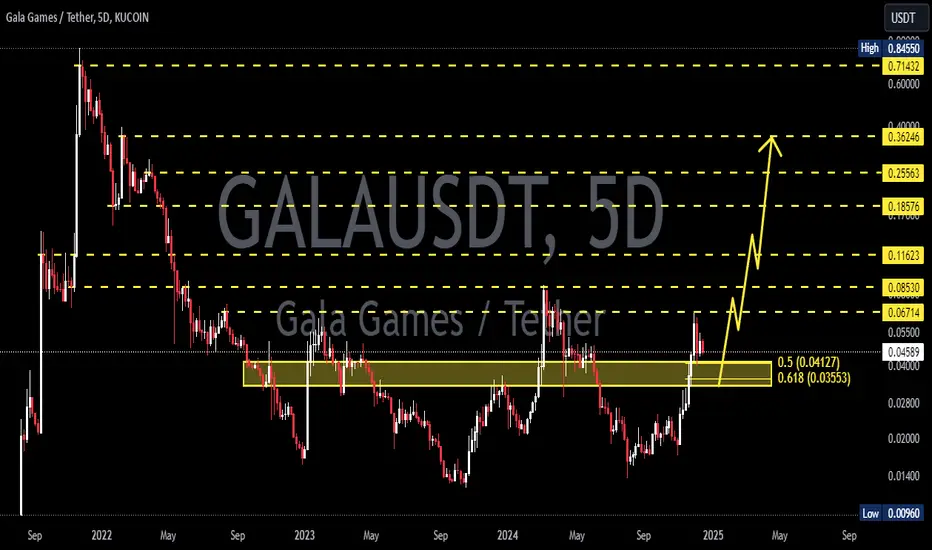
GALAUSDT 5DGALA Update ~ 5D
#GALA If you still have Conviction on this coin,. Buy gradually within this support block,. with a short term target of at least 20%++
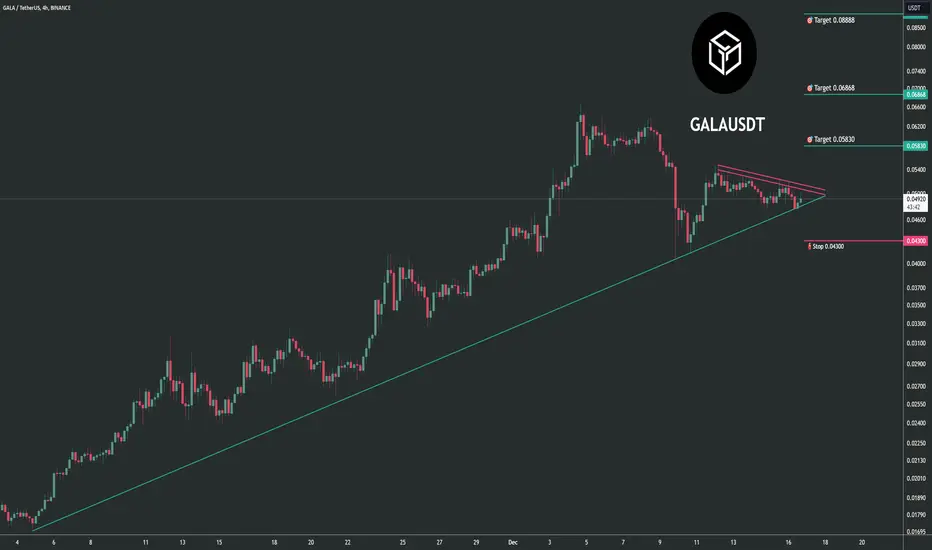
Trading opportunity for GALAUSDTBased on technical factors there is a Buy position in :
📊 GALAUSDT
🔵 Buy Now
🪫Stop loss 0.04300
🔋Target 1 0.05830
🔋Target 2 0.06868
🔋Target 3 0.08888
💸RISK : 1%
We hope it is profitable for you ❤️
Please support our activity with your likes👍 and comments📝
$GALA overviewEven though I may not be a fan of this project, but many people bought it during the accumulation zone. My expectations are quite grim compared to other projects. The target is on the chart, if it goes higher it will be good, but I have little faith in it.

#GALA/USDT Ready to go higher#GALA
The price is moving in a descending channel on the 1-hour frame and sticking to it well
We have a bounce from the lower limit of the descending channel, this support is at 0.0490
We have a downtrend on the RSI indicator that is about to be broken, which supports the rise
We have a trend to stabilize above the moving average 100
Entry price 0.04519
First target 0.05150
Second target 0.05615
Third target 0.06092

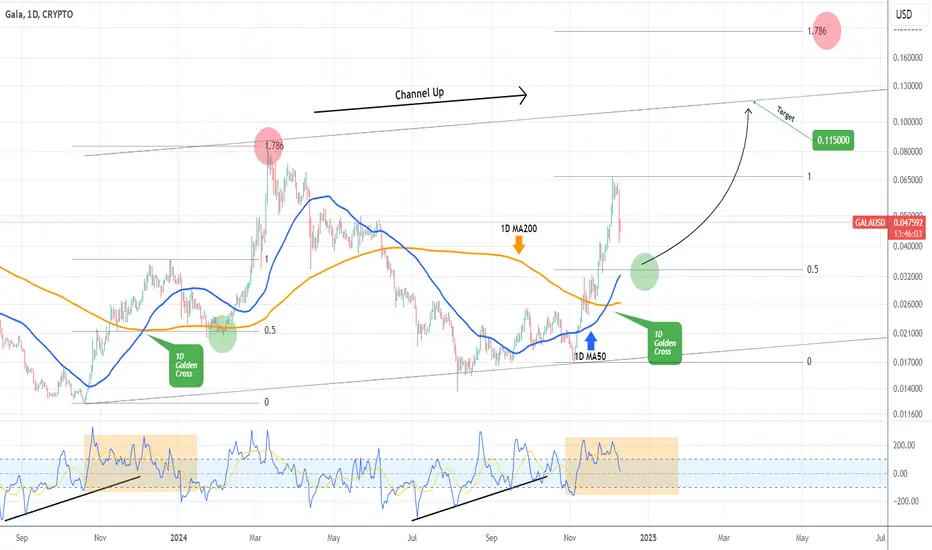
GALAUSD This pull-back is a great buy opportunity.Gala (GALAUSD) gave us an excellent buy signal on our previous call (August 23, see chart below) as after some consolidation, it rebounded aggressively to its 0.786 Fibonacci and hit our 0.0600 Target:
This week's pull-back may be aggressive but so far is only a technical correction towards the 1D MA50 (blue trend-line). Its recent Golden Cross with the 1D MA200 (orange trend-line) on November 30, is the first such formation in 1 whole year (last one on December 05 2023).
As you can see, the two fractals are not identical but share certain symmetric similarities (also on CCI terms), so it is possible for this pull-back to reach as low as the 0.5 Fibonacci retracement level and then rebound.
Even though the March 10 2024 High was priced on the 1.786 Fibonacci extension, our next Target should be within the 1-year Channel Up (until broken), so we will be aiming for 0.11500.
-------------------------------------------------------------------------------
** Please LIKE 👍, FOLLOW ✅, SHARE 🙌 and COMMENT ✍ if you enjoy this idea! Also share your ideas and charts in the comments section below! This is best way to keep it relevant, support us, keep the content here free and allow the idea to reach as many people as possible. **
-------------------------------------------------------------------------------
💸💸💸💸💸💸
👇 👇 👇 👇 👇 👇
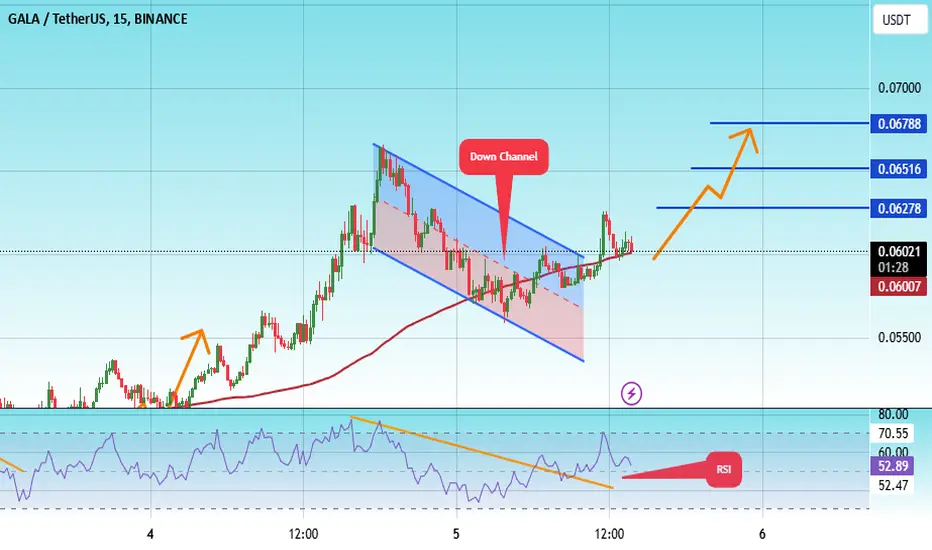
#GALA/USDT Ready to go higher#GALA
The price is moving in a descending channel on a 15-minute frame and sticking to it well
We have a bounce from the lower limit of the descending channel, this support is at 0.05630
We have a downtrend on the RSI indicator that is about to be broken, which supports the rise
We have a trend to stabilize above the moving average 100
Entry price 0.06035
First target 0.06278
Second target 0.06516
Third target 0.06788
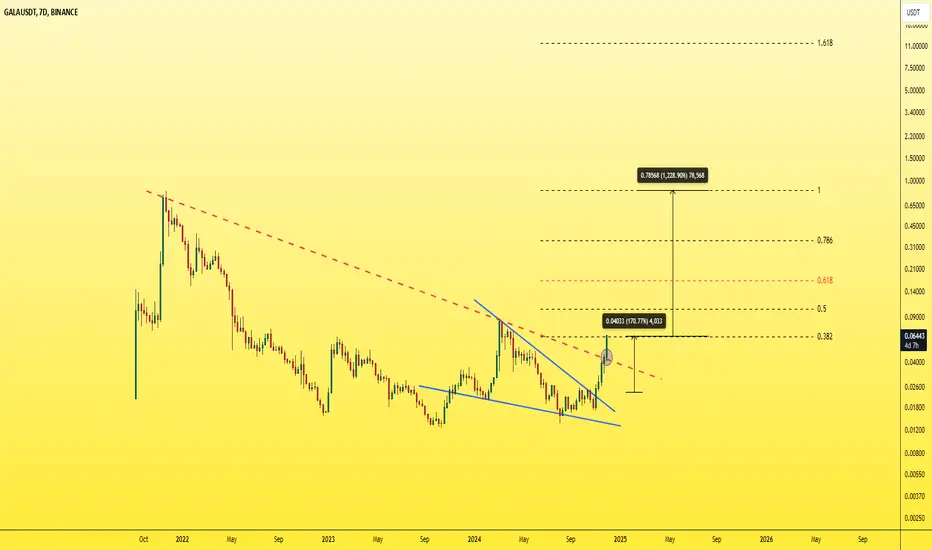
GALAUSDT - preparing for the biggest moveOne of the most importanr coins in gaming sector... with a strong promising project
weekly chart display
- rise of 170% after breakout the falling wedge
- succefull breakout , retest of the major trendline
targets:
1- 0.16 (200%)
2- (0.87) (1300%)
Best regards Ceciliones🎯
#GALA/USDT Ready to go higher#GALA
The price is moving in a descending channel on the 30-minute frame and sticking to it well
We have a bounce from the lower limit of the descending channel, this support is at 0.04650
We have a downtrend on the RSI indicator that is about to be broken, which supports the rise
We have a trend to stabilize above the moving average 100
Entry price 0.04814
First target 005097
Second target 0.05316
Third target 0.005573
