ACTBUSD I Weekly CLS I Easy Pump to 0.15 - ResistanceFresh Crypto Analysis — You know I have recently posted few low caps and this another one. this coin can pump to 0.15 easily.
If you’ve been riding with me, you already know:
🎯My system is 100% mechanical. No emotions. No trend lines. No subjective guessing. Working all timeframes. Just precision, structure, and sniper entries.
🧠 What’s CLS?
It’s the real smart money. The invisible hand behind $7T/day — banks, algos, central players.
📍Model 1:
HTF bias based on the daily and weekly candles closes,
Wait for CLS candle to be created and manipulated. Switch to correct LTF and spot CIOD. Enter and target 50% of the CLS candle.
For high probability include Dealing Ranges, Weekly Profiles and CLS Timing.
Analysis done on the Tradenation Charts
Disclosure: I am part of Trade Nation's Influencer program and receive a monthly fee for using their TradingView charts in my analysis.
Trading is like a sport. If you consistently practice you can learn it.
“Adapt what is useful. Reject whats useless and add whats is specifically yours.”
David Perk aka Dave FX Hunter
💬 Comment any Coin I ll give you my quick view
Gann

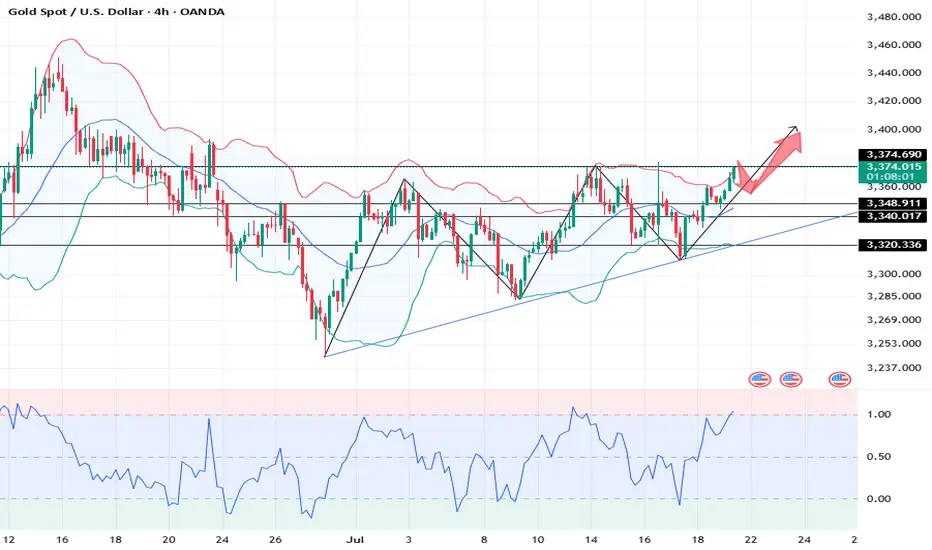
Gold is rising steadily.Gold technical analysis
Daily chart resistance: 3400, support: 3320
Four-hour chart resistance: 3390, support: 3340
One-hour chart resistance: 3375, support: 3348.
After bottoming out last Thursday, gold began to fluctuate upward on Friday, and the 1-hour bottom structure reappeared, which indicates that a new bullish opportunity has appeared again! It is worth noting that after breaking through 3344 on Friday, it continued to rise to around 3360. Today, after retreating to 3444 in the Asian session, it rose again. 3344 has become the top and bottom conversion position, so we can buy on dips based on the support of 3344. The second is the support at 3331.
In terms of intraday operations, the support below is 3344 and 3331, and it may not fall to around 3344. It is probably waiting to buy in the 3350-55 area. Pay attention to the key resistance around 3377 above. After the 15-minute top pattern appears, sell near this area.
Sell: 3375near
Buy: 3355near
Buy Trade Strategy for LINK: Powering Smart Contracts with RealDescription:
This trading idea is centered on LINK, the native token of the Chainlink network—one of the most crucial infrastructures in the blockchain ecosystem. LINK fuels decentralized oracles that connect smart contracts with real-world data, enabling everything from DeFi platforms to insurance protocols and gaming applications. With countless integrations across blockchains and institutional partnerships, Chainlink has positioned itself as a foundational layer for Web3 development. The growing need for reliable, tamper-proof data feeds strengthens the long-term fundamentals of LINK.
That said, the crypto market remains highly speculative and volatile. The price and adoption of LINK can be significantly impacted by macroeconomic conditions, regulatory developments, and overall market sentiment. As promising as the project may be, investing in it should always be approached with caution and a solid risk management strategy.
Disclaimer:
This trading idea is provided solely for educational purposes and should not be considered financial advice. Trading cryptocurrencies like LINK involves substantial risks, including the risk of complete capital loss. Always conduct your own research, evaluate your financial situation carefully, and consult with a licensed financial advisor before making any investment decisions. Past performance is not indicative of future results.

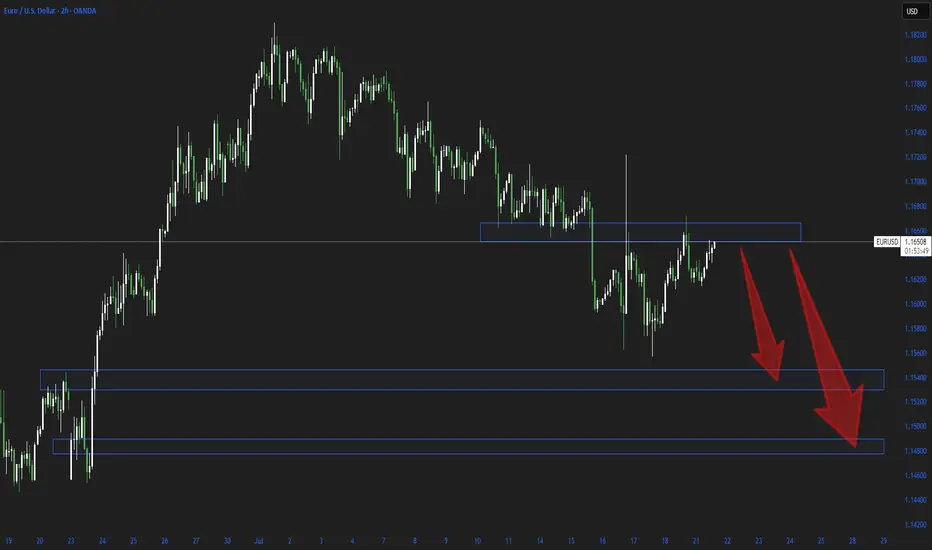
EURUSD Considering the higher timeframe trend, I expect further downside in price.
It has reached a key price level on this same timeframe, and I anticipate a rejection from this area.
The highlighted blue zones represent the target levels for EUR/USD.
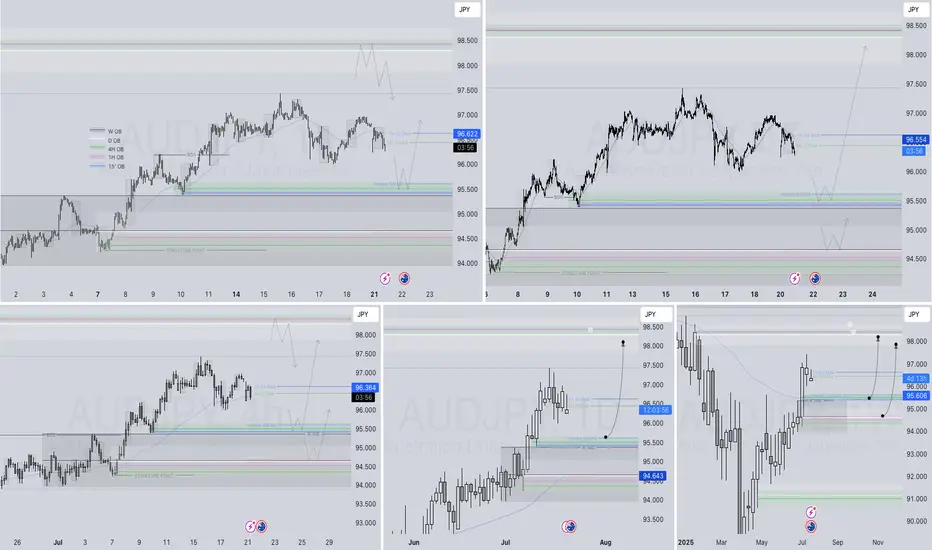
AUDJPY Q3 | D21 | W30 | Y25📊AUDJPY Q3 | D21 | W30 | Y25
Daily Forecast 🔍📅
Here’s a short diagnosis of the current chart setup 🧠📈
Higher time frame order blocks have been identified — these are our patient points of interest 🎯🧭.
It’s crucial to wait for a confirmed break of structure 🧱✅ before forming a directional bias.
This keeps us disciplined and aligned with what price action is truly telling us.
📈 Risk Management Protocols
🔑 Core principles:
Max 1% risk per trade
Only execute at pre-identified levels
Use alerts, not emotion
Stick to your RR plan — minimum 1:2
🧠 You’re not paid for how many trades you take, you’re paid for how well you manage risk.
🧠 Weekly FRGNT Insight
"Trade what the market gives, not what your ego wants."
Stay mechanical. Stay focused. Let the probabilities work.
FRGNT 📊
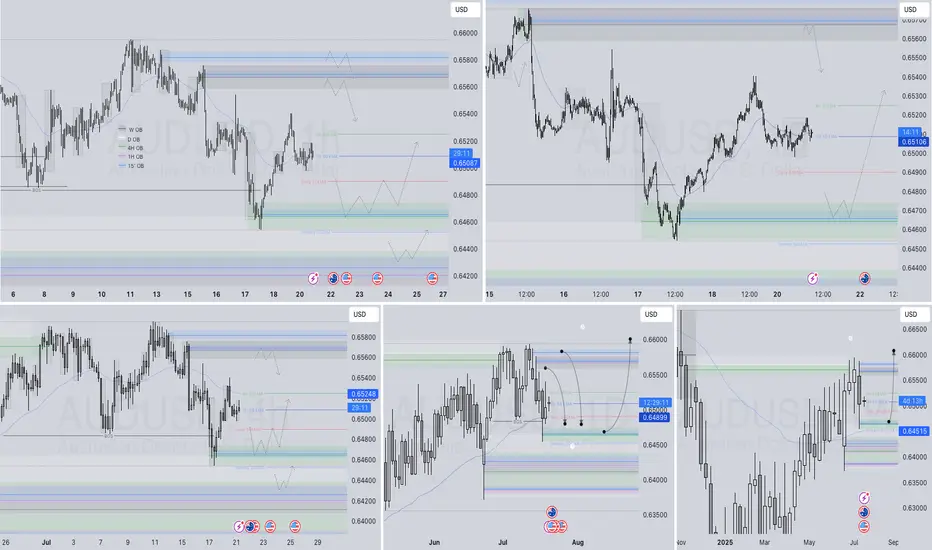
AUDUSD Q3 | D21 | W30 | Y25📊AUDUSD Q3 | D21 | W30 | Y25
Daily Forecast 🔍📅
Here’s a short diagnosis of the current chart setup 🧠📈
Higher time frame order blocks have been identified — these are our patient points of interest 🎯🧭.
It’s crucial to wait for a confirmed break of structure 🧱✅ before forming a directional bias.
This keeps us disciplined and aligned with what price action is truly telling us.
📈 Risk Management Protocols
🔑 Core principles:
Max 1% risk per trade
Only execute at pre-identified levels
Use alerts, not emotion
Stick to your RR plan — minimum 1:2
🧠 You’re not paid for how many trades you take, you’re paid for how well you manage risk.
🧠 Weekly FRGNT Insight
"Trade what the market gives, not what your ego wants."
Stay mechanical. Stay focused. Let the probabilities work.
FRGNT 📊
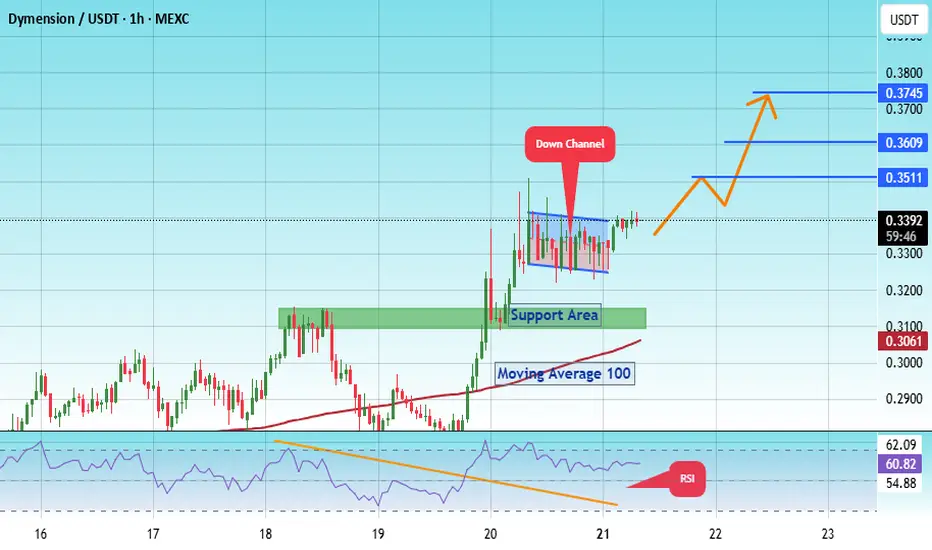
#DYM/USDT Dymension's Falling Wedge #DYM
The price is moving within a descending channel on the 1-hour frame, adhering well to it, and is on its way to breaking strongly upwards and retesting it.
We have support from the lower boundary of the descending channel, at 0.3250.
We have a downtrend on the RSI indicator that is about to be broken and retested, supporting the upside.
There is a major support area in green at 0.3113, which represents a strong basis for the upside.
Don't forget a simple thing: ease and capital.
When you reach the first target, save some money and then change your stop-loss order to an entry order.
For inquiries, please leave a comment.
We have a trend to hold above the 100 Moving Average.
Entry price: 0.3396
First target: 0.3511
Second target: 0.3610
Third target: 0.3745
Don't forget a simple thing: ease and capital.
When you reach your first target, save some money and then change your stop-loss order to an entry order.
For inquiries, please leave a comment.
Thank you.
#PEOPLE/USDT Breakout in Action !#PEOPLE
The price is moving within a descending channel on the 1-hour frame, adhering well to it, and is on its way to breaking strongly upwards and retesting it.
We have support from the lower boundary of the descending channel, this support is at 2390.
We have a downtrend on the RSI indicator that is about to be broken and retested, supporting the upside.
There is a major support area in green at 0.02330, which represents a strong basis for the upside.
Don't forget a simple thing: ease and capital.
When you reach the first target, save some money and then change your stop-loss order to an entry order.
For inquiries, please leave a comment.
We have a trend to hold above the 100 Moving Average.
Entry price: 0.02492
First target: 0.02546
Second target: 0.02614
Third target: 0.02707
Don't forget a simple thing: ease and capital.
When you reach the first target, save some money and then change your stop-loss order to an entry order.
For inquiries, please leave a comment.
Thank you.

USDJPY Q3 | D21 | W30 | Y25 15' OB UPDATE 📊USDJPY Q3 | D21 | W30 | Y25 15' OB UPDATE
Daily Forecast 🔍📅
Here’s a short diagnosis of the current chart setup 🧠📈
Higher time frame order blocks have been identified — these are our patient points of interest 🎯🧭.
It’s crucial to wait for a confirmed break of structure 🧱✅ before forming a directional bias.
This keeps us disciplined and aligned with what price action is truly telling us.
📈 Risk Management Protocols
🔑 Core principles:
Max 1% risk per trade
Only execute at pre-identified levels
Use alerts, not emotion
Stick to your RR plan — minimum 1:2
🧠 You’re not paid for how many trades you take, you’re paid for how well you manage risk.
🧠 Weekly FRGNT Insight
"Trade what the market gives, not what your ego wants."
Stay mechanical. Stay focused. Let the probabilities work.
FRGNT 📊

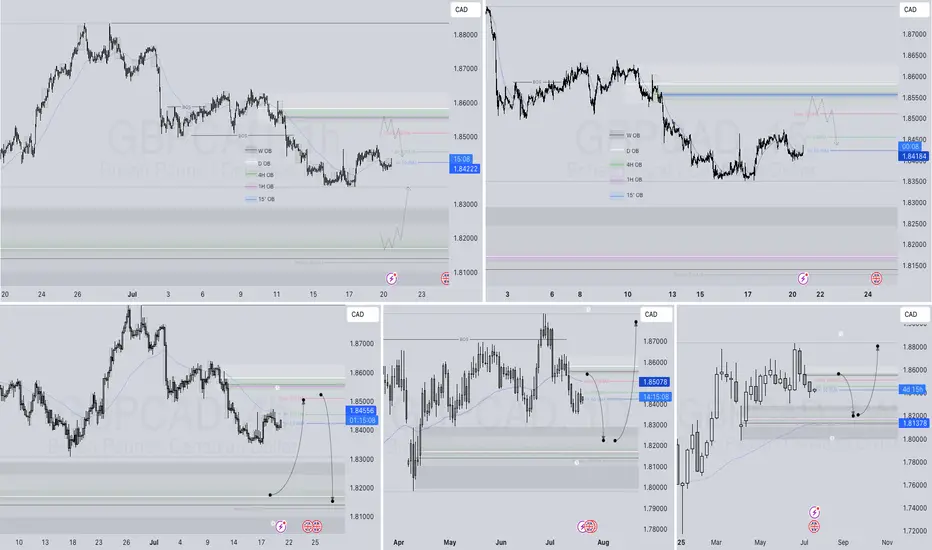
GBPCAD Q3 | D21 | W30 | Y25📊GBPCAD Q3 | D21 | W30 | Y25
Daily Forecast 🔍📅
Here’s a short diagnosis of the current chart setup 🧠📈
Higher time frame order blocks have been identified — these are our patient points of interest 🎯🧭.
It’s crucial to wait for a confirmed break of structure 🧱✅ before forming a directional bias.
This keeps us disciplined and aligned with what price action is truly telling us.
📈 Risk Management Protocols
🔑 Core principles:
Max 1% risk per trade
Only execute at pre-identified levels
Use alerts, not emotion
Stick to your RR plan — minimum 1:2
🧠 You’re not paid for how many trades you take, you’re paid for how well you manage risk.
🧠 Weekly FRGNT Insight
"Trade what the market gives, not what your ego wants."
Stay mechanical. Stay focused. Let the probabilities work.
FRGNT 📊
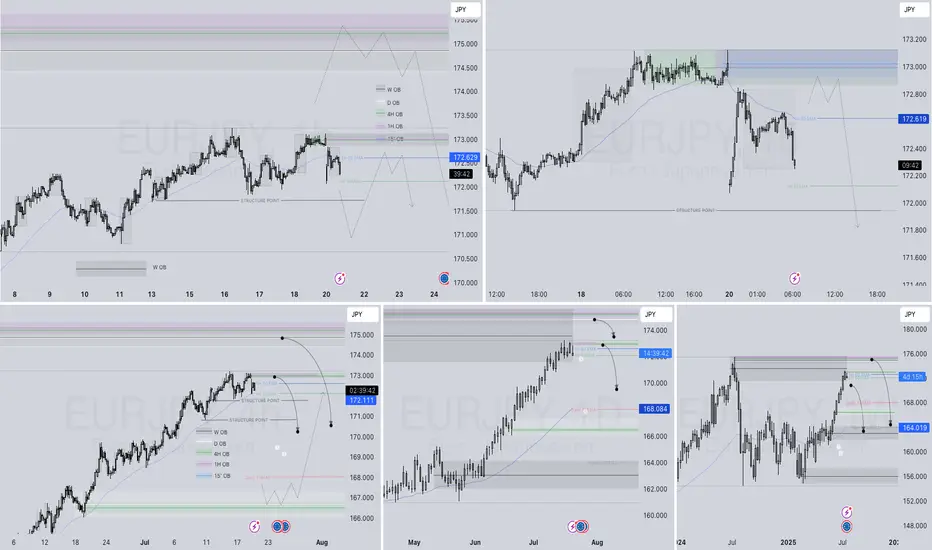
EURJPY Q3 | D21 | W30 | Y25📊EURJPY Q3 | D21 | W30 | Y25
Daily Forecast 🔍📅
Here’s a short diagnosis of the current chart setup 🧠📈
Higher time frame order blocks have been identified — these are our patient points of interest 🎯🧭.
It’s crucial to wait for a confirmed break of structure 🧱✅ before forming a directional bias.
This keeps us disciplined and aligned with what price action is truly telling us.
📈 Risk Management Protocols
🔑 Core principles:
Max 1% risk per trade
Only execute at pre-identified levels
Use alerts, not emotion
Stick to your RR plan — minimum 1:2
🧠 You’re not paid for how many trades you take, you’re paid for how well you manage risk.
🧠 Weekly FRGNT Insight
"Trade what the market gives, not what your ego wants."
Stay mechanical. Stay focused. Let the probabilities work.
FRGNT 📊
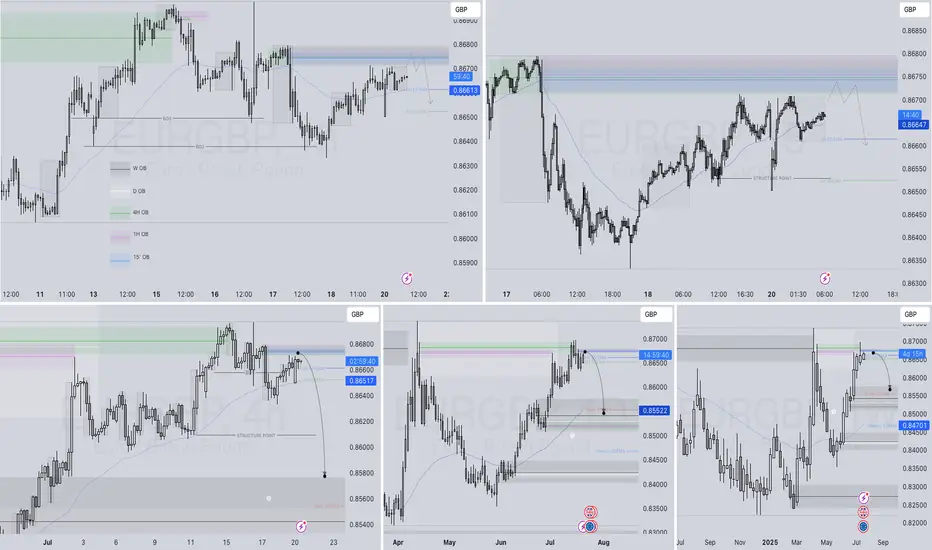
EURGBP Q3 | D21 | W30 | Y25📊EURGBP Q3 | D21 | W30 | Y25
Daily Forecast 🔍📅
Here’s a short diagnosis of the current chart setup 🧠📈
Higher time frame order blocks have been identified — these are our patient points of interest 🎯🧭.
It’s crucial to wait for a confirmed break of structure 🧱✅ before forming a directional bias.
This keeps us disciplined and aligned with what price action is truly telling us.
📈 Risk Management Protocols
🔑 Core principles:
Max 1% risk per trade
Only execute at pre-identified levels
Use alerts, not emotion
Stick to your RR plan — minimum 1:2
🧠 You’re not paid for how many trades you take, you’re paid for how well you manage risk.
🧠 Weekly FRGNT Insight
"Trade what the market gives, not what your ego wants."
Stay mechanical. Stay focused. Let the probabilities work.
FRGNT 📊
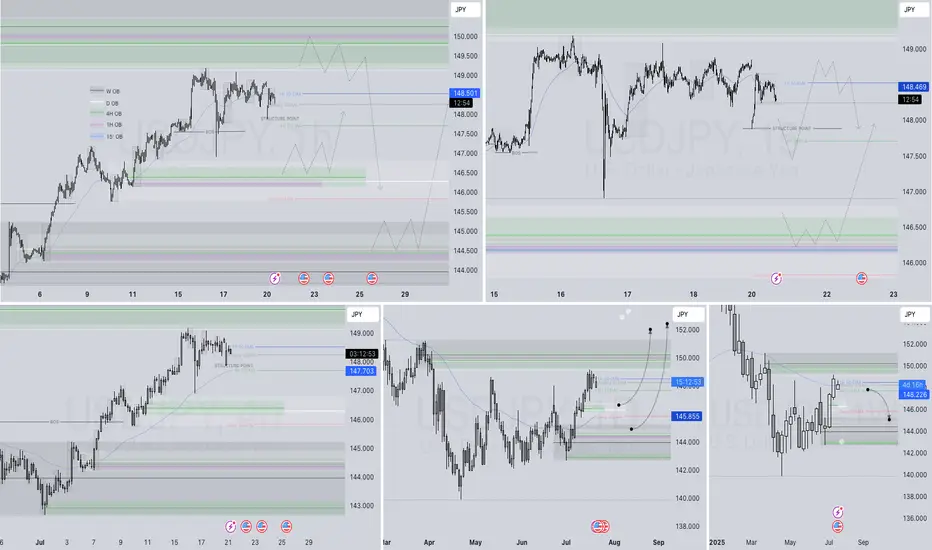
USDJPY Q3 | D21 | W30 | Y25📊USDJPY Q3 | D21 | W30 | Y25
Daily Forecast 🔍📅
Here’s a short diagnosis of the current chart setup 🧠📈
Higher time frame order blocks have been identified — these are our patient points of interest 🎯🧭.
It’s crucial to wait for a confirmed break of structure 🧱✅ before forming a directional bias.
This keeps us disciplined and aligned with what price action is truly telling us.
📈 Risk Management Protocols
🔑 Core principles:
Max 1% risk per trade
Only execute at pre-identified levels
Use alerts, not emotion
Stick to your RR plan — minimum 1:2
🧠 You’re not paid for how many trades you take, you’re paid for how well you manage risk.
🧠 Weekly FRGNT Insight
"Trade what the market gives, not what your ego wants."
Stay mechanical. Stay focused. Let the probabilities work.
FRGNT 📊
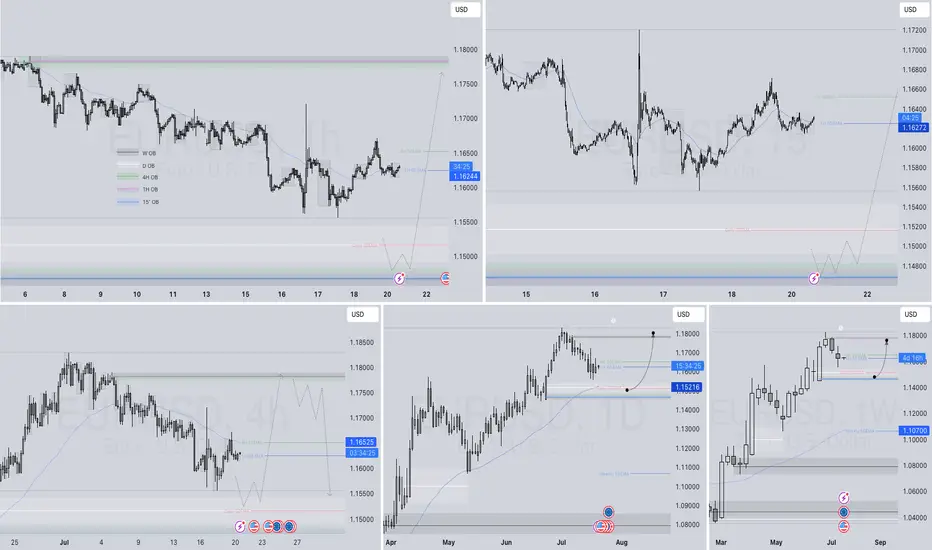
EURUSD Q3 | D21 | W30 | Y25 📊EURUSD Q3 | D21 | W30 | Y25
Daily Forecast 🔍📅
Here’s a short diagnosis of the current chart setup 🧠📈
Higher time frame order blocks have been identified — these are our patient points of interest 🎯🧭.
It’s crucial to wait for a confirmed break of structure 🧱✅ before forming a directional bias.
This keeps us disciplined and aligned with what price action is truly telling us.
📈 Risk Management Protocols
🔑 Core principles:
Max 1% risk per trade
Only execute at pre-identified levels
Use alerts, not emotion
Stick to your RR plan — minimum 1:2
🧠 You’re not paid for how many trades you take, you’re paid for how well you manage risk.
🧠 Weekly FRGNT Insight
"Trade what the market gives, not what your ego wants."
Stay mechanical. Stay focused. Let the probabilities work.
FRGNT 📊
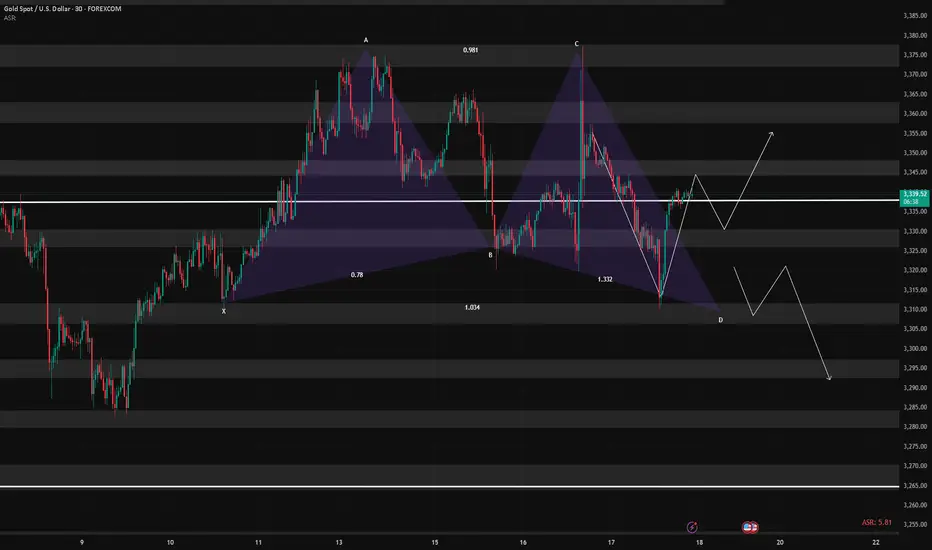
7/18: Watch 3343 Resistance, Guard Against Break Below 3323Good morning, everyone!
Yesterday, gold broke below the 3337 support after consolidating there, driven lower by bearish data, and eventually reached the 3323–3312 support zone. A rebound followed, and price has now returned above 3323, which also aligns with the daily MA60.
📌 Key Levels to Watch Today:
Resistance: 3343 / 3352–3358
→ A sustained break above 3343 opens the door for a potential move toward 3366 / 3372–3378;
Support: 3323 / 3312
→ If price remains capped below resistance and weekly close is under 3323, it will signal bearish structural pressure for the medium term.
📌 Trading Strategy:
Trade flexibly within the range of 3358–3343–3332–3323–3312
📌 Important Reminder:
If today’s closing price is below 3323, and you're planning to hold positions over the weekend, it’s safer to lean short. While we can’t predict weekend news, technically, bears have the upper hand, so risk control is essential.
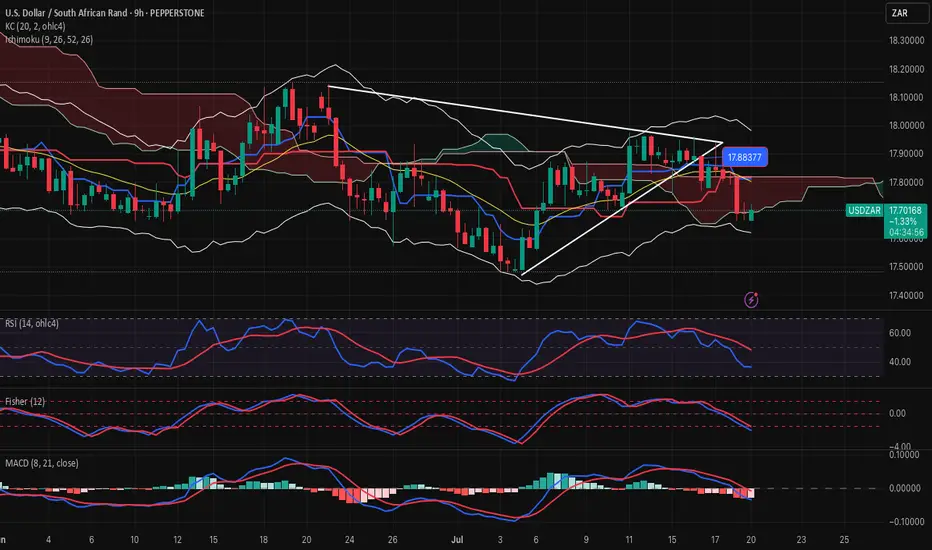
USDZAR-BUY strategy 9 hourly chart The pair is remaining to be within a larger trading band. We are in negative mode, but slightly becoming oversold. Based on the ranges we have seen, one could attempt to be in BUYING mode, but careful as always. gold is strong, but am still having the view to see recovery. Other assets(if we wish to use that term) like BTC and ETH are also overbought, and could drag gold down, hence an improvement for USDZAR over time.
Strategy BUY @ 17.6875-17.7350 and take profit near 17.8875 again.
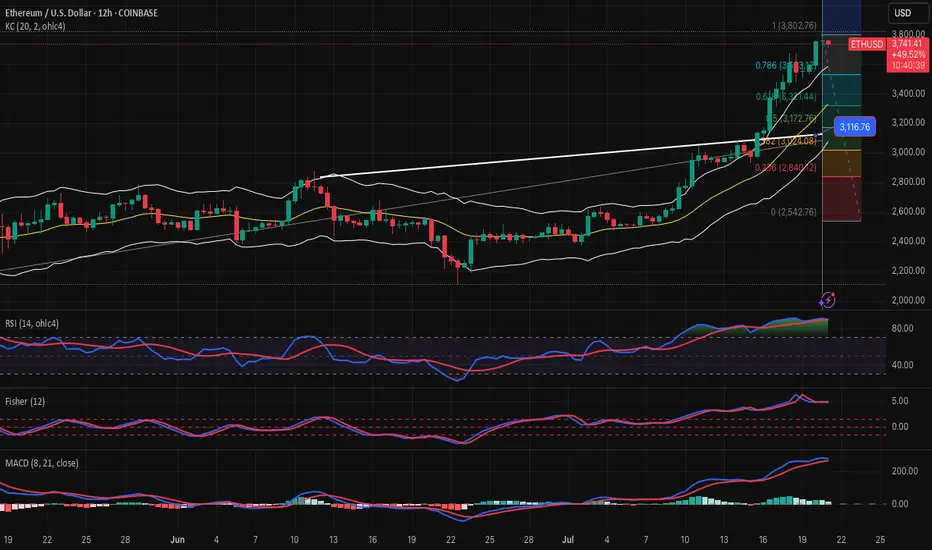
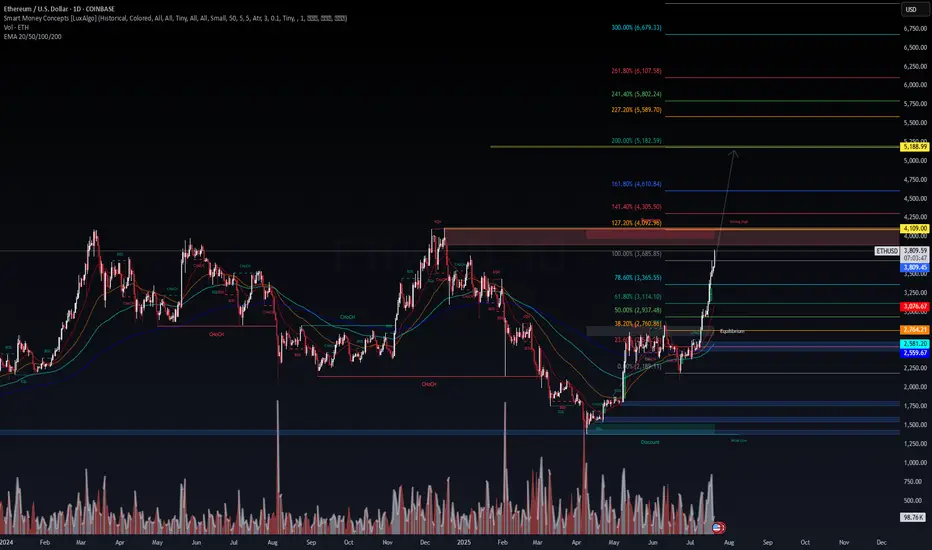
ETHUSD-SELL strategy 12 hourly chart REG CHANNELAs always crypto movements are severe, and one can never judge the corrective timings. Overall the view remains the same, and when carefully scaling in, is always warrented and proper risk management strategies.
Strategy SELL @ $ 3,675-3,750 area and take profit @ $ 3,175 area. On previous shorts if applicable, scale down slowly.
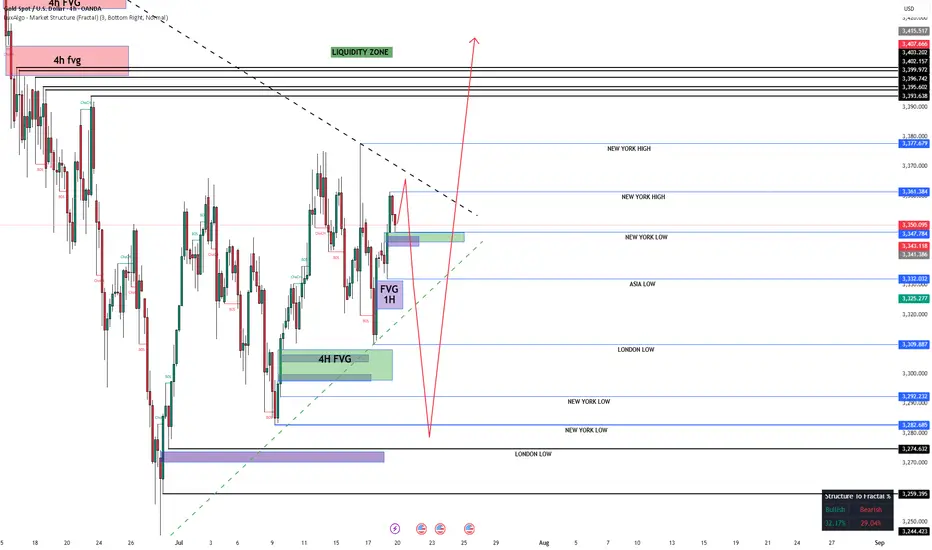
XAU/USD WEEK SCENARIO 🕳️ Possible Liquidity Sweep Below 3282 → Looking for Move Above 3400 🚀
On the 4H chart, a potential liquidity grab setup is forming just below the 3282 swing low — an area where many stop-loss orders are likely stacked.
🔎 I anticipate a stop hunt move beneath this level, triggering short positions and shaking out early buyers.
⚡ If price reacts strongly after this sweep, it could confirm a bullish reversal, signaling momentum shift.
🎯 Next target: A move above 3400, where we could see a liquidity cluster and possible resistance.
📅 Watching closely in the upcoming sessions for confirmation.
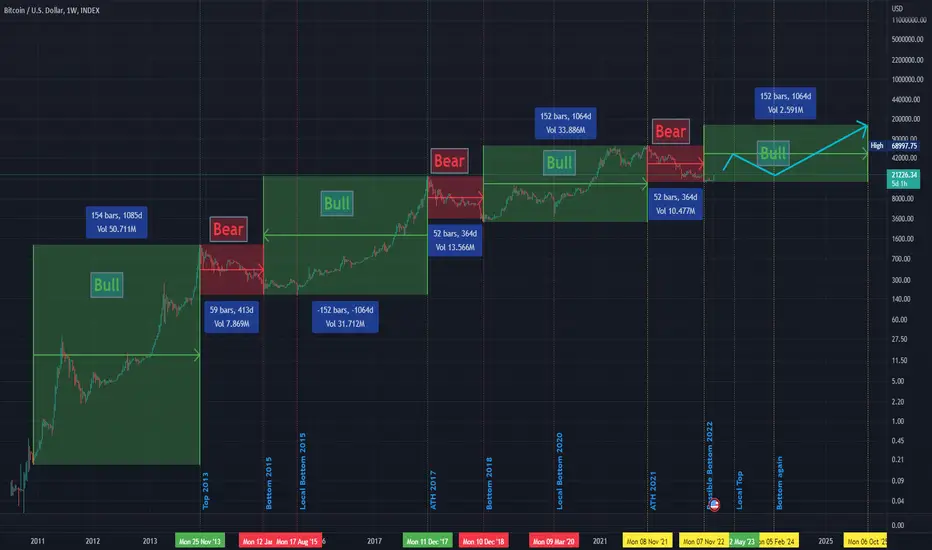
BTC Bull & Bear historical Periods 3 Bull & Bear Markets
Bull markets took around 152 weeks...
then
V
v
v
v
v
Bear Markets took around 52-59 weeks..
then
v
v
v
v
v
v
v
Bull Market gain...
----------------------------------------------------------------------------------------------------------
After 2021 ATH
BTC recorded his current bottom after 52 weeks ( 15500 $).
BTC pumped after 59 weeks .
then what ?
Will the history will repeat itself again ??
if we will be alive inshallah ,we will see the next 152 weeks to ( October - November 2025 ) if this will be the New ATH of the next bull market or not :D
It is not a financial advice , PLZ DYOR
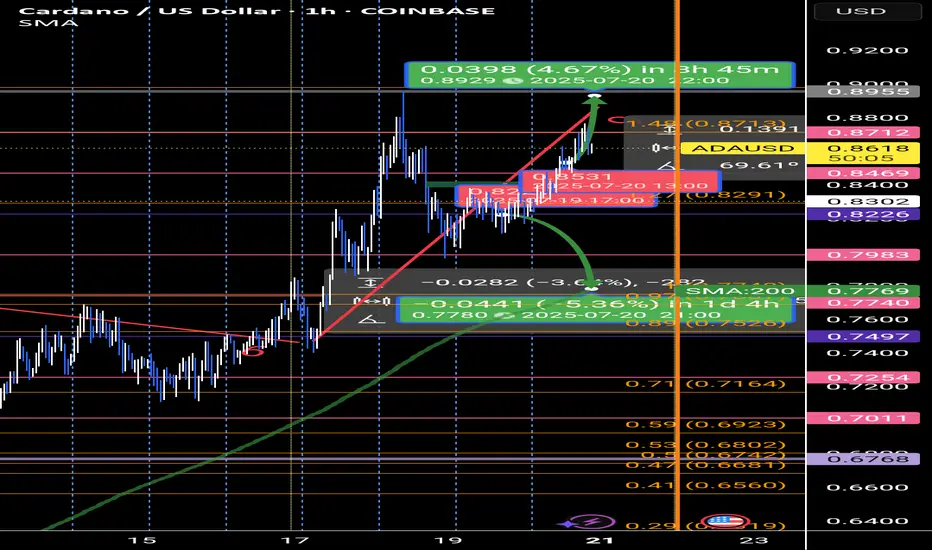
UPDATE ADA FORCAST🔄 When Time Speaks, Price Listens
#TimeAnalysis | #Cardano | #ADAUSDT | #SmartTrading
In my previous ADA/USDT analysis, the mistake wasn’t in the price structure—it was in the timing.
The price didn’t reverse where expected, not because the setup was wrong, but because I ignored one critical factor:
The time cycle must align with the price cycle.
📌 Here's what really happened:
From July 2 to July 7, price moved sideways in a clear accumulation range.
Then came an explosive expansion wave (Wave 3) from 0.573 to 0.75, lasting 113 hourly candles.
This was followed by a correction wave (Wave 6) of 130 candles.
Currently, price is in a distribution wave (Wave 9), ongoing for over 90 candles.
📉 My error? Misalignment between time and price.
📆 After applying my fixed monthly time cycle model, based on the rule that 9 marks the end of every cycle,
it became obvious that the price waves were following exact temporal intervals:
➡️ Monthly cycle anchor points:
(8 Jan, 7 Feb, 6 Mar, ..., 9 Sep, 8 Oct...)
Each month is divided into 3 major time zones, and each zone into two sub-zones.
This creates a clean framework where waves naturally unfold:
🔹 3 = Expansion
🔹 6 = Correction
🔹 9 = Distribution
💡 Key Takeaways:
Don’t trade predictions. Trade the wave.
Every price move is governed by time.
Ignoring time leads to premature entries—even with solid technical analysis.
🧠 Want to learn how to read these time-price cycles? Let’s discuss in the comments.
gkgj,hgfj- SUI is currently trading near the resistance line. Price was reject around this resistance line in the previous pump.
- Given the current bullish market, price is expected to breakout from this resistance easily
Entry Price: 4.04
StopLoss: 3.2
TP1: 4.5059
TP2: 5.3810
TP3: 6.5106
TP4: 7.8772
TP5: 10+
Don't forget to set stoploss.
Stay tuned for more updates

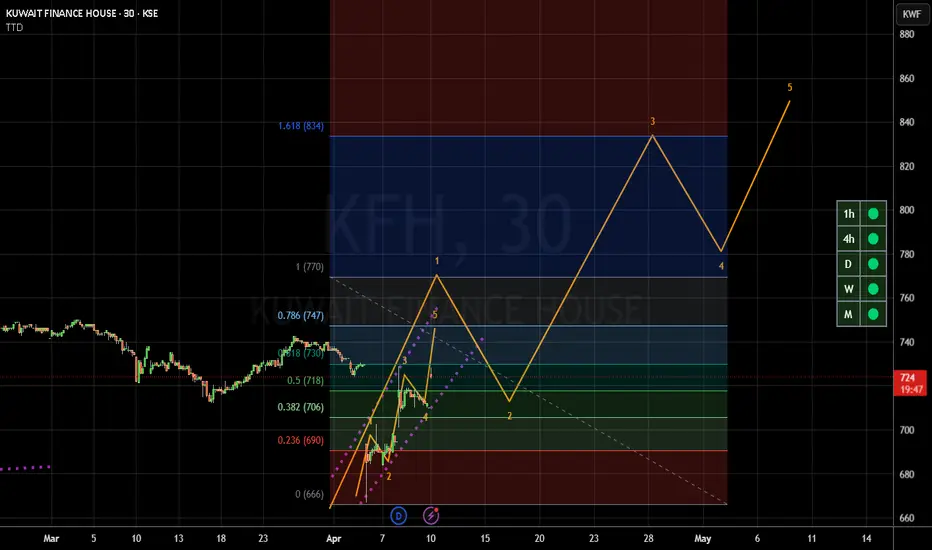
update kfhI believe now according to Elliott waves the first wave is forming and it is the start of large upward waves