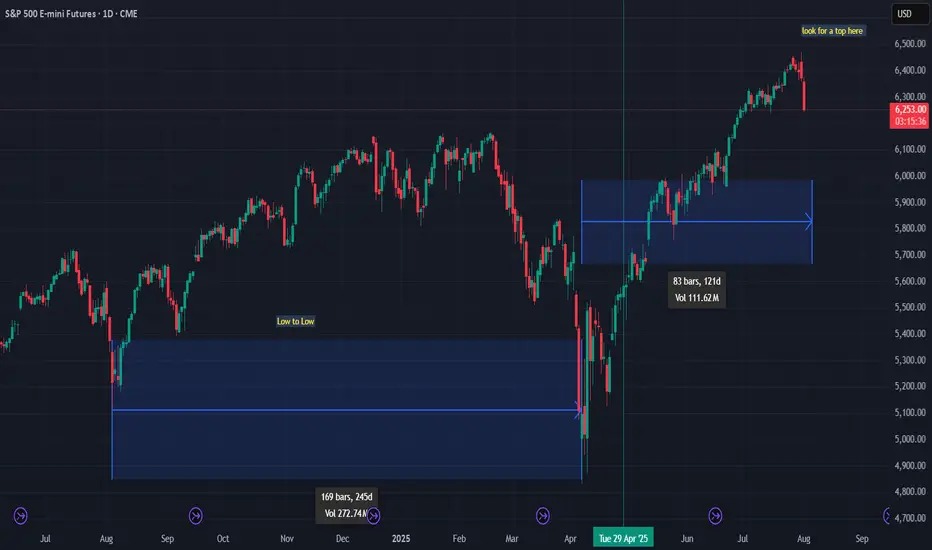
looking for a possible top for SPX500 , cycle highlooking for a possible top for SPX500 , cycle high
Gann
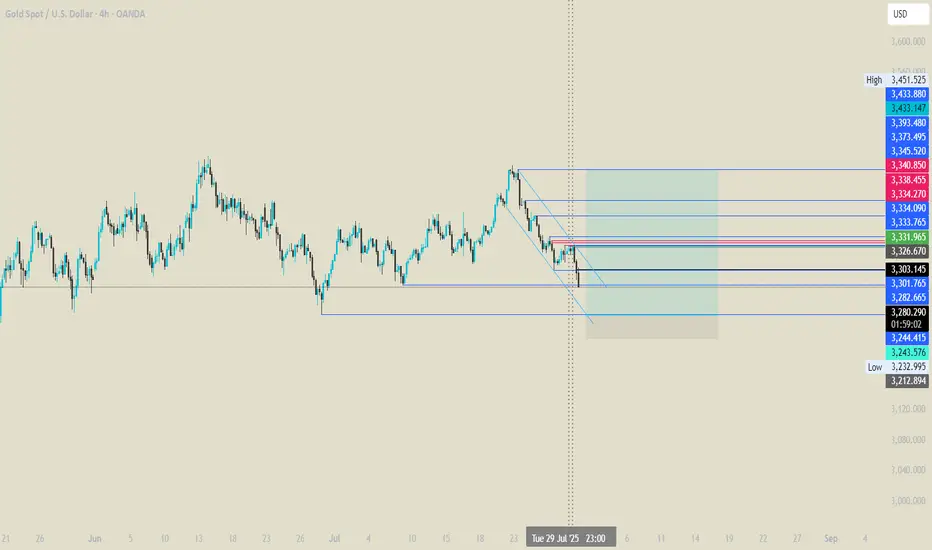
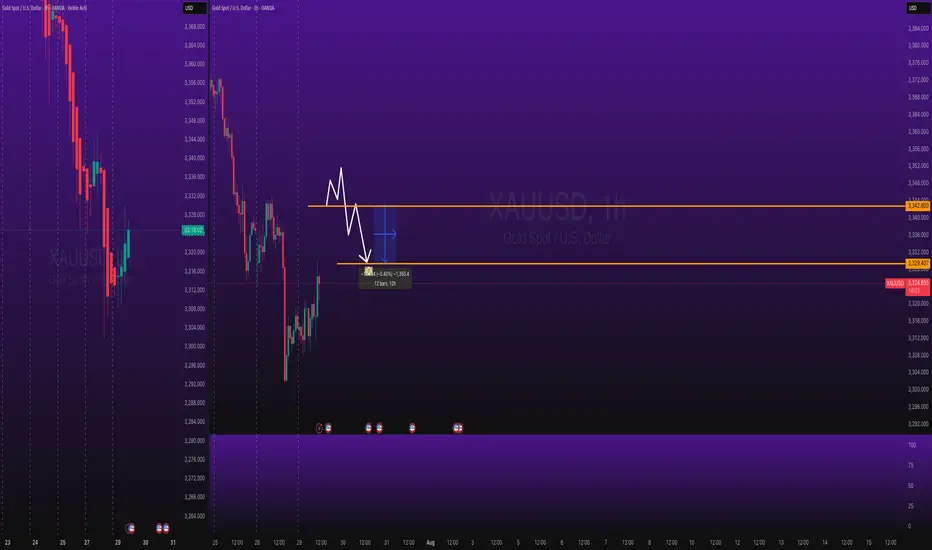
GOLD: Target Is Down! Short!
My dear friends,
Today we will analyse GOLD together☺️
The market is at an inflection zone and price has now reached an area around 3,353.10 where previous reversals or breakouts have occurred.And a price reaction that we are seeing on multiple timeframes here could signal the next move down so we can enter on confirmation, and target the next key level of 3,335.20..Stop-loss is recommended beyond the inflection zone.
❤️Sending you lots of Love and Hugs❤️

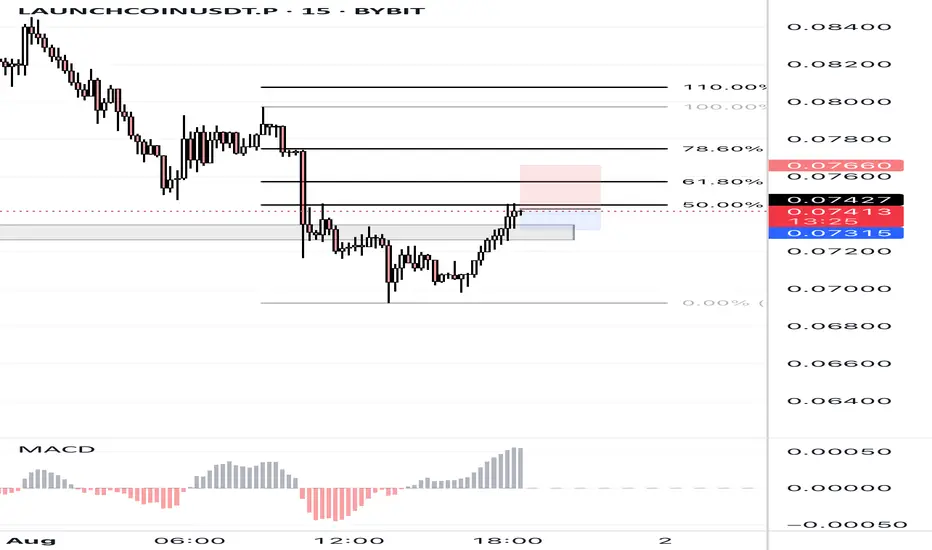
LAUNCHCOINUSDT.P | 50% Fibonacci Rejection – Bearish Reaction LiLAUNCHCOINUSDT.P is showing signs of exhaustion after a clean pullback to the 50% Fibonacci level (0.07427). Price is rejecting the key resistance zone, aligning with the broader downtrend structure.
Bearish Sentiment For GoldGold breaks daily trendline leaving a bearish engulfing pattern last Wednesday July 30, Expecting the price go down for correction. In my opinion, Gold will be BEARISH this coming August up to October. This is just my theory.

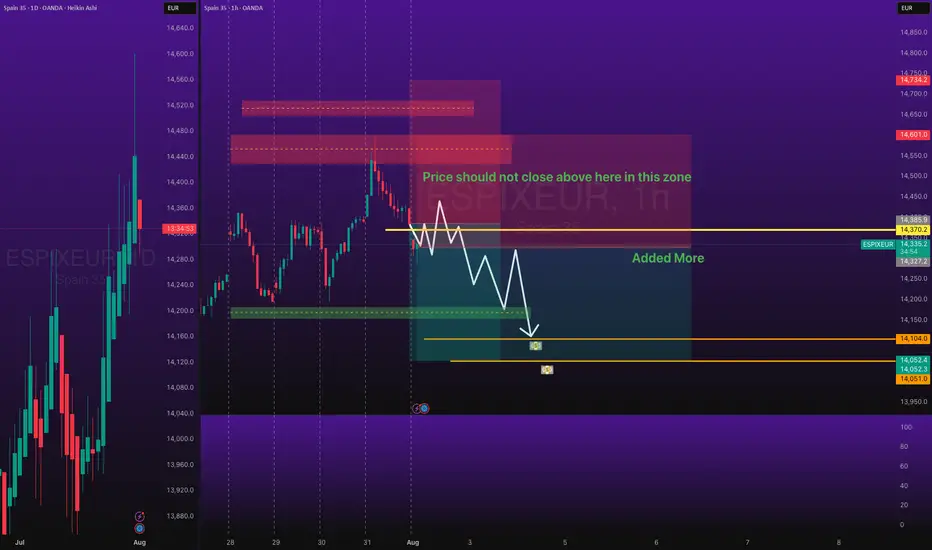
ESPIXEUR Short Trade with SL and TPOANDA:ESPIXEUR Short Trade - Low Risk, with my back testing of this strategy, it hits multiple possible take profits, manage your position accordingly.
Note: Manage your risk yourself, its risky trade, see how much your can risk yourself on this trade.
Use proper risk management
Looks like good trade.
Lets monitor.
Use proper risk management.
Disclaimer: only idea, not advice
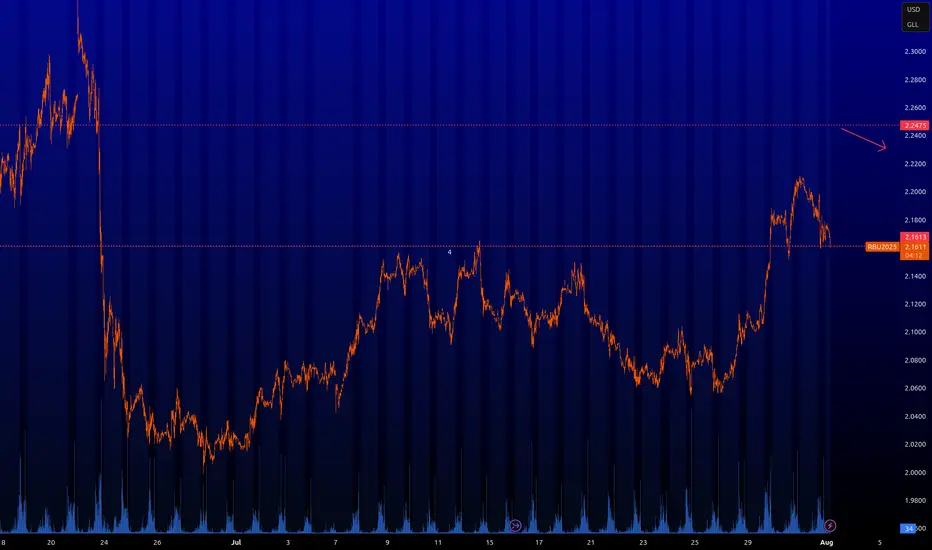
RBOB : Key levelsHere are the key levels that the market will be interested in. We can scalp from 2.2475. I have never traded this instrument, I do not know the specifics, but the level will be interesting. We can expect a bounce from it. I am more interested if it becomes inactive.
GOLD Short OANDA:XAUUSD / TVC:GOLD Short Trade, with my back testing of this strategy, this highlighted zone is key area of exact prices shared.
Price will bounce in this
Note: Manage your risk yourself, its risky trade, see how much your can risk yourself on this trade.
Use proper risk management
Looks like good trade.
Lets monitor.
Use proper risk management.
Disclaimer: only idea, not advice
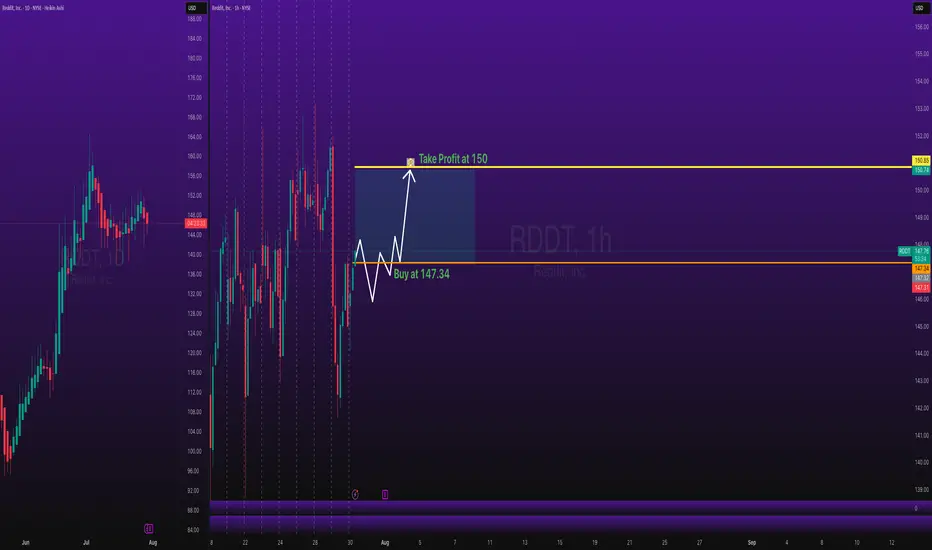
Stocks SPOT ACCOUNT: Reddit stocks BUT ENTRY with TAKE PROFITStocks SPOT ACCOUNT: NYSE:RDDT stocks my buy trade with take profit.
This is my SPOT Accounts for Stocks Portfolio.
Trade shows my Buying and Take Profit Level.
Spot account doesn't need SL because its stocks buying account.
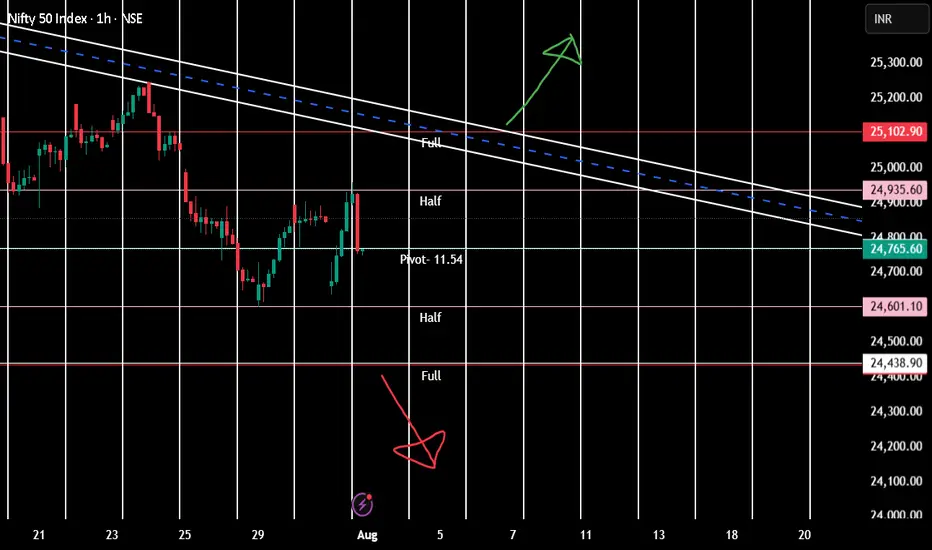
Positional tradeAt present market is for scalper/intraday trader. Positional trade to be done only once,
1. 24438 is crossed on day closing basis. Bearish view
2. 25102 is crossed on day closing basis. Bullish view
Pivot- Half-Full are weekly range and applicable only till 7th August.
Vertical lines are important times for intraday as buyer
SOPHUSDT.P | Price Rejection from Supply Zone – Short Setup ConfSOPHUSDT.P printed a clean bearish rejection after consolidating below the supply zone around 0.0435 – 0.0440, with clear signs of exhaustion. The 15-minute structure confirms a breakdown from key support at 0.0428, with sellers taking control.

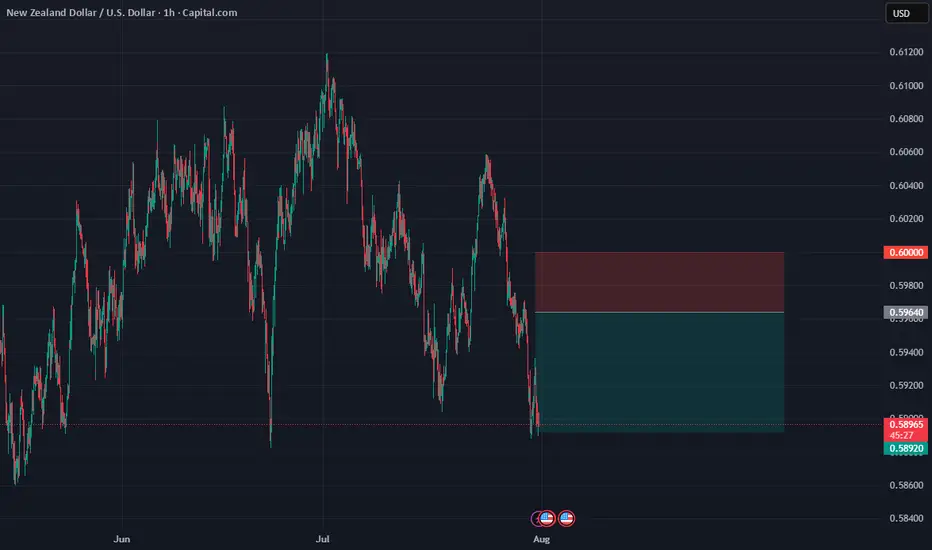
ENTRY NZDUSDDisclaimer:
This is merely a chart-based analytical trading idea and is not considered investment advice. Please manage your risks carefully and conduct your own research before making any trading decisions.
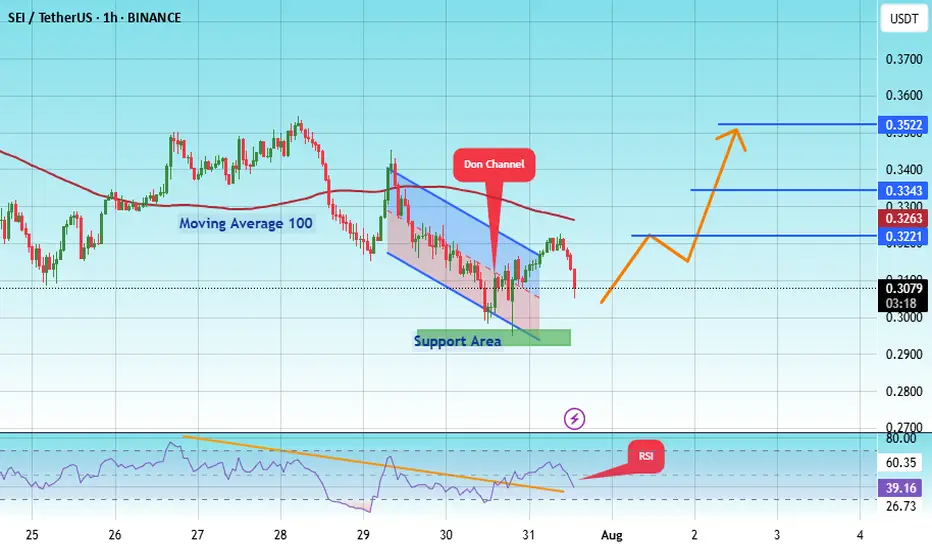
#SEI/USDT The best future belongs to this coin.#SEI
The price is moving within an ascending channel on the 1-hour frame, adhering well to it, and is on track to break it strongly upwards and retest it.
We have support from the lower boundary of the ascending channel, at 0.2967.
We have a downtrend on the RSI indicator that is about to break and retest, supporting the upside.
There is a major support area in green at 0.2950, which represents a strong basis for the upside.
Don't forget a simple thing: ease and capital.
When you reach the first target, save some money and then change your stop-loss order to an entry order.
For inquiries, please leave a comment.
We have a trend to hold above the 100 Moving Average.
Entry price: 0.3080.
First target: 0.3221.
Second target: 0.3343.
Third target: 0.3522.
Don't forget a simple thing: ease and capital.
When you reach your first target, save some money and then change your stop-loss order to an entry order.
For inquiries, please leave a comment.
Thank you.
CADJPY Short Day Trade OANDA:CADJPY Short Day Trade, with my back testing of this strategy, it hits multiple possible take profits, manage your position accordingly.
Note: Manage your risk yourself, its risky trade, see how much your can risk yourself on this trade.
Use proper risk management
Looks like good trade.
Lets monitor.
Use proper risk management.
Disclaimer: only idea, not advice

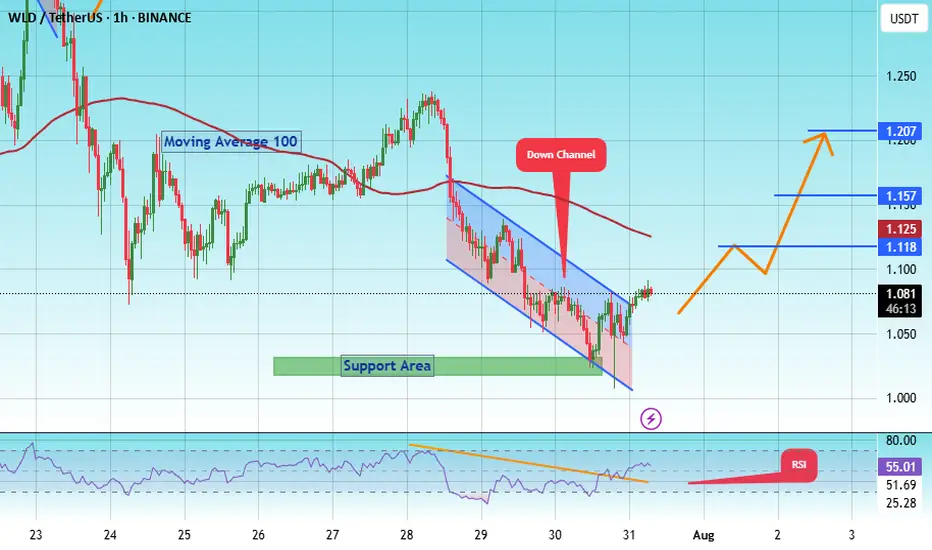
#WLD/USDT Approaching Breakout After Long-Term Downtrend !#WLD
The price is moving within an ascending channel on the 1-hour frame, adhering well to it, and is on its way to breaking strongly upwards and retesting it.
We have support from the lower boundary of the ascending channel, at 1.00.
We have a downtrend on the RSI indicator that is about to break and retest, supporting the upside.
There is a major support area in green at 1.02, which represents a strong basis for the upside.
Don't forget a simple thing: ease and capital.
When you reach the first target, save some money and then change your stop-loss order to an entry order.
For inquiries, please leave a comment.
We have a trend to hold above the 100 Moving Average.
Entry price: 1.08.
First target: 1.12.
Second target: 1.157.
Third target: 1.20.
Don't forget a simple thing: ease and capital.
When you reach your first target, save some money and then change your stop-loss order to an entry order.
For inquiries, please leave a comment.
Thank you.
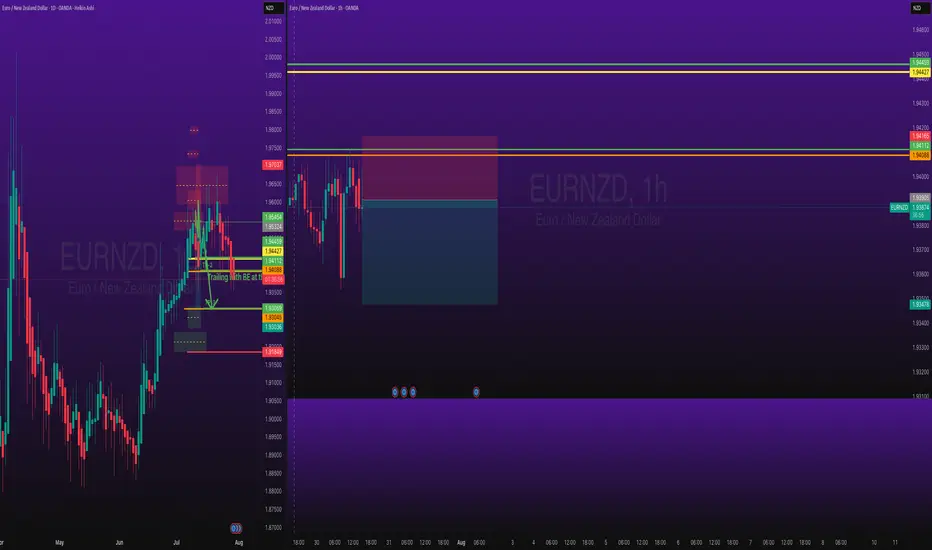
EURNZD Short Day Trade OANDA:EURNZD Short Day Trade - Low Risk, with my back testing of this strategy, it hits multiple possible take profits, manage your position accordingly.
Note: Manage your risk yourself, its risky trade, see how much your can risk yourself on this trade.
Use proper risk management
Looks like good trade.
Lets monitor.
Use proper risk management.
Disclaimer: only idea, not advice
NZDCHF Long Trade OANDA:NZDCHF Long Day Trade - Low Risk, with my back testing of this strategy, it hits multiple possible take profits, manage your position accordingly.
Note: Manage your risk yourself, its risky trade, see how much your can risk yourself on this trade.
Use proper risk management
Looks like good trade.
Lets monitor.
Use proper risk management.
Disclaimer: only idea, not advice

Title: GODSUSDT.P | Fibonacci Breakdown After Pump – Bearish RetGODSUSDT.P experienced a sharp upward pump followed by a strong rejection near the 0.1960 level (0.00% Fib). After failing to sustain the high, the price retraced and is currently consolidating near the 50% Fibonacci level (0.1528) on the 15m chart.
🔻 Bearish Bias Confirmed:
• MACD Histogram shows increasing bearish momentum.
• Price is struggling to reclaim 0.1563 resistance zone.
• If 0.1528 breaks, look for continuation to Fib targets:
• 61.8% (0.1427)
• 78.6% (0.1282)
• Final support near 100% - 110% zone (0.109 – 0.1015).
📊 Trade Plan:
Short entries below 0.1528 with SL above 0.1563. Targeting key Fib zones for profit booking.
⚠️ Not financial advice. Always do your own research and manage your risk accordingly.

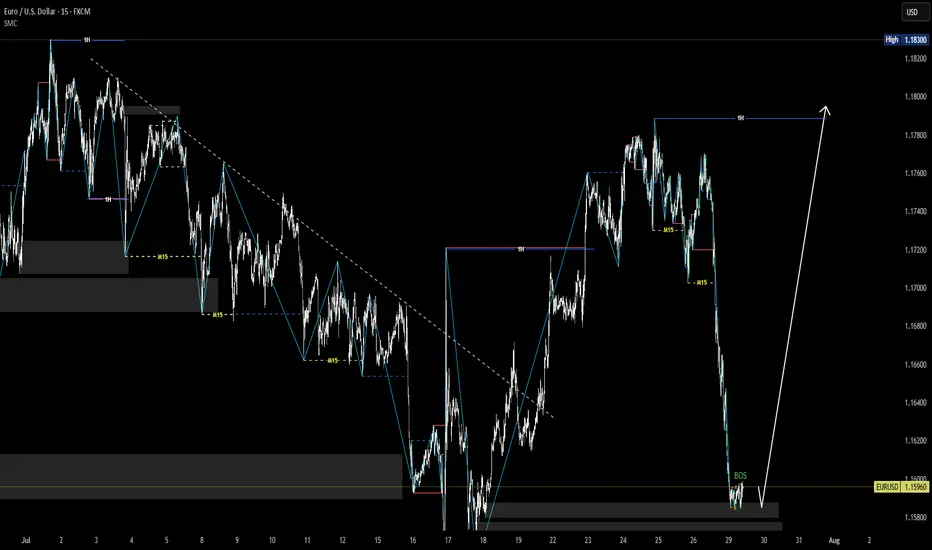
EURUSD market structure analysis on M15, H1 timeframesH1 Timeframe – Main Trend: BULLISH
🟢 Current Situation:
The H1 structure is showing a clear sequence of Higher Highs (HH) and Higher Lows (HL) ⇒ indicating an uptrend.
The market is currently in a retracement phase following the last bullish impulse.
Price is approaching a demand zone from a previous structure, where buy orders may be stacked.
📉 M15 Timeframe – Main Trend: BEARISH (within H1 pullback)
🔍 Current Observations:
While H1 is in a retracement, M15 shows a clear bearish market structure (Lower Lows – Lower Highs).
However:
Price has tapped into the H1 demand zone.
A liquidity grab (sweep of highs/lows) just occurred on M15.
This was followed by a Break of Structure (BOS) to the upside ⇒ signaling potential absorption of sell-side liquidity and a reversal in alignment with the higher timeframe (H1).
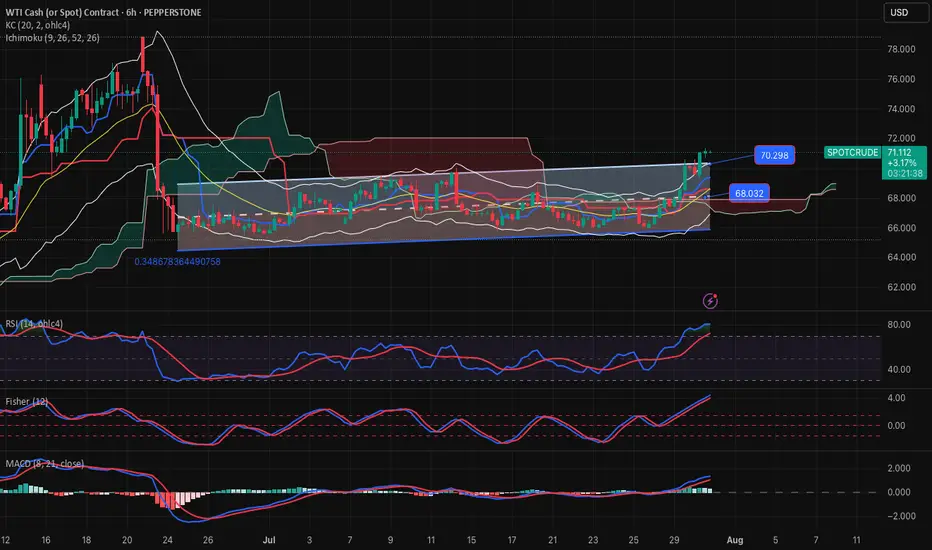
OIL-SELL strategy 6 hourly chart Reg. ChannelOIL has moved up sharply and we are moving beyond the regression channel. This usually will not last especially when overbought status.
Stragtegy SELL @ $ 70.90-71.30 and take profit near 69.37 for now.
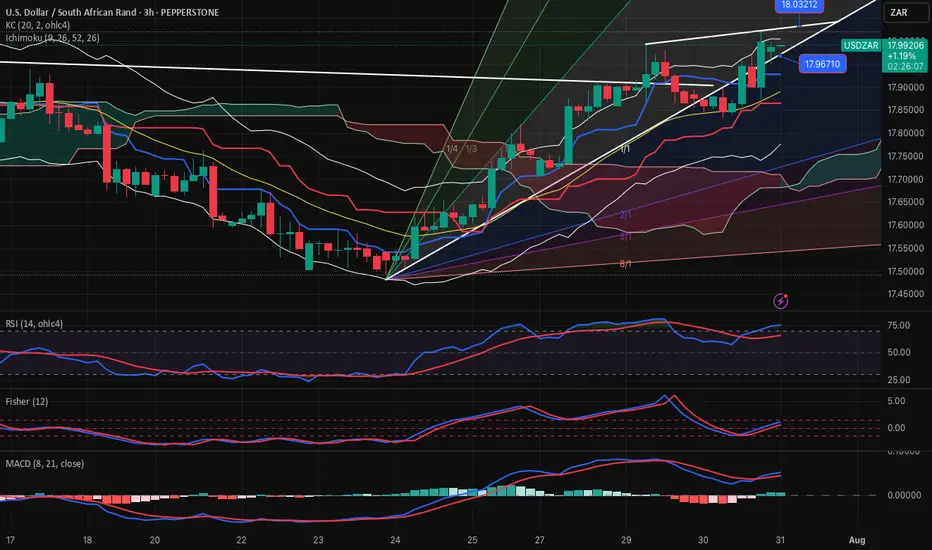
USDZAR-SELL strategy 3 hourly chart GANNThe pair has upward pressure and I suspect we will see little higher. Perhaps we may touch near 18.0500-18.0975 area, before selling pressure may set in. Since we have established 17.8500 area, it is wise to wait for the SELL. We are approaching overbought levels.
Strategy SELL @ 18.0650-18.1150 and take profit near 17.8875.
USDJPY (daily + Monthly analysis)hi everyone happy trading as always hope this video finds you some value.

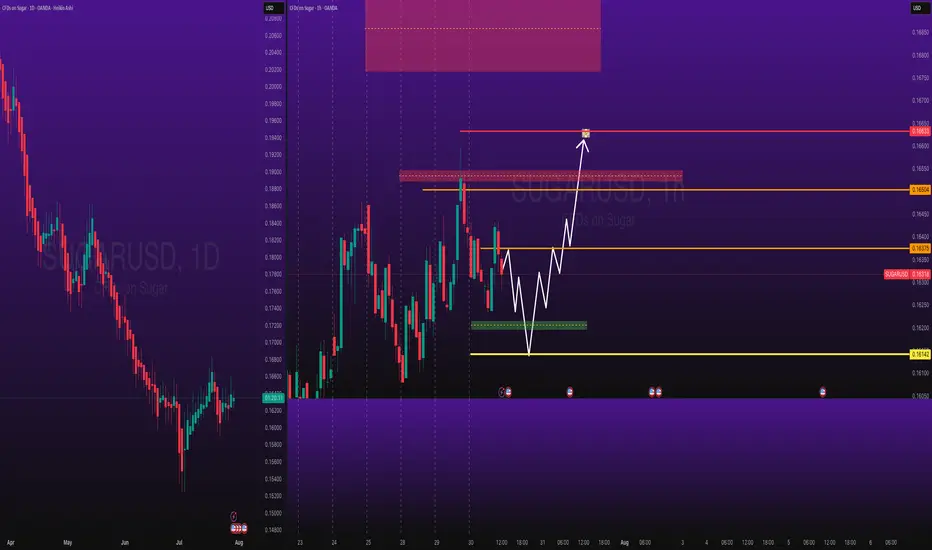
Sugar Long Trade PEPPERSTONE:SUGAR Long Trade, with my back testing of this strategy, it hits multiple possible take profits, manage your position accordingly.
Note: Manage your risk yourself, its risky trade, see how much your can risk yourself on this trade.
Use proper risk management
Looks like good trade.
Lets monitor.
Use proper risk management.
Disclaimer: only idea, not advice
Gold long from 3242LOOKING FOR LONGS AT AROUND THAT REGION.
gold looks good .
Lets wait for this to unfold.