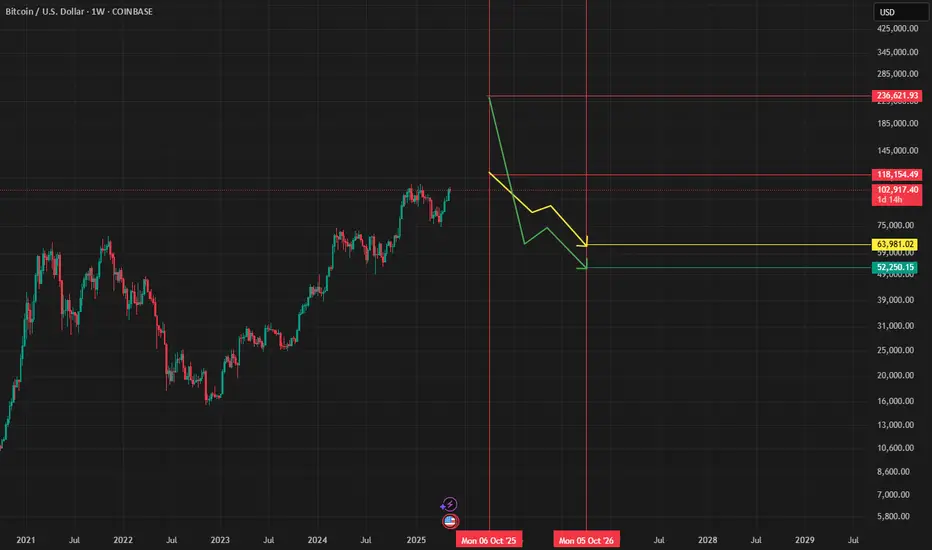
Two scenarios for Bitcoin's pathTwo scenarios for Bitcoin's path from October 2025 to October 2026: Growth to 118,000 and then a drop to 63-64,000 or growth to 236,000 and then a drop to 52,000. I currently give less weight to the second scenario. But the time frame in both scenarios is the same.
Gann
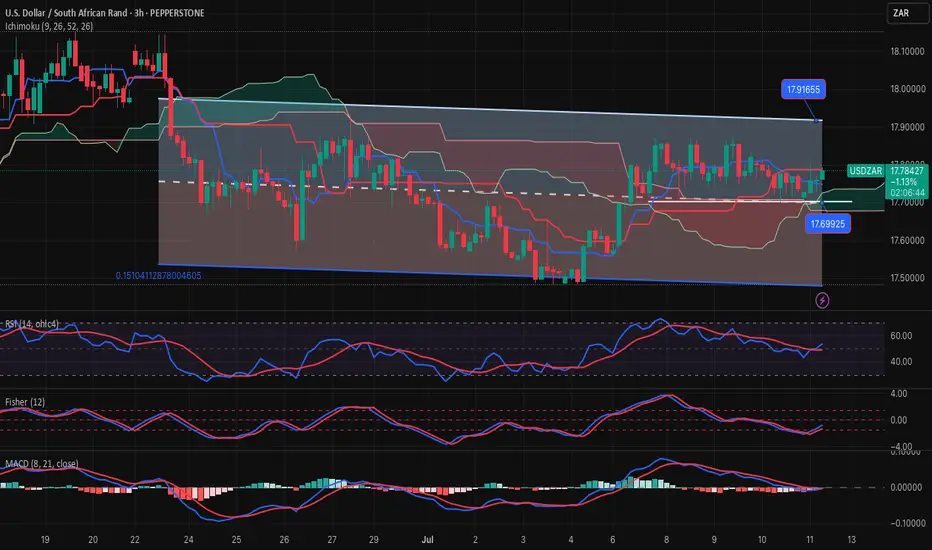
USDZAR-BUY strategy 3 houely chart Reg. ChannelThe pair seems to show some strength, and think we have a chance to test 17.9150 again in the short-term. The indicators provide support as long as 17.6900 is not violated on a close.
Strategy BUY @ 17.7350-17.7550 and take profit near 17.8875.
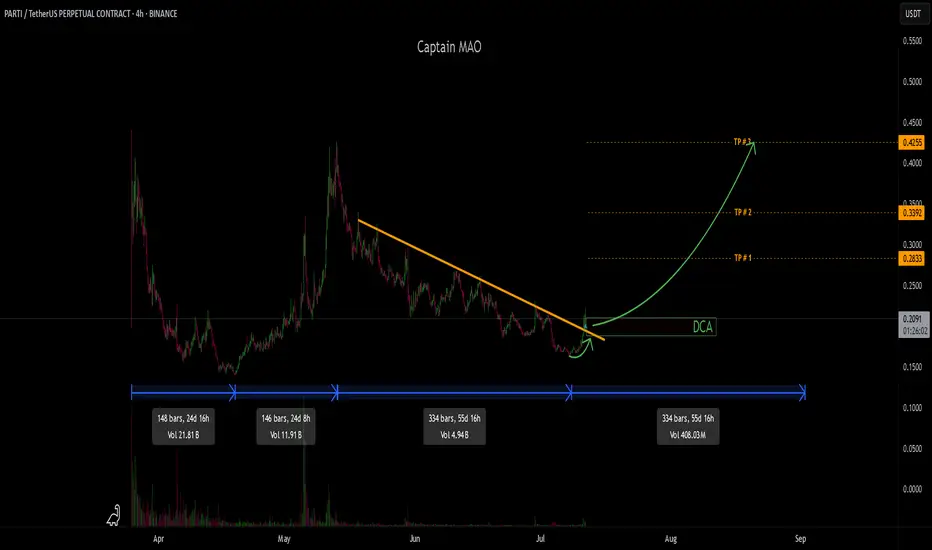
PARTI/USDT -WPARTI/USDT has officially broken out from a 58 day downtrend, signaling a key shift in structure. Current price action hints at the early formation of a W-shaped reversal pattern, a classic bullish bottoming structure that often precedes strong upside continuation.
since July 7 Higher low formation in progress early signs of W-pattern
DCA Entry Green box
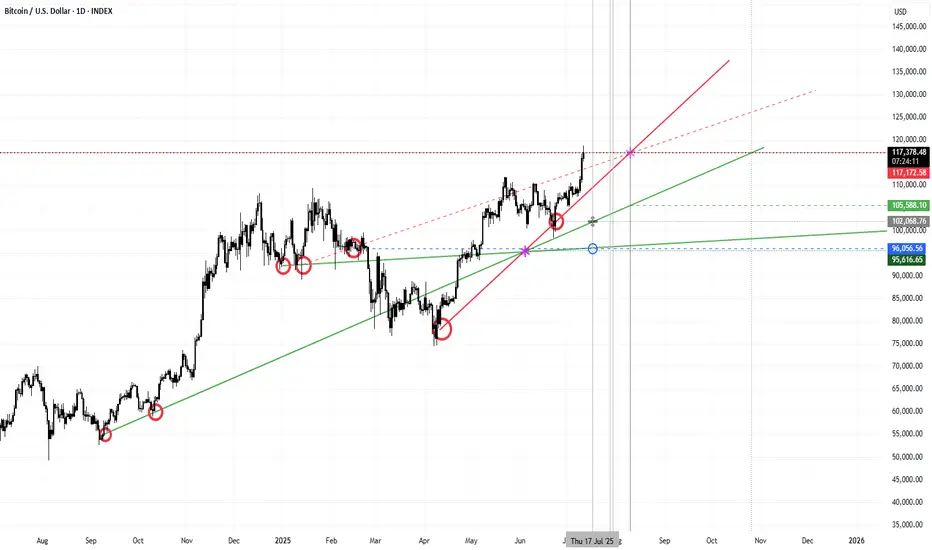
Simple DWEB node trendsThe only 1D trend lines you should need for confluence. Based off DWEB trend nodes. intersections marked for local price action. Only a 1D chart..
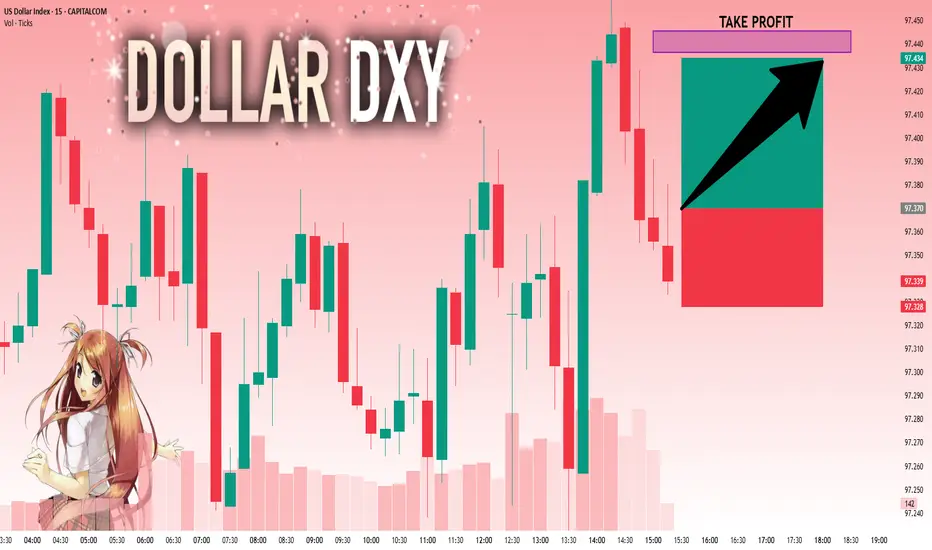
DXY: The Market Is Looking Down! Short!
My dear friends,
Today we will analyse DXY together☺️
The in-trend continuation seems likely as the current long-term trend appears to be strong, and price is holding above a key level of 97.370 So a bullish continuation seems plausible, targeting the next high. We should enter on confirmation, and place a stop-loss beyond the recent swing level.
❤️Sending you lots of Love and Hugs❤️
XAUUSD structure analysis on M15 and H1- 4H swing is bearish => currently giving a top sweep signal.
- H1 swing is bearish
- M15 swing is bearish
- We can look for selling opportunities according to the down structure of the M15 timeframe

SILVER: Strong Bullish Sentiment! Long!
My dear friends,
Today we will analyse SILVER together☺️
The market is at an inflection zone and price has now reached an area around 38.207 where previous reversals or breakouts have occurred.And a price reaction that we are seeing on multiple timeframes here could signal the next move up so we can enter on confirmation, and target the next key level of 38.594.Stop-loss is recommended beyond the inflection zone.
❤️Sending you lots of Love and Hugs❤️

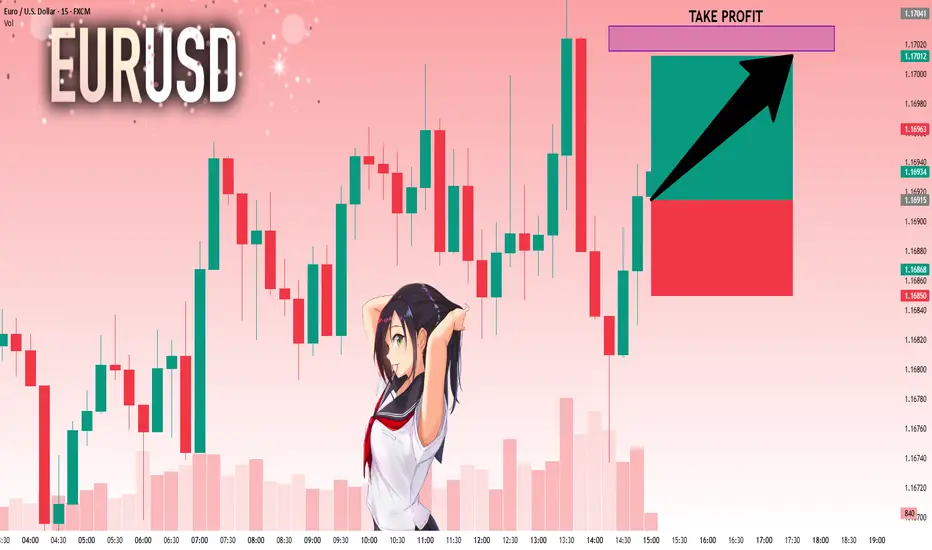
EURUSD: Bulls Are Winning! Long!
My dear friends,
Today we will analyse EURUSD together☺️
The price is near a wide key level
and the pair is approaching a significant decision level of 1.16915 Therefore, a strong bullish reaction here could determine the next move up.We will watch for a confirmation candle, and then target the next key level of 1.17015.Recommend Stop-loss is beyond the current level.
❤️Sending you lots of Love and Hugs❤️
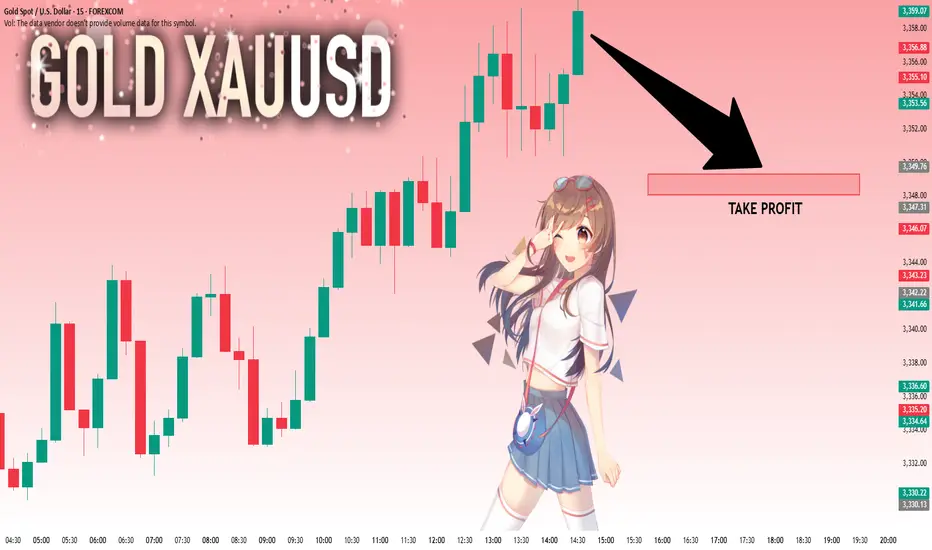
GOLD: Next Move Is Down! Short!
My dear friends,
Today we will analyse GOLD together☺️
The recent price action suggests a shift in mid-term momentum. A break below the current local range around 3,358.00 will confirm the new direction downwards with the target being the next key level of 3,349.30.and a reconvened placement of a stop-loss beyond the range.
❤️Sending you lots of Love and Hugs❤️
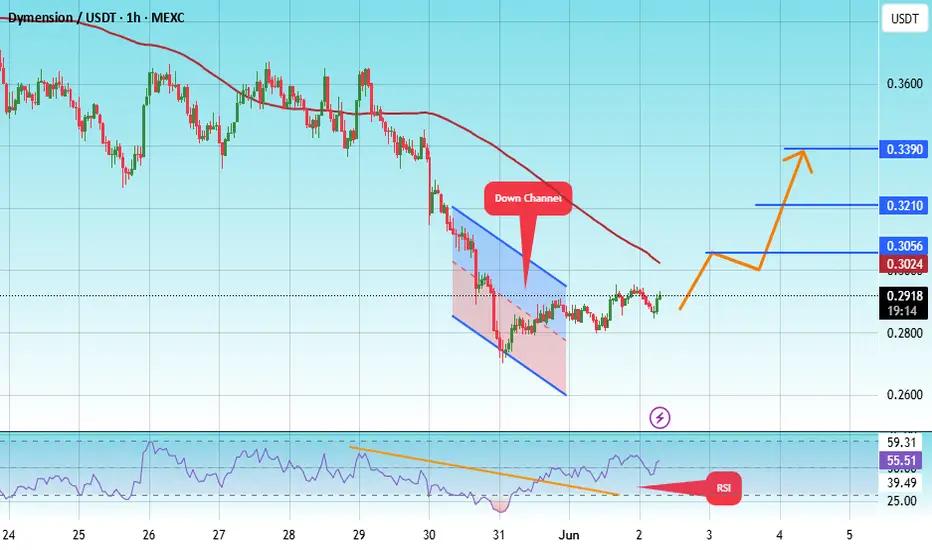
#DYM/USDT#DYM
The price is moving within a descending channel on the 1-hour frame, adhering well to it, and is heading for a strong breakout and retest.
We are seeing a bounce from the lower boundary of the descending channel, which is support at 0.2729.
We have a downtrend on the RSI indicator that is about to be broken and retested, supporting the upward trend.
We are looking for stability above the 100 Moving Average.
Entry price: 0.3390
First target: 0.3056
Second target: 0.3210
Third target: 0.3390
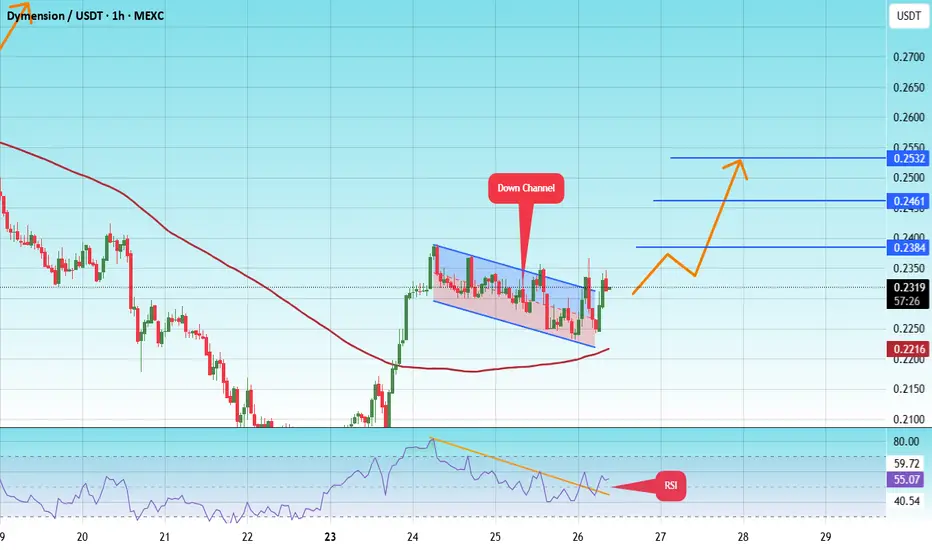
#DYM/USDT#DYM
The price is moving within a descending channel on the 1-hour frame and is expected to break and continue upward.
We have a trend to stabilize above the 100 moving average once again.
We have a downtrend on the RSI indicator, which supports the upward move by breaking it upward.
We have a support area at the lower limit of the channel at 0.2232, acting as strong support from which the price can rebound.
Entry price: 0.2316
First target: 0.2384
Second target: 0.2461
Third target: 0.2532
possible setup for goldwe could see gold retrace to the 0.5-0.382 greyish fib or start an ascending triangle for a break to the upside from the 0.618 line staying above that red line would mean the bulls have successfully moved above that bear channel. On the other hand if it drops to the 0.382 fib it will also be in confluence with the upward gann fan resistance.

Institutional Trading Process 1. Investment Idea Generation
This is where it all begins.
Institutions generate trading ideas based on:
Fundamental research (company earnings, macroeconomic data)
Quantitative models (statistical or algorithmic strategies)
Technical analysis (price action, trends, volume)
Sentiment analysis (news flow, social media, market psychology)
Often, the research team, quant team, or portfolio managers work together to develop high-conviction trade ideas backed by data and analysis.
2. Pre-Trade Analysis and Risk Assessment
Before placing a trade, institutions perform:
Risk/reward analysis
Scenario testing (How does the trade perform in different market conditions?)
Volatility analysis
Position sizing based on portfolio risk budget

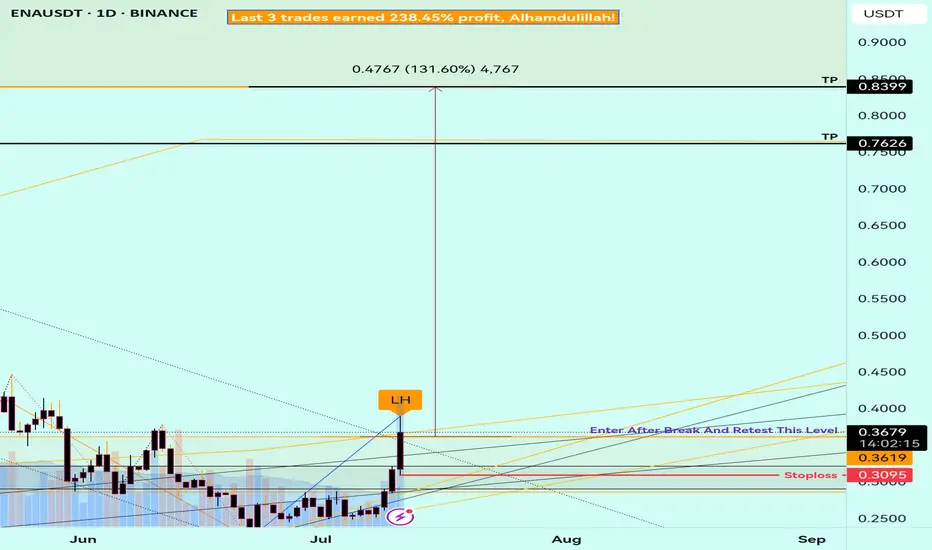
Buy Trade Strategy for ENA: Backing the Ethena Protocol VisionDescription:
This trading idea is based on ENA, the native token of the Ethena Protocol, a rising star in the decentralized finance (DeFi) space aiming to build a crypto-native, yield-bearing stablecoin alternative called USDe. ENA plays a critical role in governance, staking, and incentivizing ecosystem participants. Ethena’s innovative architecture, which combines delta-neutral strategies with Ethereum-based infrastructure, has drawn significant interest from both institutional and retail users. With growing adoption, strong investor backing, and real-world use cases, ENA is positioned as a key asset for those looking to gain exposure to next-generation DeFi protocols focused on scalability and stability.
That said, the crypto market is known for its volatility. Factors such as regulatory uncertainty, market sentiment, and ecosystem risks can dramatically influence price action. Investors should consider these dynamics when planning their trades and ensure proper risk management is in place.
Disclaimer:
This trading idea is for educational purposes only and does not constitute financial advice. Trading cryptocurrencies, including ENA, involves substantial risk and can result in the loss of your entire investment. Always perform thorough research, assess your personal financial situation, and consult with a qualified financial advisor before making any investment decisions. Past performance is not indicative of future results.
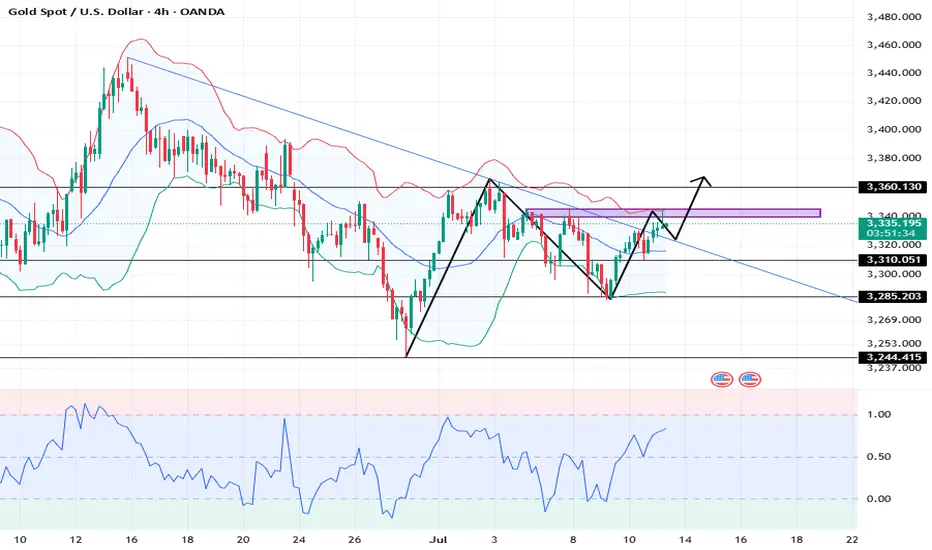
Gold: Market analysis and strategy on July 11Gold technical analysis
Daily chart resistance: 3375, support: 3285
Four-hour chart resistance: 3360, support: 3310
One-hour chart resistance: 3345, support: 3324.
For the current market trend, pay attention to the resistance of 3340-3345 on the upper side during the day. This is the high point concentration area that has suppressed the upward trend of gold prices many times in the early stage. If it is treated as a volatile market, sell at highs in the 3340~3345 range. If it breaks through 3345, it may trigger stop-loss buying and continue to rise to the 3355~3360 area.
The key support below is still at 3310, but from the 1-hour chart, the trend is rising in steps, and the short-term support is around 3324. Buy back here. After the Asian market was blocked near the previous high of 3345, it entered a short-term correction, and the long and short saws. It is suitable for fast in and out, and follow up and buy after breaking through 3345.
Buy: 3324near
Buy: 3310near
Buy: 3345near
Sell: 3344near
GBPUSD I Daily CLS I Model 1 KL FVG + SMTYo Market Warriors ⚔️
Fresh outlook drop — if you’ve been riding with me, you already know:
🎯My system is 100% mechanical. No emotions. No trend lines. No subjective guessing. Just precision, structure, and sniper entries.
🧠 What’s CLS?
It’s the real smart money. The invisible hand behind $7T/day — banks, algos, central players.
📍Model 1:
HTF bias based on the daily and weekly candles closes,
Wait for CLS candle to be created and manipulated. Switch to correct LTF and spot CIOD. Enter and target 50% of the CLS candle.
For high probability include Dealing Ranges, Weekly Profiles and CLS Timing.
Trading is like a sport. If you consistently practice you can learn it.
“Adapt what is useful. Reject whats useless and add whats is specifically yours.”
David Perk aka Dave FX Hunter
💬 Don't hesitate to ask any questions or share your opinions

EURUSD I Daily CLS I Model 1 I KL FVG I Target 50%Yo Market Warriors ⚔️
Fresh outlook drop — if you’ve been riding with me, you already know:
🎯My system is 100% mechanical. No emotions. No trend lines. No subjective guessing. Just precision, structure, and sniper entries.
🧠 What’s CLS?
It’s the real smart money. The invisible hand behind $7T/day — banks, algos, central players.
📍Model 1:
HTF bias based on the daily and weekly candles closes,
Wait for CLS candle to be created and manipulated. Switch to correct LTF and spot CIOD. Enter and target 50% of the CLS candle.
For high probability include Dealing Ranges, Weekly Profiles and CLS Timing.
Trading is like a sport. If you consistently practice you can learn it.
“Adapt what is useful. Reject whats useless and add whats is specifically yours.”
David Perk aka Dave FX Hunter
💬 Don't hesitate to ask any questions or share your opinions

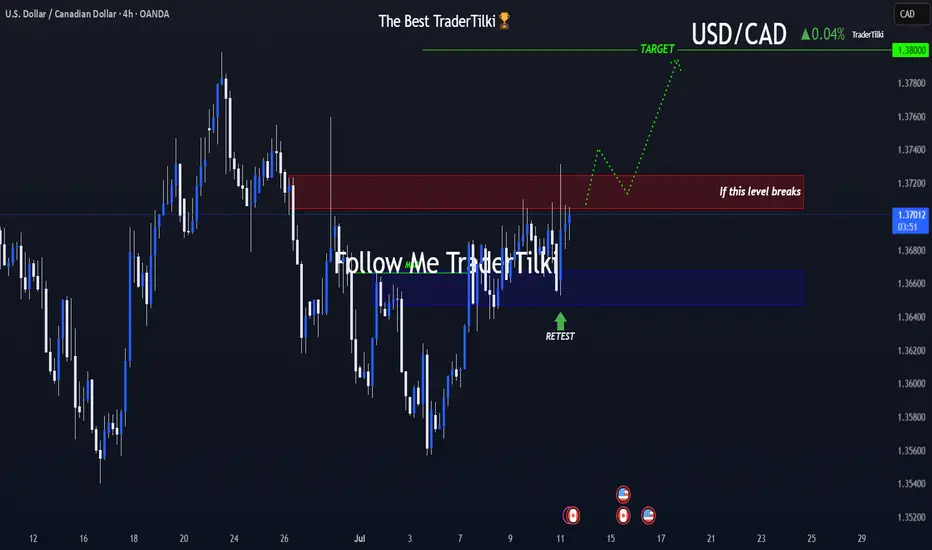
USDCAD's Opportunity Bell Is Ringing — Don’t Miss Out!Hey there, my valued friends!
I’ve prepared a fresh USDCAD analysis just for you.
📌 If the 1.37245 level breaks, the next target will be 1.38000.
Every single like you send my way is the biggest motivation behind sharing these analyses.
🙌 Huge thanks to each and every one of you who supports me!
Would you like to add a visual or a catchy headline to boost engagement even more? I can help with that too.
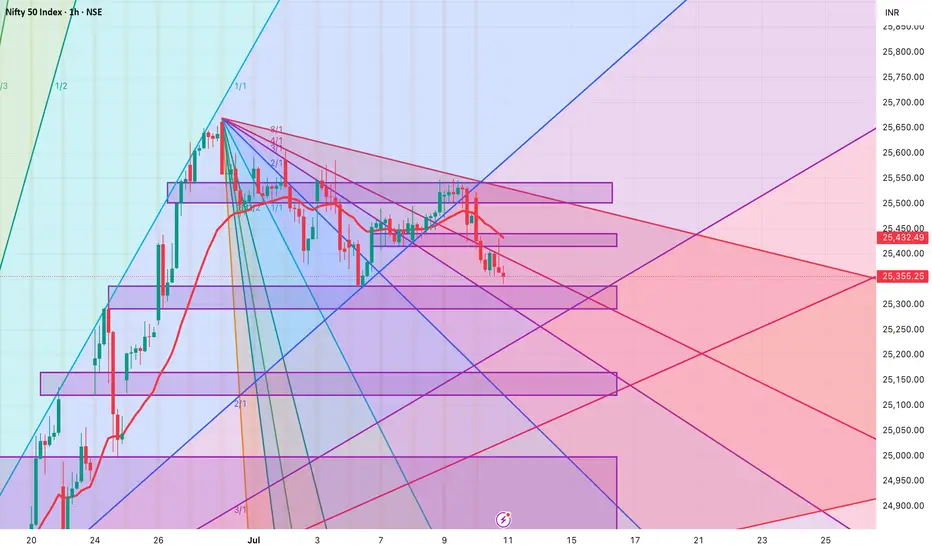
Levels for Nifty - 11 July 20251. Long once 25415 - 25440 is broken for target of 25541 and second target of 25610.
2. Short only after the support zone of 25336 - 25291 is broken for target of 25165 and second target of 25000.
3. No trading zone with be todays range of 25340-25410
July 10 Bitcoin Bybit chart analysisHello
It's a Bitcoin Guide.
If you "follow"
You can receive real-time movement paths and comment notifications on major sections.
If my analysis was helpful,
Please click the booster button at the bottom.
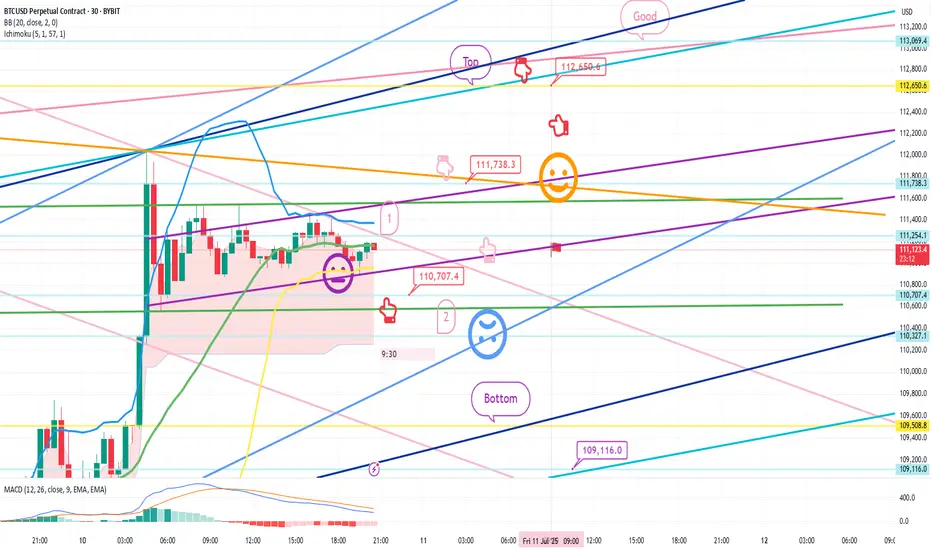
Here is the Bitcoin 30-minute chart.
There will be a Nasdaq indicator announcement at 9:30 in a little while.
There is a high possibility that Nasdaq will shake up and down significantly,
but Bitcoin still looks safe in terms of signal and pattern.
In the analysis article on July 7,
I connected the strategy as it was at the last long position entry point of 107,484 dollars.
*When the red finger moves,
it is a one-way long position strategy.
1. 110,707.4 dollars long position entry point / stop loss price when the sky blue support line breaks
2. 111,783.3 dollars long position 1st target -> Top 2nd -> Good 3rd target price
The 1st section at the top is today's best short position entry point,
and the 2nd section at the bottom is a sideways market.
In the middle, with a pink finger,
I left a re-entry position after liquidating a long position, so
I think it would be good to use it.
From the breakout of the sky blue support line, it can be pushed to Bottom -> 109,116 dollars.
The report is not yet renewed,
but from now on, it will be very important, right?
This week, it seems like it will continue to shake up and down,
so I hope you operate safely with principle trading and stop loss prices.
Thank you.
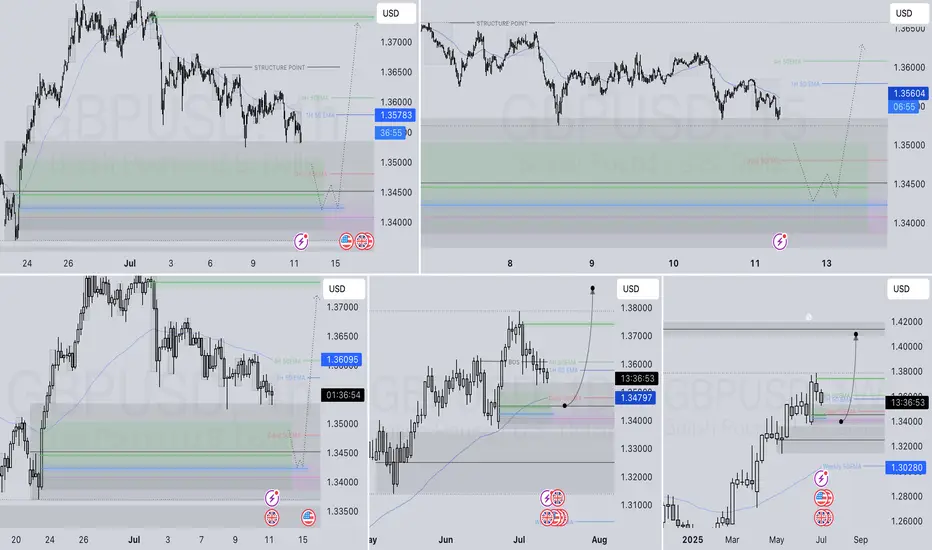
GBPUSD LONG FORECAST Q3 D11 W28 Y25GBPUSD LONG FORECAST Q3 D11 W28 Y25
It’s Fun Coupon Friday! 💸🔥
Professional Risk Managers👋
Welcome back to another FRGNT chart update📈
Diving into some Forex setups using predominantly higher time frame order blocks alongside confirmation breaks of structure.
Let’s see what price action is telling us today!
💡Here are some trade confluences📝
✅Daily order block
✅1H Order block
✅Intraday breaks of structure
✅4H Order block
🔑 Remember, to participate in trading comes always with a degree of risk, therefore as professional risk managers it remains vital that we stick to our risk management plan as well as our trading strategies.
📈The rest, we leave to the balance of probabilities.
💡Fail to plan. Plan to fail.
🏆It has always been that simple.
❤️Good luck with your trading journey, I shall see you at the very top.
🎯Trade consistent, FRGNT X
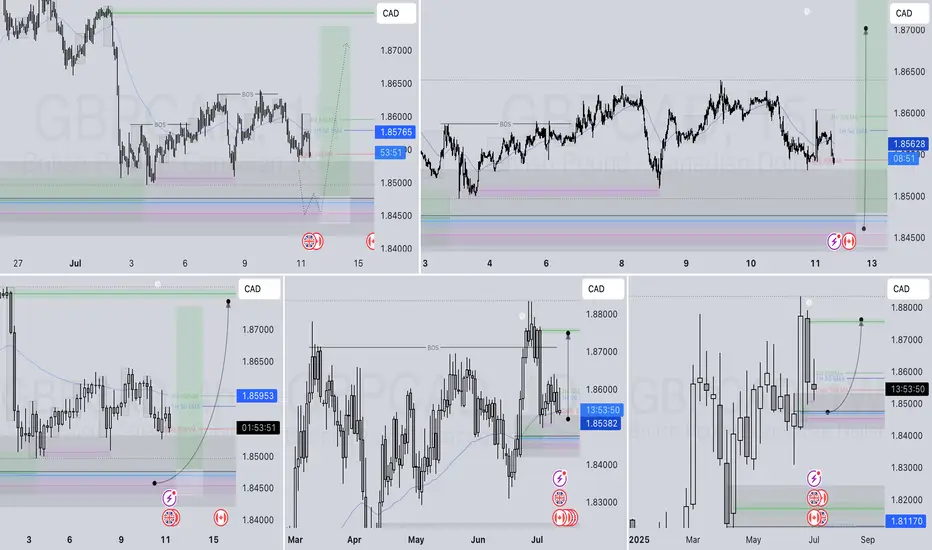
GBPCAD LONG FORECAST Q3 D11 W28 Y25GBPCAD LONG FORECAST Q3 D11 W28 Y25
It’s Fun Coupon Friday! 💸🔥
Professional Risk Managers👋
Welcome back to another FRGNT chart update📈
Diving into some Forex setups using predominantly higher time frame order blocks alongside confirmation breaks of structure.
Let’s see what price action is telling us today! 👀
💡Here are some trade confluences📝
✅Daily Order block identified
✅4H Order Block identified
✅1H Order Block identified
🔑 Remember, to participate in trading comes always with a degree of risk, therefore as professional risk managers it remains vital that we stick to our risk management plan as well as our trading strategies.
📈The rest, we leave to the balance of probabilities.
💡Fail to plan. Plan to fail.
🏆It has always been that simple.
❤️Good luck with your trading journey, I shall see you at the very top.
🎯Trade consistent, FRGNT X
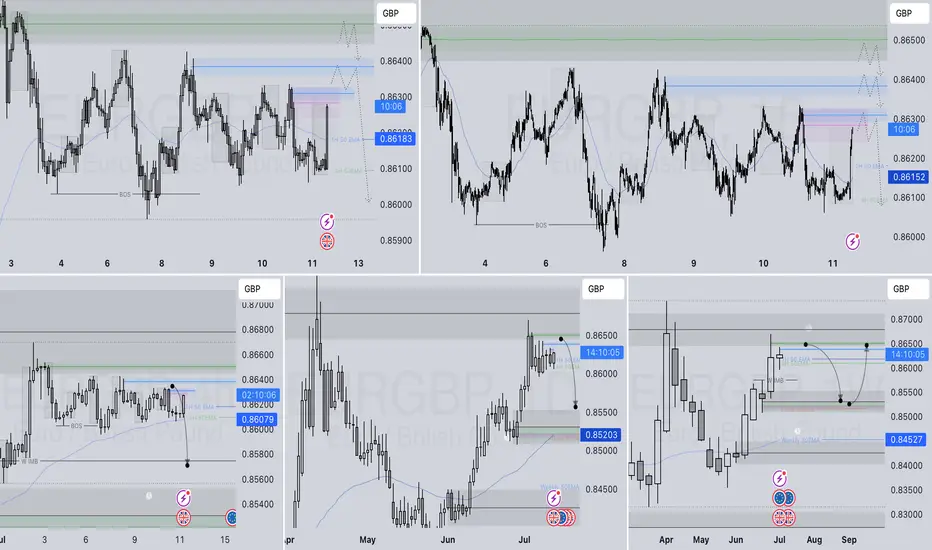
EURGBP SHORT DAILY FORECAST Q3 D11 W28 Y25EURGBP SHORT DAILY FORECAST Q3 D11 W28 Y25
It’s Fun Coupon Friday! 💸🔥
Professional Risk Managers👋
Welcome back to another FRGNT chart update📈
Diving into some Forex setups using predominantly higher time frame order blocks alongside confirmation breaks of structure.
Let’s see what price action is telling us today! 👀
💡Here are some trade confluences📝
✅Daily Order block identified
✅4H Order Block identified
✅1H Order Block identified
🔑 Remember, to participate in trading comes always with a degree of risk, therefore as professional risk managers it remains vital that we stick to our risk management plan as well as our trading strategies.
📈The rest, we leave to the balance of probabilities.
💡Fail to plan. Plan to fail.
🏆It has always been that simple.
❤️Good luck with your trading journey, I shall see you at the very top.
🎯Trade consistent, FRGNT X