Crypto Trade: PEPEUSDT Long Swing Trade BINANCE:PEPEUSDT Long Swing Trade, with my back testing of this strategy, it hits multiple possible take profits, manage your position accordingly.
This is good trade, don't overload your risk like greedy, be disciplined trader.
I manage trade on daily basis.
this is good trade, lets see, don't be greedy, risk what you can afford.
Use proper risk management
Looks like good trade.
Lets monitor.
Use proper risk management.
Disclaimer: only idea, not advice
Gann
Stocks SPOT ACCOUNT: AI stocks BUT ENTRY with TAKE PROFITStocks SPOT ACCOUNT: NYSE:AI $c3.AI
stocks my buy trade with take profit.
This is my SPOT Accounts for Stocks Portfolio.
Trade shows my Buying and Take Profit Level.
Spot account doesn't need SL because its stocks buying account.
QUBT Stocks BUY Entry with Take Profit Level - Key ZonesStocks SPOT ACCOUNT: NASDAQ:QUBT stocks my buy trade with take profit.
This is my SPOT Accounts for Stocks Portfolio.
Trade shows my Buying and Take Profit Level.
Spot account doesn't need SL because its stocks buying account.
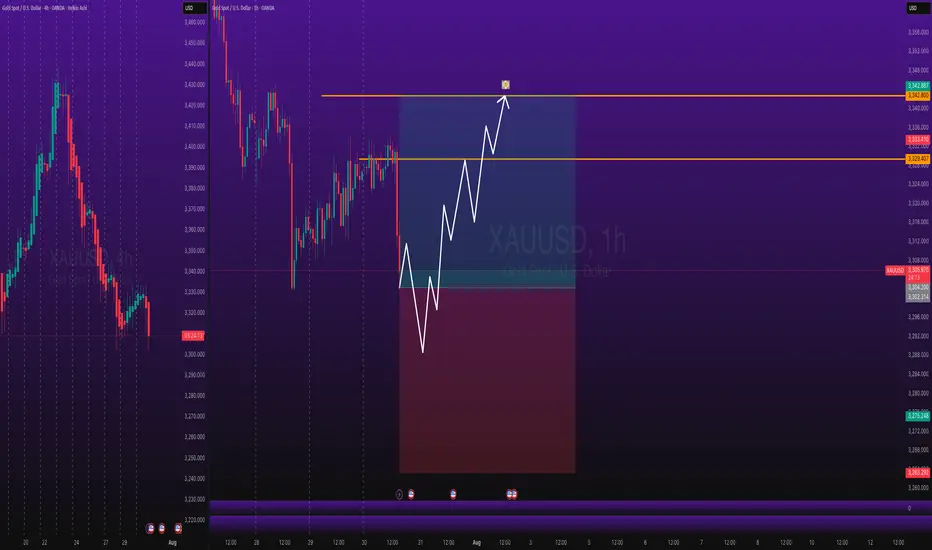
GOLD Long After Lower Dip - Catching PullbackOANDA:XAUUSD / TVC:GOLD Long Trade, with my back testing of this strategy, it hits multiple tp, here price will pullback up.
Price will bounce in this zone.
I kept SL slight big to be safe because TP levels are good so I don't want to get pushed out because of tight SL.
Note: Manage your risk yourself, its risky trade, see how much your can risk yourself on this trade.
Use proper risk management
Looks like good trade.
Lets monitor.
Use proper risk management.
Disclaimer: only idea, not advice
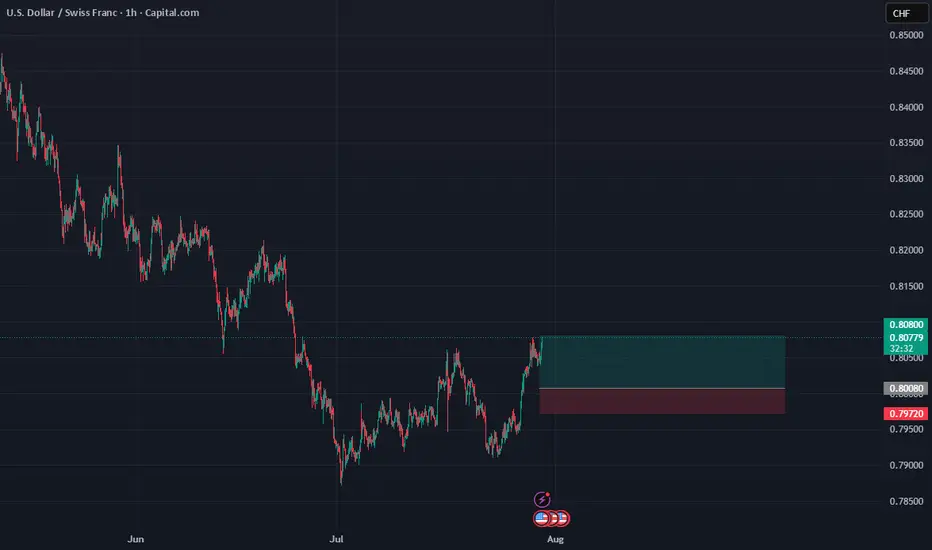
USD/CHFUSD/CHF Overview:
After a downward correction in recent weeks, the USD/CHF pair appears to be finding some support around the 0.80000 - 0.79800 levels. We are observing signs of price consolidation, which could indicate a potential bullish bounce.
Trade Details (Pending Order):
Order Type: Buy Limit
Entry Point: 0.80080
This point was chosen based on a previous support area and the price's attempt to consolidate above it.
Stop Loss (SL): 0.79720
The stop loss is located below a clear local low and below the psychological support level of 0.80000 to provide adequate protection.
Take Profit (TP): 0.80800
This level targets a retest of a previous resistance area, or as a conservative target for the first bullish bounce.
Risk Management:
Distance to Stop Loss: 36 pips (0.80080 - 0.79720)
Distance to Take Profit: 72 pips (0.80800 - 0.80080)
Risk-to-Reward Ratio (R:R): 1:2
This ratio is considered excellent and provides a good opportunity for profit compared to the potential risk.
Additional Considerations:
Traders are monitoring upcoming economic data from the United States and Switzerland.
A decisive break above 0.79720 could invalidate this idea, while a break above 0.80800 could open the door to further upside.
Disclaimer:
This is merely an analytical trading idea and is not intended as investment advice. Please manage your risk consciously and conduct your own research before making any trading decisions.
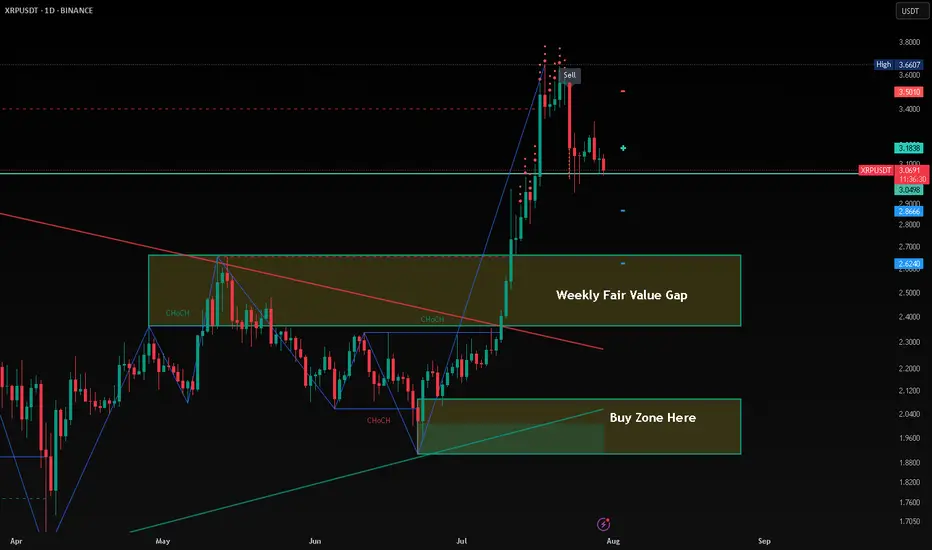
XRP Potential BuyXRP will make a huge correction before taking up. This bearish pattern will last up to October of 2025. My possible prediction Price of XRP by 2026 is $12 -$15 mark up.
GBPUSD – DAILY FORECAST Q3 | W31 | D30 | Y25📊 GBPUSD – DAILY FORECAST
Q3 | W31 | D30 | Y25
Daily Forecast 🔍📅
Here’s a short diagnosis of the current chart setup 🧠📈
Higher time frame order blocks have been identified — these are our patient points of interest 🎯🧭.
It’s crucial to wait for a confirmed break of structure 🧱✅ before forming a directional bias.
This keeps us disciplined and aligned with what price action is truly telling us.
📈 Risk Management Protocols
🔑 Core principles:
Max 1% risk per trade
Only execute at pre-identified levels
Use alerts, not emotion
Stick to your RR plan — minimum 1:2
🧠 You’re not paid for how many trades you take, you’re paid for how well you manage risk.
🧠 Weekly FRGNT Insight
"Trade what the market gives, not what your ego wants."
Stay mechanical. Stay focused. Let the probabilities work.
FX:GBPUSD
AUDUSD – DAILY FORECAST Q3 | W31 | D30 | Y25📊 AUDUSD – DAILY FORECAST
Q3 | W31 | D30 | Y25
Daily Forecast 🔍📅
Here’s a short diagnosis of the current chart setup 🧠📈
Higher time frame order blocks have been identified — these are our patient points of interest 🎯🧭.
It’s crucial to wait for a confirmed break of structure 🧱✅ before forming a directional bias.
This keeps us disciplined and aligned with what price action is truly telling us.
📈 Risk Management Protocols
🔑 Core principles:
Max 1% risk per trade
Only execute at pre-identified levels
Use alerts, not emotion
Stick to your RR plan — minimum 1:2
🧠 You’re not paid for how many trades you take, you’re paid for how well you manage risk.
🧠 Weekly FRGNT Insight
"Trade what the market gives, not what your ego wants."
Stay mechanical. Stay focused. Let the probabilities work.
FX:AUDUSD

XAUUSD: July 30th Market Analysis and StrategyGold Technical Analysis:
Daily Chart Resistance: 3351, Support: 3300
4-Hour Chart Resistance: 3340, Support: 3310
1-Hour Chart Resistance: 3334, Support: 3315.
Trading risk will increase today. We will focus on the Federal Reserve's interest rate decision and the ADP employment data, which are expected to increase market liquidity. If trading, please avoid news releases.
On the daily chart: Bollinger Bands are moving horizontally, with gold prices trading above the lower band. The MACD indicator has formed a downward death cross, indicating a release of bearish momentum. The RSI indicator has fallen back into the overbought range of 50-40, indicating a clear bottoming out and rebound in gold prices.
On the 4-Hour Chart: Bollinger Bands are narrowing, with gold prices trading near the middle band. The MACD indicator is beginning to turn upward, and the RSI is showing an oversold rebound. Gold prices are poised for an upward rebound! The NY market is focusing on the $3351 resistance level above and the $3308 support level below.
SELL: 3351near
BUY: 3315near

DXY: Bulls Are Winning! Long!
My dear friends,
Today we will analyse DXY together☺️
The in-trend continuation seems likely as the current long-term trend appears to be strong, and price is holding above a key level of 98.471 So a bullish continuation seems plausible, targeting the next high. We should enter on confirmation, and place a stop-loss beyond the recent swing level.
❤️Sending you lots of Love and Hugs❤️

GOLD: Next Move Is Down! Short!
My dear friends,
Today we will analyse GOLD together☺️
The market is at an inflection zone and price has now reached an area around 3,328.24 where previous reversals or breakouts have occurred.And a price reaction that we are seeing on multiple timeframes here could signal the next move down so we can enter on confirmation, and target the next key level of 3,318.05..Stop-loss is recommended beyond the inflection zone.
❤️Sending you lots of Love and Hugs❤️

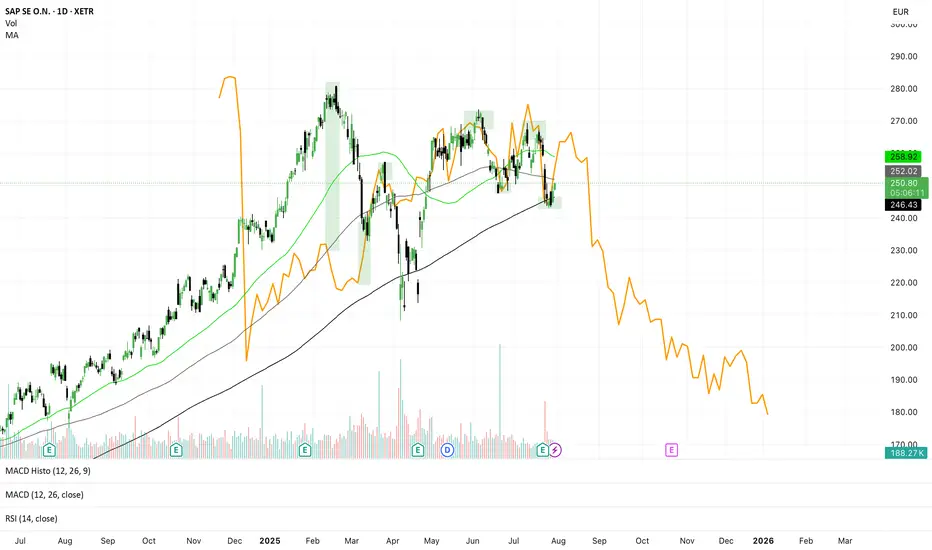
SAP Gann-Method... down potential📈 SAP SE – Gann Projection Signals Major Downside Risk
📅 July 30, 2025 | TF: Daily | Ticker: SAP.XETR
🧠 Concept
Using a historical correction (orange line) from SAP’s past — projected into the future using Gann symmetry — we might be witnessing a repeating time-price pattern. This method suggests the current market is rhyme-repeating a prior bearish phase.
🔍 Technical Highlights
🟢 Current Price: €250.60
📉 Bearish Projection (orange): suggests steep decline into Q4 2025, possibly toward €180
📊 Price reacting near MA200 (~€258) and MA50 (~€246) → tight squeeze zone
📉 MACD bearish, RSI neutral/slightly weak (~44)
📐 Gann Interpretation
The orange fractal projects an accelerated downtrend starting from this level — mirroring the structure of a previous correction in SAP.
Gann symmetry often aligns time and price harmonics, and right now:
📅 Time match: We're at a comparable point in the cycle
💶 Price zone match: Similar resistance/consolidation structure
🧭 Trade Setup
🟥 Short Bias if Breakdown Confirmed
Entry: Below €246
Targets:
▸ €225
▸ €210
▸ €185 (end of fractal projection)
Stop: above €258 (or trendline resistance)
🟩 Invalidation / Bullish Breakout
Close above €258 with strong volume
Watch for Gann failure → possible breakout to €268–€280
🧊 Risk Note
This is a fractal-based idea — not guaranteed, but supported by price structure and momentum. Confirmation from volume, RSI breakdowns, or macro catalysts is key.
EURUSD: Target Is Down! Short!
My dear friends,
Today we will analyse EURUSD together☺️
The price is near a wide key level
and the pair is approaching a significant decision level of 1.15428 Therefore, a strong bearish reaction here could determine the next move down.We will watch for a confirmation candle, and then target the next key level of 115186..Recommend Stop-loss is beyond the current level.
❤️Sending you lots of Love and Hugs❤️

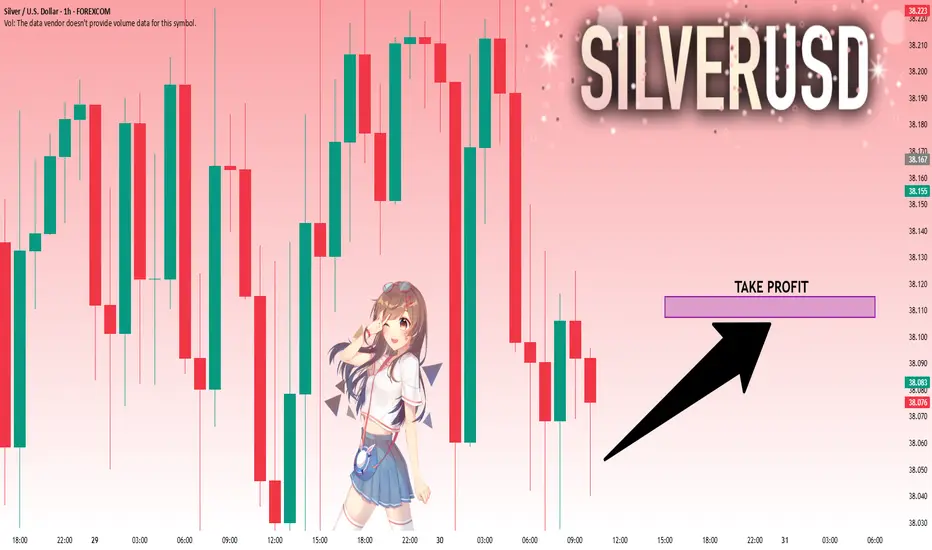
SILVER: Move Up Expected! Long!
My dear friends,
Today we will analyse SILVER together☺️
The recent price action suggests a shift in mid-term momentum. A break above the current local range around 38.054 will confirm the new direction upwards with the target being the next key level of 38.107 and a reconvened placement of a stop-loss beyond the range.
❤️Sending you lots of Love and Hugs❤️
USDJPY – DAILY FORECAST Q3 | W31 | D30 | Y25📊 USDJPY – DAILY FORECAST
Q3 | W31 | D30 | Y25
Daily Forecast 🔍📅
Here’s a short diagnosis of the current chart setup 🧠📈
Higher time frame order blocks have been identified — these are our patient points of interest 🎯🧭.
It’s crucial to wait for a confirmed break of structure 🧱✅ before forming a directional bias.
This keeps us disciplined and aligned with what price action is truly telling us.
📈 Risk Management Protocols
🔑 Core principles:
Max 1% risk per trade
Only execute at pre-identified levels
Use alerts, not emotion
Stick to your RR plan — minimum 1:2
🧠 You’re not paid for how many trades you take, you’re paid for how well you manage risk.
🧠 Weekly FRGNT Insight
"Trade what the market gives, not what your ego wants."
Stay mechanical. Stay focused. Let the probabilities work.
FX:USDJPY

EURUSD – DAILY FORECAST Q3 | W31 | D30 | Y25📊 EURUSD – DAILY FORECAST
Q3 | W31 | D30 | Y25
Daily Forecast 🔍📅
Here’s a short diagnosis of the current chart setup 🧠📈
Higher time frame order blocks have been identified — these are our patient points of interest 🎯🧭.
It’s crucial to wait for a confirmed break of structure 🧱✅ before forming a directional bias.
This keeps us disciplined and aligned with what price action is truly telling us.
📈 Risk Management Protocols
🔑 Core principles:
Max 1% risk per trade
Only execute at pre-identified levels
Use alerts, not emotion
Stick to your RR plan — minimum 1:2
🧠 You’re not paid for how many trades you take, you’re paid for how well you manage risk.
🧠 Weekly FRGNT Insight
"Trade what the market gives, not what your ego wants."
Stay mechanical. Stay focused. Let the probabilities work.
FX:EURUSD
AUDCAD – DAILY FORECAST Q3 | W31 | D30 | Y25
📊 AUDCAD – DAILY FORECAST
Q3 | W31 | D30 | Y25
Daily Forecast 🔍📅
Here’s a short diagnosis of the current chart setup 🧠📈
Higher time frame order blocks have been identified — these are our patient points of interest 🎯🧭.
It’s crucial to wait for a confirmed break of structure 🧱✅ before forming a directional bias.
This keeps us disciplined and aligned with what price action is truly telling us.
📈 Risk Management Protocols
🔑 Core principles:
Max 1% risk per trade
Only execute at pre-identified levels
Use alerts, not emotion
Stick to your RR plan — minimum 1:2
🧠 You’re not paid for how many trades you take, you’re paid for how well you manage risk.
🧠 Weekly FRGNT Insight
"Trade what the market gives, not what your ego wants."
Stay mechanical. Stay focused. Let the probabilities work.
FX:AUDCAD

AUDJPY – DAILY FORECAST Q3 | W31 | D30 | Y25
📊 AUDJPY – DAILY FORECAST
Q3 | W31 | D30 | Y25
Daily Forecast 🔍📅
Here’s a short diagnosis of the current chart setup 🧠📈
Higher time frame order blocks have been identified — these are our patient points of interest 🎯🧭.
It’s crucial to wait for a confirmed break of structure 🧱✅ before forming a directional bias.
This keeps us disciplined and aligned with what price action is truly telling us.
📈 Risk Management Protocols
🔑 Core principles:
Max 1% risk per trade
Only execute at pre-identified levels
Use alerts, not emotion
Stick to your RR plan — minimum 1:2
🧠 You’re not paid for how many trades you take, you’re paid for how well you manage risk.
🧠 Weekly FRGNT Insight
"Trade what the market gives, not what your ego wants."
Stay mechanical. Stay focused. Let the probabilities work.
FX:AUDJPY

#XAI/USDT breakout Buy breakout,#XAI
The price is moving within an ascending channel on the 1-hour frame, adhering well to it, and is on its way to breaking strongly upwards and retesting it.
We have support from the lower boundary of the ascending channel, at 0.0511.
We have a downtrend on the RSI indicator that is about to break and retest, supporting the upside.
There is a major support area in green at 0.0513, which represents a strong basis for the upside.
Don't forget a simple thing: ease and capital.
When you reach the first target, save some money and then change your stop-loss order to an entry order.
For inquiries, please leave a comment.
We have a trend to hold above the 100 Moving Average.
Entry price: 0.0591.
First target: 0.0547.
Second target: 0.0568.
Third target: 0.0591.
Don't forget a simple thing: ease and capital.
When you reach your first target, save some money and then change your stop-loss order to an entry order.
For inquiries, please leave a comment.
Thank you.

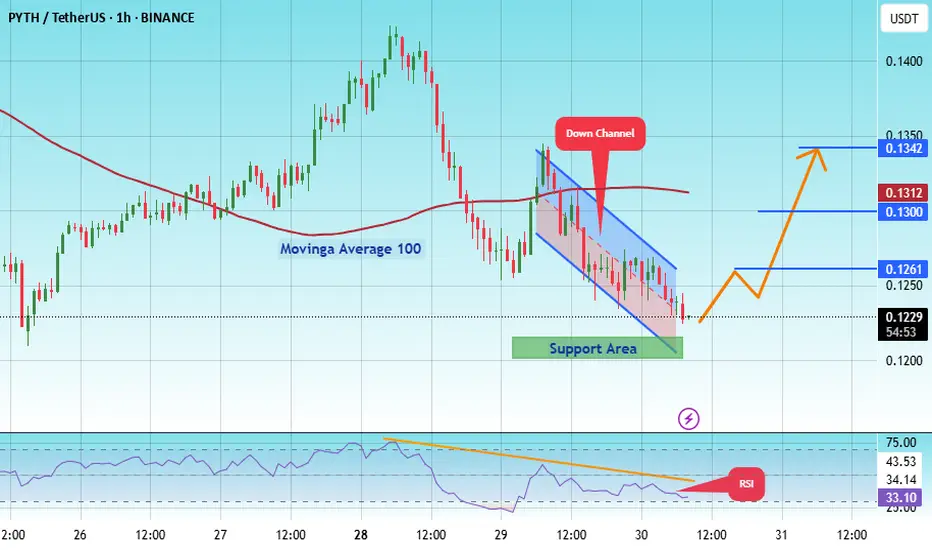
#PYTH/USDT#PYTH
The price is moving within an ascending channel on the 1-hour frame, adhering well to it, and is on track to break it strongly upwards and retest it.
We have support from the lower boundary of the ascending channel, at 1215.
We have a downtrend on the RSI indicator that is about to break and retest, supporting the upside.
There is a major support area in green at 0.1200, which represents a strong basis for the upside.
Don't forget a simple thing: ease and capital.
When you reach the first target, save some money and then change your stop-loss order to an entry order.
For inquiries, please leave a comment.
We have a trend to hold above the 100 Moving Average.
Entry price: 0.1230
First target: 0.1261
Second target: 0.1300
Third target: 0.1342
Don't forget a simple thing: ease and capital.
When you reach your first target, save some money and then change your stop-loss order to an entry order.
For inquiries, please leave a comment.
Thank you.
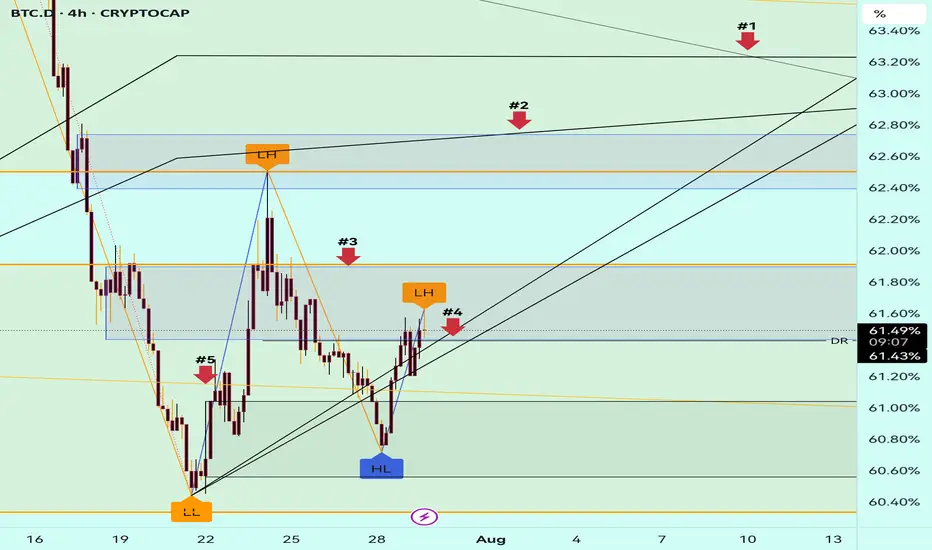
#BTC.D Update 29.07.2025BTC Dominance is trying to break above the black resistance lines, but honestly, I don't see enough strength yet to confirm a full reversal. On the daily timeframe, it’s still holding a strong downtrend structure. 🟥
🔍 If price manages to break above Arrow #4, we still have a key resistance at Arrow #3, which won’t be easy to pass.
On the lower timeframes, there are already a few bearish signs forming — but nothing solid enough yet for confirmation.
⚠️ That’s why I prefer to wait for today's daily candle to close before making any new decisions. There's also a chance BTC.D may retest Arrow #3 before reversing again.
💡 What does this mean for us?
It’s not time to jump in just yet — but the moment is getting closer, Insha Allah. If this dominance starts to turn down again, we could soon see ALTCOINS shine once more! 🌟
📈 Be ready. Stay focused. Patience pays in this game. 🚀
Altseason might just be warming up!
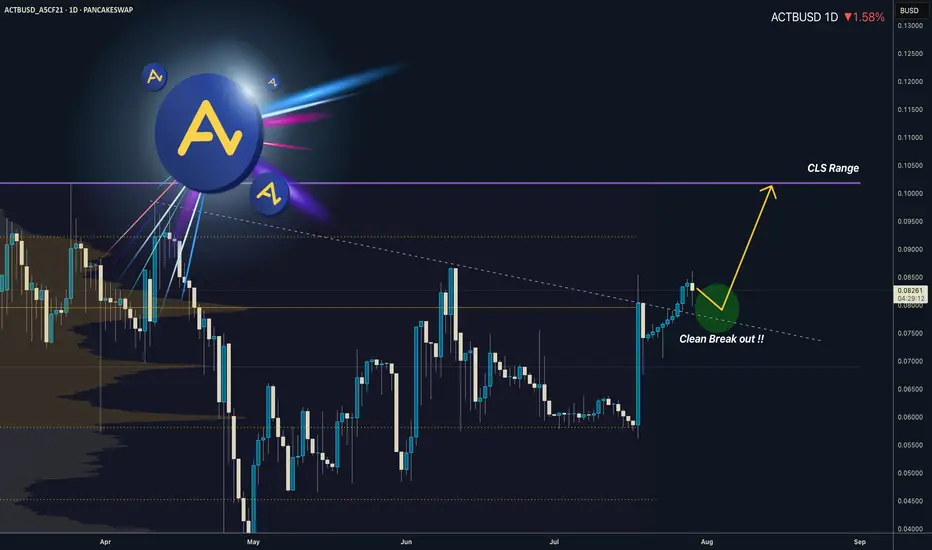
ACTB I Weekly CLS High In play I Clean Break OutFresh Crypto Analysis— if you’ve been riding with me, you already know:
🎯My system is 100% mechanical. No emotions. No trend lines. No subjective guessing. Working all timeframes. Just precision, structure, and sniper entries.
🧠 What’s CLS?
It’s the real smart money. The invisible hand behind $7T/day — banks, algos, central players.
📍Model 1:
HTF bias based on the daily and weekly candles closes,
Wait for CLS candle to be created and manipulated. Switch to correct LTF and spot CIOD. Enter and target 50% of the CLS candle.
For high probability include Dealing Ranges, Weekly Profiles and CLS Timing.
Analysis done on the
“Adapt what is useful. Reject whats useless and add whats is specifically yours.”
David Perk aka Dave FX Hunter
💬 Comment any Coin I ll give you my quick view
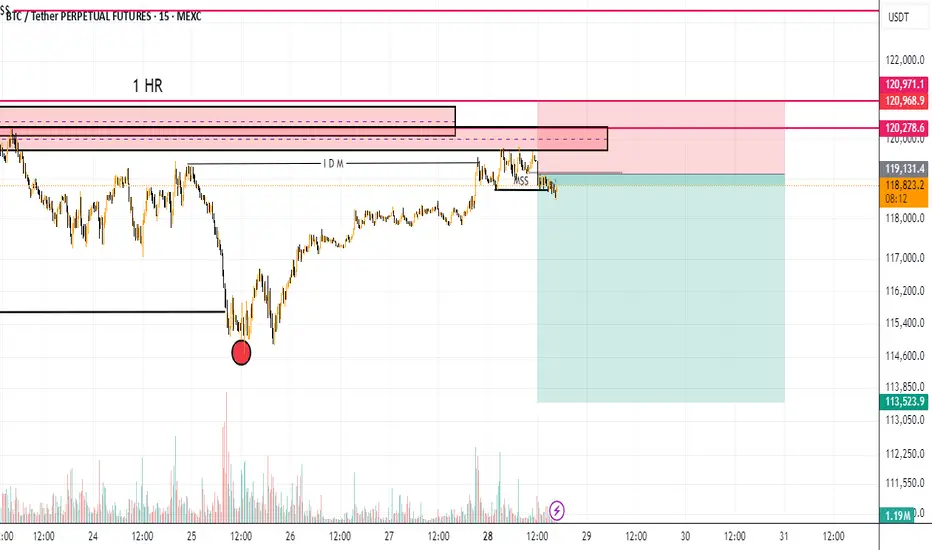
btc short tradeon 1hr timeframe btc take the inducement and on 15m done MSS and now rice going to retest the 15m advanced oder block
entry 19131
stoploss 120990
target 1; 114685
target 2 ; 113650