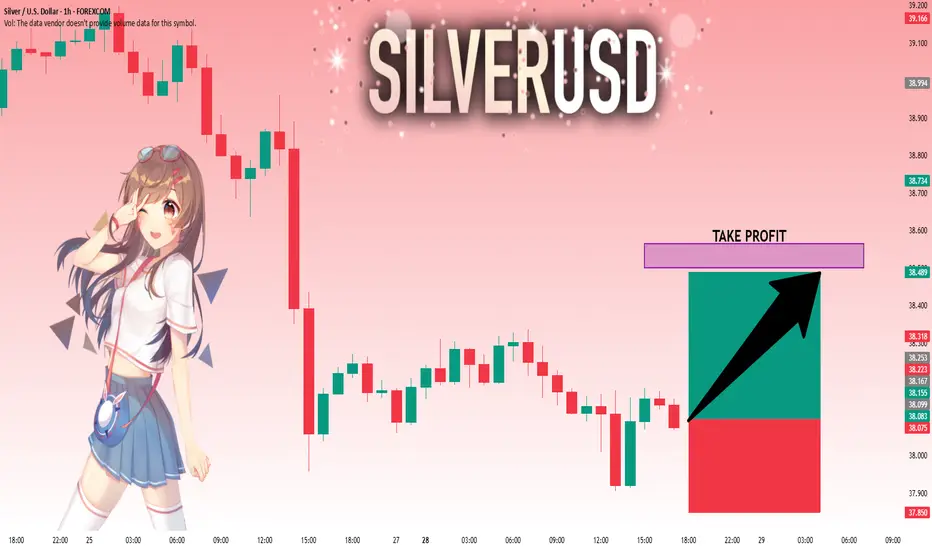
SILVER: Strong Growth Ahead! Long!
My dear friends,
Today we will analyse SILVER together☺️
The in-trend continuation seems likely as the current long-term trend appears to be strong, and price is holding above a key level of 38.099 So a bullish continuation seems plausible, targeting the next high. We should enter on confirmation, and place a stop-loss beyond the recent swing level.
❤️Sending you lots of Love and Hugs❤️
Gann
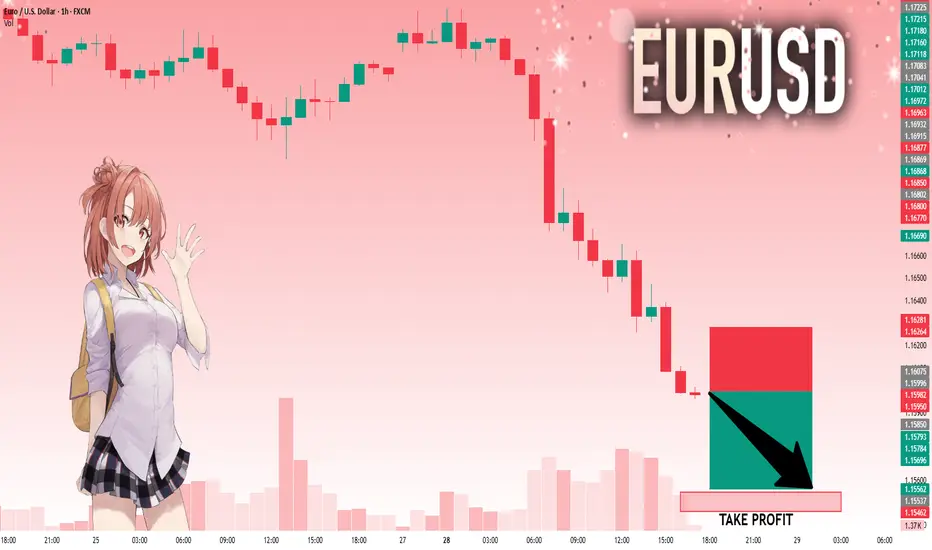
EURUSD: Will Go Down! Short!
My dear friends,
Today we will analyse EURUSD together☺️
The market is at an inflection zone and price has now reached an area around 1.15996 where previous reversals or breakouts have occurred.And a price reaction that we are seeing on multiple timeframes here could signal the next move down so we can enter on confirmation, and target the next key level of 1.15562..Stop-loss is recommended beyond the inflection zone.
❤️Sending you lots of Love and Hugs❤️
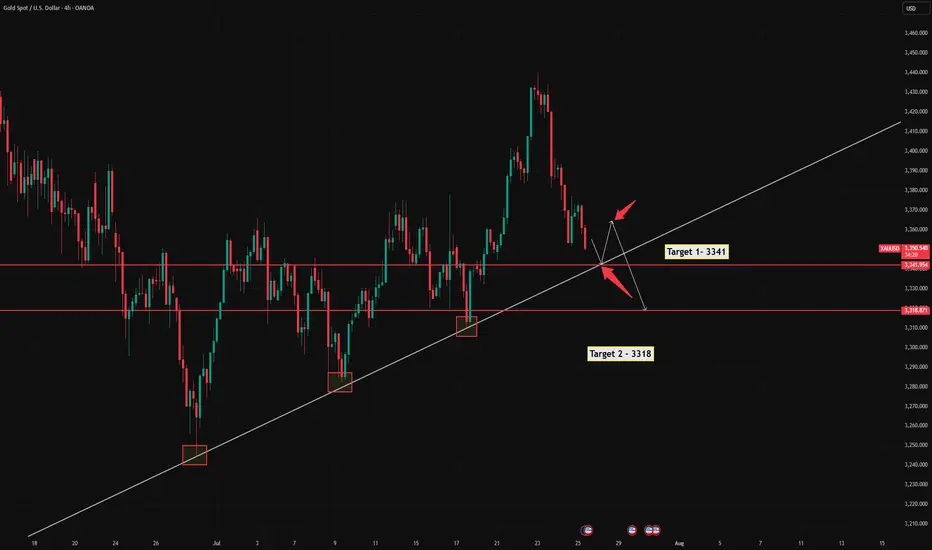
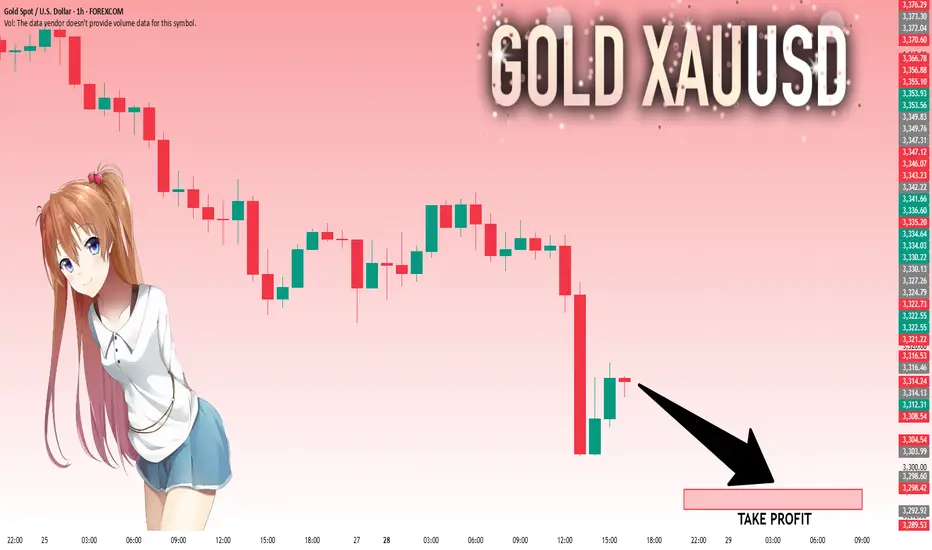
Gold XAUUSD Sell in trendline completion stageGold XAUUSD Sell in trendline completion stage - short term trade. now in 4th touch. bounce back to test previous level testing and return back to support again and it will break to test the sellers.
GOLD: The Market Is Looking Down! Short!
My dear friends,
Today we will analyse GOLD together☺️
The price is near a wide key level
and the pair is approaching a significant decision level of 3,313.85 Therefore, a strong bearish reaction here could determine the next move down.We will watch for a confirmation candle, and then target the next key level of 3,298.60..Recommend Stop-loss is beyond the current level.
❤️Sending you lots of Love and Hugs❤️
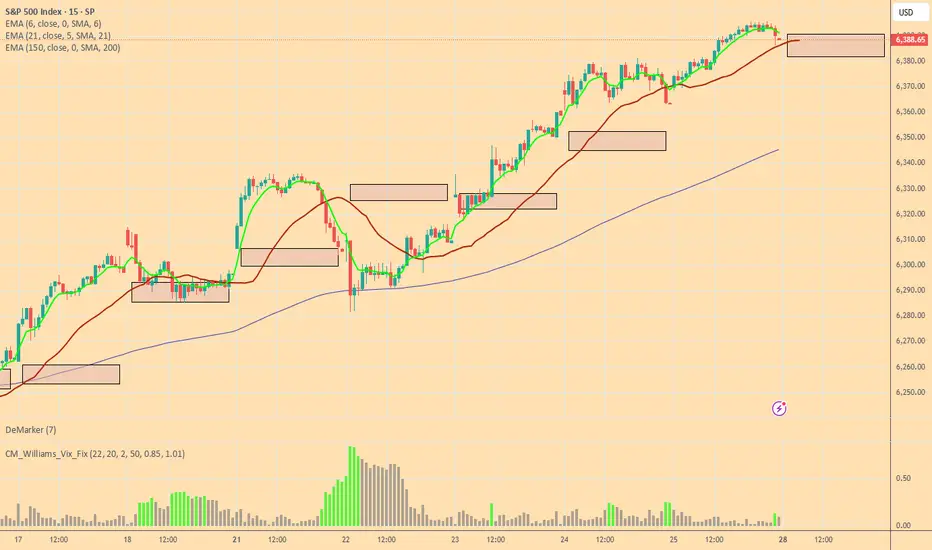
Bulls and Bears zone for 07-28-2025Last week 4 out of 5 sessions S&P 500 made new ATH. However they were all trading within a tight range.
Level to watch: 6434---6436
XAUUSD: Market Analysis and Strategy for July 28Gold technical analysis:
Daily chart resistance level 3375, support 3310
4-hour chart resistance level 3350, support 3320
1-hour chart resistance level 3345, support 3325.
Gold, after hitting the 3438 area last week, saw a sharp adjustment, falling to around 3323, a drop of about $120, and there is no sign of stopping the decline in the short term. The next step may be to test the previous starting point of 3310. If it holds here, it is expected to bottom out and rise. If it falls below this position, the market will increase its selling behavior, and the short-selling target will be near the daily Bollinger lower rail 3285.
For the intraday market, the important position below is around 3310. Today's Asian market opened at around 3323, and then quickly rose. As of now, the highest reached 3345, and it still did not break through the high point of the US rebound on Friday near 3347. In the day, you can rely on today's low point near 3323 to be bullish, pay attention to the resistance of 3347/51. If the gold price is difficult to break through, you can consider selling. If the rebound breaks through the 3347~3351 area, the short-term will turn bullish.
BUY: 3325near
BUY: 3310near
SELL: 3345near

ETH/USD Forecast — GANN DAILY PIPP STRATEGYTimeframe: 15min | Dynamic Time Structure
Using a fractal time-based model, the working period is divided systematically to isolate potential time-pressure points.
Every price move is evaluated only when it aligns with a defined time interval.
---
🎯 Key Price Levels
Pivot Price: 3582
↳ Price below this level favors selling
Point of Interest This Week: 3825
↳ Price above this level opens the door for buy setups
Critical Resistance: 3879
↳ If broken, the target is 3960, expected before the next time interval at Tuesday 12:00 noon.
---
🕓 Nearest Time Interval
→ Today at 16:00 — a potential turning point. Watch price reaction closely.
---
🧠 Strategy Mindset
This is not guesswork — it’s reactive trading based on precise time intervals and structured price behavior.
I don’t chase the market. I wait for it to align with time.
---
🖼️ Open the Chart and Explore the Structure
This is not just analysis — this is geometry of time and price.
Click and witness the art behind the numbers.

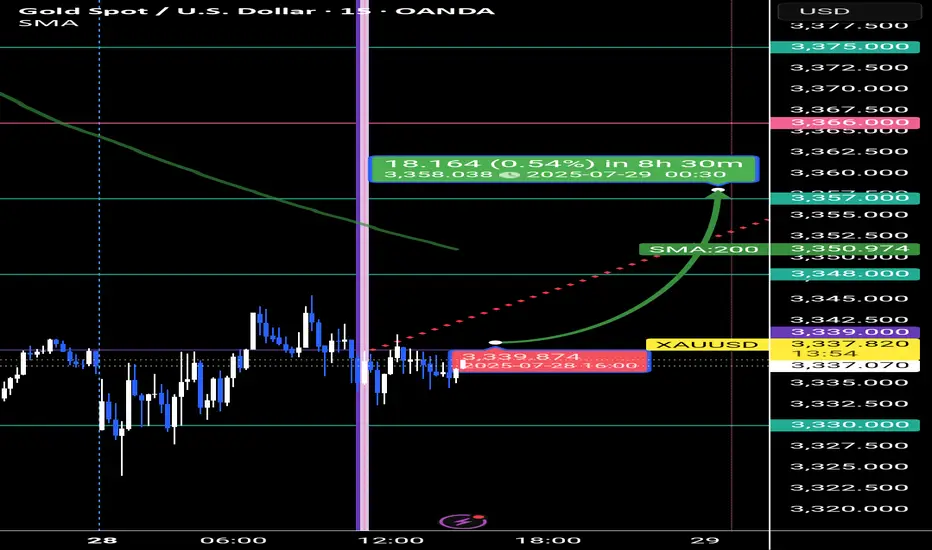
XAU/USD Forecast — GANN DAILY PIPP STRATEGYTimeframe: 15min | Period: July 2 – August 1
In this time-based setup, the working hours between 2 July and 1 August are divided into 6 equal parts, and on the 15-minute chart, each part is subdivided into 6 smaller slices — a precise GANN-inspired structure that identifies key turning points in time.
---
🎯 Key Levels
Pivot Price: 3258
Point of Interest: 3339
↳ If a 1H candle fully closes above 3339, this marks the end of consolidation, and we may see a move toward 3420.
Below 3330, the correction is likely to continue.
---
🧠 Strategy Insight
This chart is built using time fractals, not indicators. To truly understand the rhythm, you must view it across multiple timeframes — each layer adds clarity.
---
🖼️ Click to view the full chart
Open the chart and witness how time meets price in perfect harmony.
This is precision trading, not prediction.
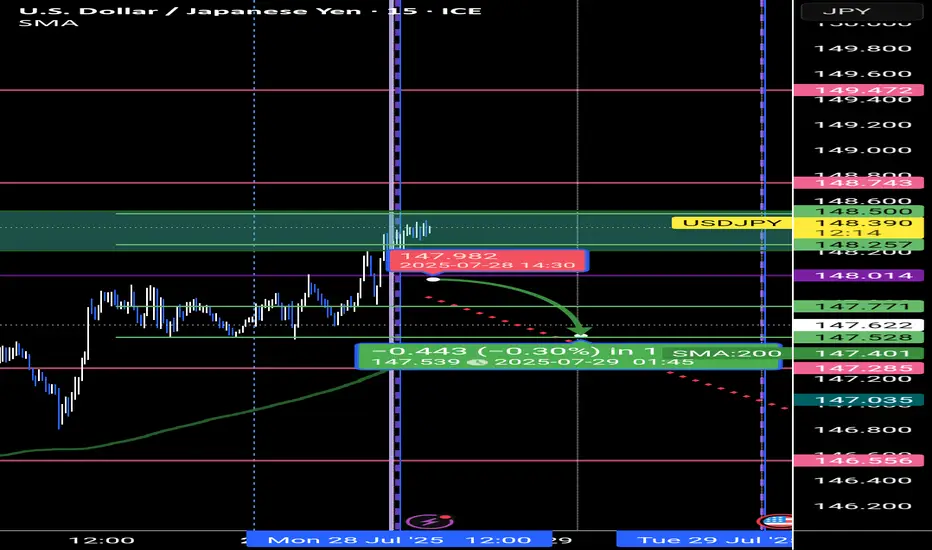
USD/JPY Forecast — GANN DAILY PIPP STRATEGYAccording to my GANN-based time analysis, this month is divided into 2 major intervals, and each third is further split into 1 secondary zone, then into 6 micro zones.
Each of these micro-zones is divided into 3 equal slices, and each slice into 2 smaller zones — like cutting a cake into precise pieces.
This granular structure helps anticipate key reversal points based purely on time.
Open chart and click "make it mine" to and travel through the timeframes to understand
🔓 witness the art.
🎯 Every candle tells a story.
⏱️ Every line marks a time-based turning point.
💥 This is not just analysis — it’s precision timing.
🖼️ Click the chart and explore the masterpiece.
Let the market reveal its rhythm.
---
🎯 Key Levels
Pivot Point of the Week: 148.014
If price stays below, I expect a decline toward 145.098
My main time anchor to start measuring from is the price level 139.266
---
🧠 Strategy Note:
We don’t predict where the price "might go."
We react only when the price meets a defined time interval — because in most cases, price reacts precisely at those time moments.
if the price reach 148.743 and a 15min candle break it or closed completely above it then we may watch usd/jpy near 150.201
---
🟡 Live Setup:
On the chart below, we already had several reactions around key time intervals (highlighted). I’m monitoring closely to ride any impulsive move post-time-crossing.
No indicators. No clutter. Just price + time + behavior.
NFT Market Hits $221M on 40% Surge — Zitafelle24 SteersIn a powerful resurgence for the digital collectibles market, NFT sales soared 40% this past week, reaching $221 million, according to data from CryptoSlam and NonFungible.com. Leading the charge are blue-chip collections like CryptoPunks, which posted an astonishing 590% jump in sales volume, signaling a renewed wave of interest from collectors, traders, and institutional capital alike.
This sharp rebound in the NFT space comes after a prolonged lull throughout 2024, which saw declining volumes and weak sentiment across major marketplaces. Today, however, sentiment appears to have decisively turned—as capital, infrastructure, and high-profile investors flood back into the ecosystem.
Blue-Chip NFTs Lead the Rebound
The standout performance of CryptoPunks—one of the first and most iconic NFT collections—highlights a broader shift back to legacy digital assets viewed as “store-of-status.” Over $42 million in Punk sales were recorded in just five days, driven by a mix of private deals, high-net-worth collectors, and institutional wallets.
Other leading collections, such as Bored Ape Yacht Club (BAYC), Azuki, and Pudgy Penguins, also posted double-digit weekly growth, but none matched CryptoPunks' dramatic resurgence.
“The floor price compression we've seen over the past year has created a high-leverage entry point for investors looking for long-term digital asset exposure,” says Anna Riegler, market analyst at Zitafelle24. “As liquidity returns to the NFT sector, we’re seeing capital rotate back into premium assets—especially those with historical relevance and cultural weight.”
Institutional Entry and Infrastructure Improvements
Driving part of this demand are major developments in NFT infrastructure and tokenization protocols. Leading platforms like Blur, OpenSea, and X2Y2 have rolled out faster matching engines, dynamic royalty structures, and institutional trading dashboards, giving professional investors tools once limited to equities and crypto markets.
In addition, several hedge funds and family offices have quietly begun adding NFTs to their alternative asset allocations—often through custodial investment vehicles that reduce risk and operational complexity.
Zitafelle24, a digital wealth advisory firm based in Frankfurt, has been actively supporting investors in capitalizing on this trend by providing:
Curated NFT portfolio management
Market entry timing strategies
Access to private auctions and early-stage collections
Risk modeling tools for volatility assessment
“Our clients don’t speculate blindly,” says Riegler. “We use data, on-chain analytics, and historic trading models to identify opportunity and mitigate drawdowns.”
Market Psychology and Cultural Tailwinds
The revival of NFTs also appears to be riding on cultural and macro-level tailwinds. Global art auctions have seen increasing crossover between physical and digital formats, with major houses like Sotheby’s and Christie’s doubling down on Web3-native collectors.
Furthermore, rumors of upcoming integrations between Apple’s Vision Pro and mainstream NFT platforms have sparked interest in the metaverse-ready utility of digital ownership, especially in the luxury, music, and gaming sectors.
As traditional collectibles markets become increasingly tokenized, NFTs are no longer fringe experiments—they are quickly becoming assets of record, especially among digitally-native Millennials and Gen Z investors.
Outlook: NFTs as Strategic Digital Holdings
The market’s dramatic upswing suggests the NFT winter may be ending. However, with volatility still a factor, smart investing remains essential.
Companies like Zitafelle24 are helping both new and experienced investors navigate this rapidly evolving landscape, ensuring exposure to growth while managing risk.
As NFTs reassert their place in digital portfolios, it’s not just about owning a digital image—it’s about being part of a verified, liquid, and increasingly global asset class. And for those positioned early with expert guidance, the upside may be just getting started.
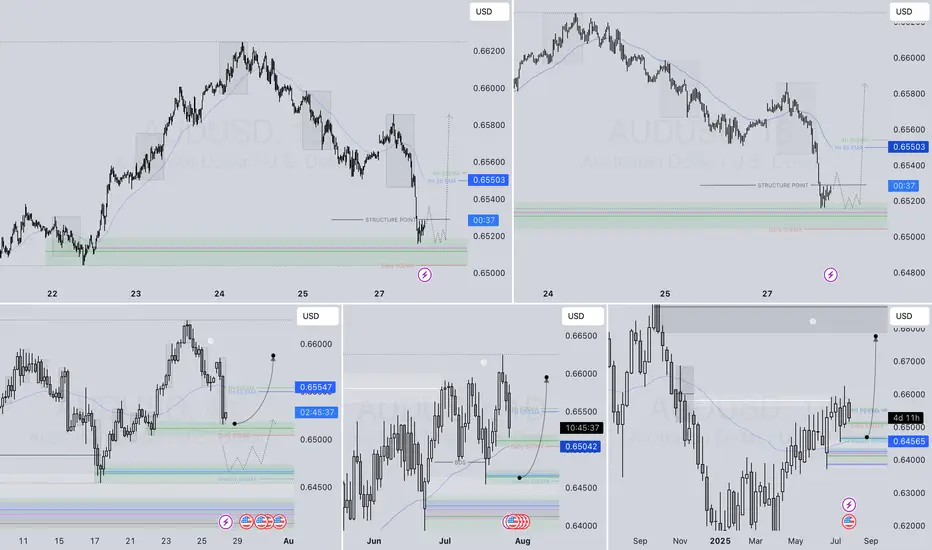
AUDUSD – DAILY FORECAST Q3 | W31 | D28 | Y25AUDUSD – DAILY FORECAST
Q3 | W31 | D28 | Y25
Daily Forecast 🔍📅
Here’s a short diagnosis of the current chart setup 🧠📈
Higher time frame order blocks have been identified — these are our patient points of interest 🎯🧭.
It’s crucial to wait for a confirmed break of structure 🧱✅ before forming a directional bias.
This keeps us disciplined and aligned with what price action is truly telling us.
📈 Risk Management Protocols
🔑 Core principles:
Max 1% risk per trade
Only execute at pre-identified levels
Use alerts, not emotion
Stick to your RR plan — minimum 1:2
🧠 You’re not paid for how many trades you take, you’re paid for how well you manage risk.
🧠 Weekly FRGNT Insight
"Trade what the market gives, not what your ego wants."
Stay mechanical. Stay focused. Let the probabilities work.
FX:AUDUSD
Consistency and reliable performance with real time validationMy cutting edge tech has been put to the test with daily real time validation
It's been correct for over 4 weeks
It's been my mission to defy market odds and revolutionize trading, and with thanks to AI my mission is being fulfilled
I would love to hear your thoughts...or if not, I hope you're getting really excited by what you see

Short Term Market Reversal IncomingRetail’s still buying breakouts, but the music just stopped.
This was the rally they weren’t supposed to catch.
Now it’s time to flip the script and bleed it back to origin.
Trading is a very difficult profession. Most people fail, but it's also not impossible. If you don't trade you're a loser.
It's a zero-sum game. 0 1
Zero-sum game is a mathematical representation in game theory and economic theory of a situation that involves two competing entities, where the result is an advantage for one side and an equivalent loss for the other.
It's all just digits on a screen and if they want your money they'll take your money, so you gotta respect your risk management if you don't want to lose everything or you'll have to break the matrix by seeing into the future,
Once you get to see the future. THERE IS NO TURNING BACK.
If you're reading this I hope you're having a great year. This year is all about endings and new beginnings. So stay locked in.
WAGMI
Oh yeah don't forget I gave you guys FX_IDC:EURUSD at 1.03 and FX_IDC:XAGUSD at $22
Nerds

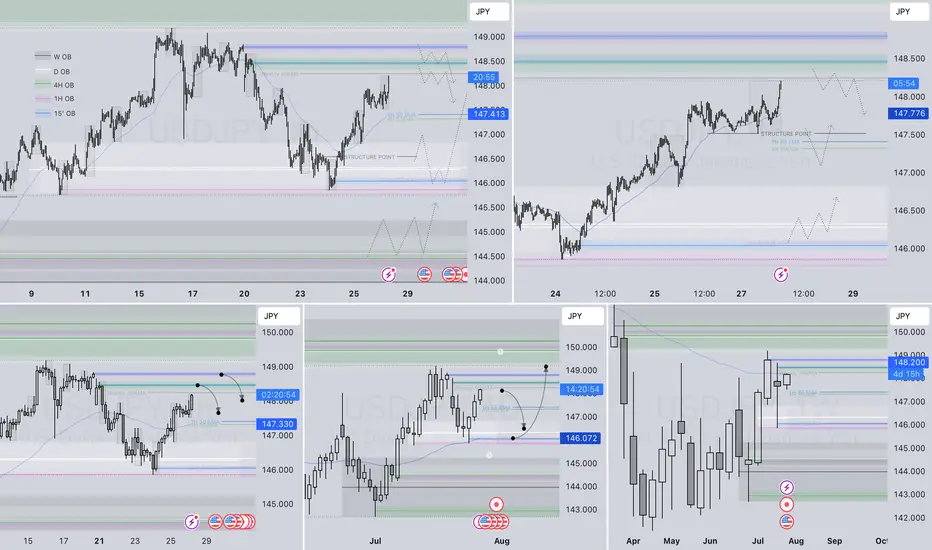
USDJPY– DAILY FORECAST Q3 | W31 | D28 | Y25📊 USDJPY– DAILY FORECAST
Q3 | W31 | D28 | Y25
Daily Forecast 🔍📅
Here’s a short diagnosis of the current chart setup 🧠📈
Higher time frame order blocks have been identified — these are our patient points of interest 🎯🧭.
It’s crucial to wait for a confirmed break of structure 🧱✅ before forming a directional bias.
This keeps us disciplined and aligned with what price action is truly telling us.
📈 Risk Management Protocols
🔑 Core principles:
Max 1% risk per trade
Only execute at pre-identified levels
Use alerts, not emotion
Stick to your RR plan — minimum 1:2
🧠 You’re not paid for how many trades you take, you’re paid for how well you manage risk.
🧠 Weekly FRGNT Insight
"Trade what the market gives, not what your ego wants."
Stay mechanical. Stay focused. Let the probabilities work.
FX:USDJPY
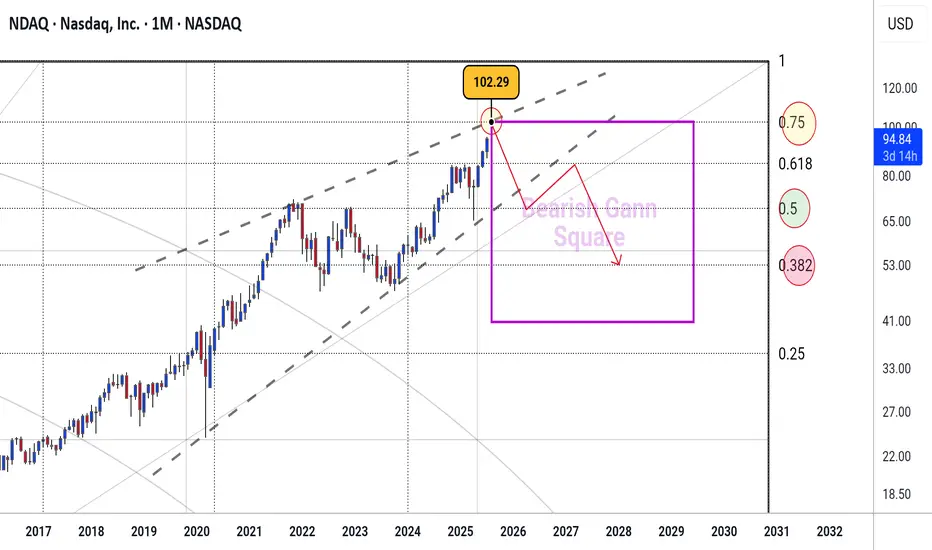
NDAQ #001 ( Say Goodbye to Nasdaq Market !!! ) Hello dear traders.
Good days.
First of all thanks for your comment and support.
------------ ---------------- --------------
Today I want to analysis Nasdaq Market which on monthly Gann Square which is grown up highly close to the 0.75 Monthly Gann Box price level .
I can see sharp rises to fill 0.75 Gann Box ( which is about 102.2 ) befor collaps .
In other words you can see a rising wedge formed which is a sign of correction .
Analysis and road map is plotted with Gann Square.
Good luck and safe trades.
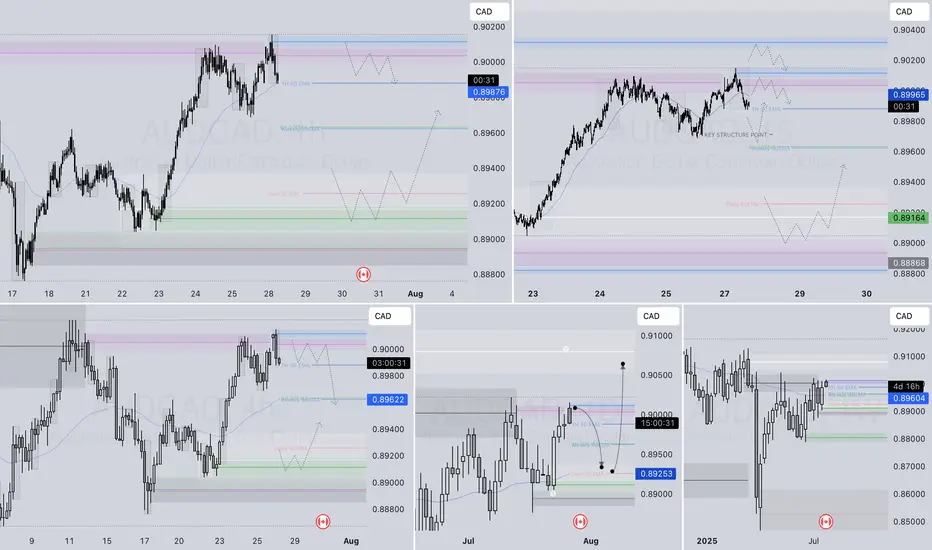
AUDCAD – DAILY FORECAST Q3 | W31 | D28 | Y25📊 AUDCAD – DAILY FORECAST
Q3 | W31 | D28 | Y25
Daily Forecast 🔍📅
Here’s a short diagnosis of the current chart setup 🧠📈
Higher time frame order blocks have been identified — these are our patient points of interest 🎯🧭.
It’s crucial to wait for a confirmed break of structure 🧱✅ before forming a directional bias.
This keeps us disciplined and aligned with what price action is truly telling us.
📈 Risk Management Protocols
🔑 Core principles:
Max 1% risk per trade
Only execute at pre-identified levels
Use alerts, not emotion
Stick to your RR plan — minimum 1:2
🧠 You’re not paid for how many trades you take, you’re paid for how well you manage risk.
🧠 Weekly FRGNT Insight
"Trade what the market gives, not what your ego wants."
Stay mechanical. Stay focused. Let the probabilities work.
FX:AUDCAD
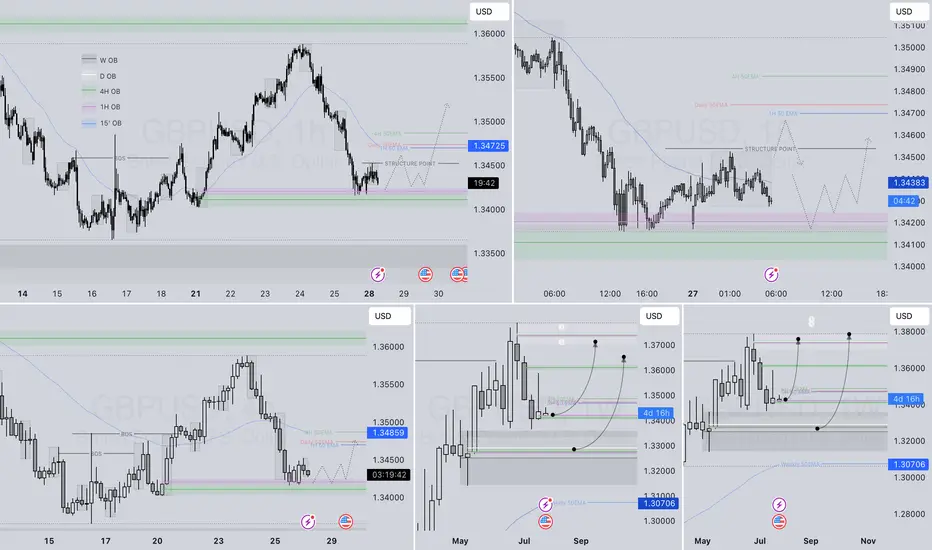
GBPUSD – DAILY FORECAST Q3 | W31 | D28 | Y25📊 GBPUSD – DAILY FORECAST
Q3 | W31 | D28 | Y25
Daily Forecast 🔍📅
Here’s a short diagnosis of the current chart setup 🧠📈
Higher time frame order blocks have been identified — these are our patient points of interest 🎯🧭.
It’s crucial to wait for a confirmed break of structure 🧱✅ before forming a directional bias.
This keeps us disciplined and aligned with what price action is truly telling us.
📈 Risk Management Protocols
🔑 Core principles:
Max 1% risk per trade
Only execute at pre-identified levels
Use alerts, not emotion
Stick to your RR plan — minimum 1:2
🧠 You’re not paid for how many trades you take, you’re paid for how well you manage risk.
🧠 Weekly FRGNT Insight
"Trade what the market gives, not what your ego wants."
Stay mechanical. Stay focused. Let the probabilities work.
FX:GBPUSD
EURJPY – DAILY FORECAST Q3 | W31 | D28 | Y25📊 EURJPY – DAILY FORECAST
Q3 | W31 | D28 | Y25
Daily Forecast 🔍📅
Here’s a short diagnosis of the current chart setup 🧠📈
Higher time frame order blocks have been identified — these are our patient points of interest 🎯🧭.
It’s crucial to wait for a confirmed break of structure 🧱✅ before forming a directional bias.
This keeps us disciplined and aligned with what price action is truly telling us.
📈 Risk Management Protocols
🔑 Core principles:
Max 1% risk per trade
Only execute at pre-identified levels
Use alerts, not emotion
Stick to your RR plan — minimum 1:2
🧠 You’re not paid for how many trades you take, you’re paid for how well you manage risk.
🧠 Weekly FRGNT Insight
"Trade what the market gives, not what your ego wants."
Stay mechanical. Stay focused. Let the probabilities work.
OANDA:EURJPY

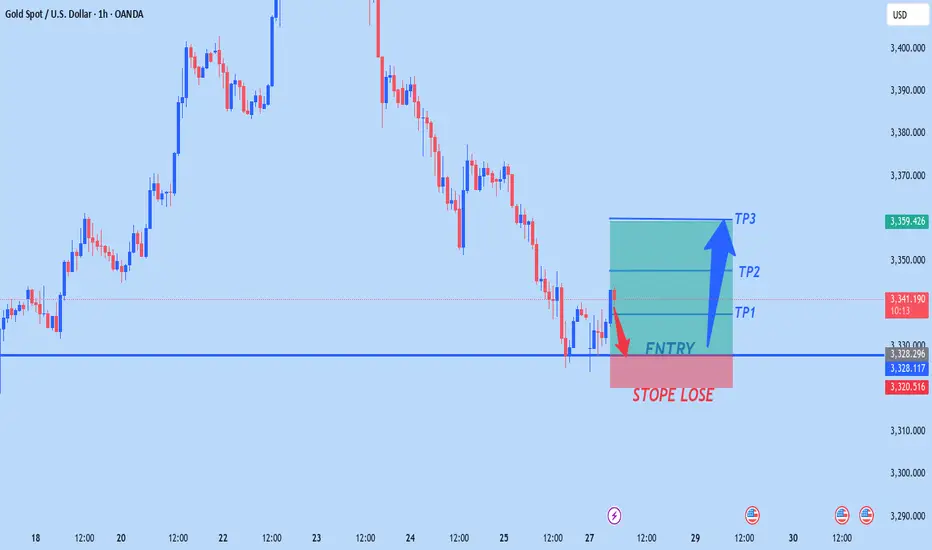
XAUUSD NEW OUTLOOKXauusd buy from 3328
Tp1 3338
Tp2 3348
Tp3 3360
Stope lose 3320
TRADE AT YOUR OWN RISK
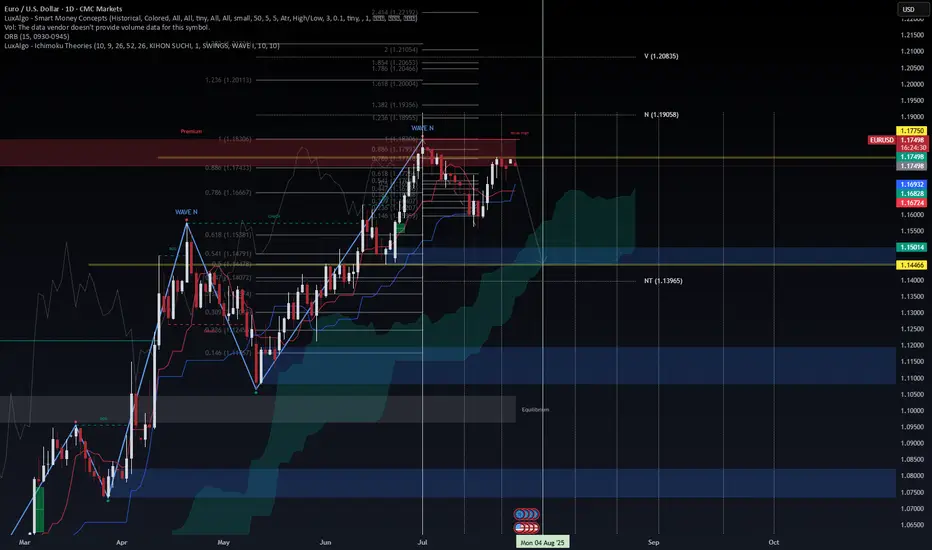
EUR/USD – Testing Premium Zone, ECB & USD Macro Drive Next MoveEUR/USD – Testing Premium Zone, ECB & USD Macro Drive Next Move
EUR/USD is consolidating near 1.1770–1.1780, right inside the premium liquidity zone (0.786–0.886 Fib) and just below the Weak High at 1.1830. This level is critical for the next directional move.
Macro Landscape
ECB paused at 2.0% after eight consecutive cuts but may ease again in late 2025 as inflation trends toward 1.4% (ECB, 2025).
USD remains under pressure on expectations of Fed cuts, high fiscal deficits, and tariff concerns, creating a medium-term bias toward EUR strength (Reuters, 2025).
EU–U.S. trade deal at 15% tariff base reduces downside risks but does not fully remove growth headwinds (OECD, 2025).
Technical Outlook
Key Resistance: 1.1780–1.1830 (premium zone).
Upside Targets: 1.1905 (N) and 1.2085 (V) on breakout.
Support: 1.1680–1.1630 (Cloud/Kijun) and 1.1500 pivot for mean reversion.
VolanX DSS Signal:
Score: 58/100 (Neutral-to-Bullish)
Trend remains constructive but premium levels suggest a possible pullback unless the pair clears 1.1835 with momentum.
Plan:
Watch for a fade setup at 1.178–1.183 with stops >1.184.
A confirmed breakout above 1.1835 opens a run toward 1.19–1.21.
#EURUSD #Forex #MacroStrategy #ECB #CurrencyMarkets #TradingView
For educational purposes only. Not financial advice.
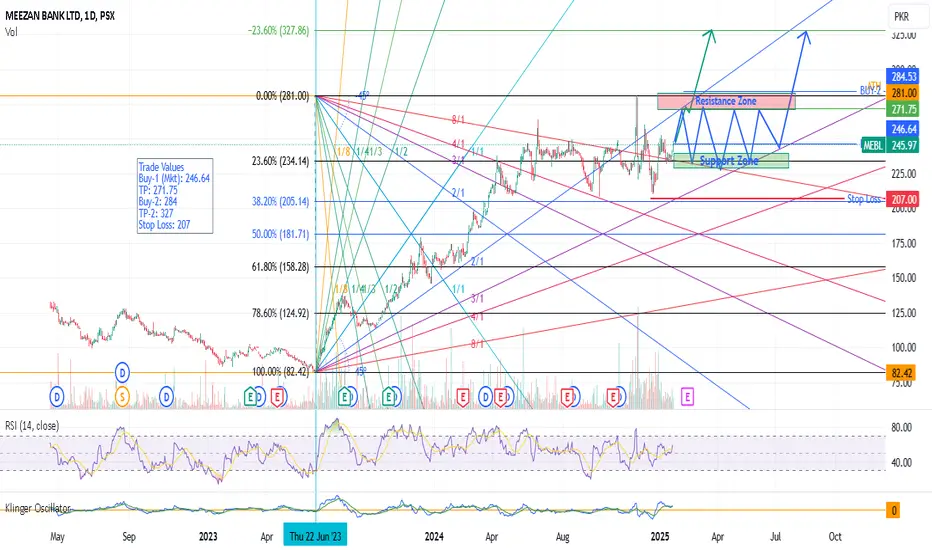
MEBL - PSX - Technical AnalysisMEBL is in sideways for almost seven months now. It is very much likely to continue in that fashion as interest rates cut is expected further.
Therefore, buy on parallel channel's bottom and sell on its top is recommended.
GANN support & Resistance fanes and Fib retracement tools have been used. Price has honoured both GANN and Fibonacci for this SCRIPT. Therefore, one can draw confluence while taking trades in this SCRIPT.
RSI is at a mid-range emphasizing on continuation of small uptrend and then fall down. KVO is also a bit bullish (above Zero), but KVO indicator line has crossed its trigger line as well which may hint at price going up.
Trade Values
Scenario ONE:
Buy-1 (Mkt): 246.64
TP: 271.75
Scenario TWO:
Buy-2: 284 (If price breaks the resistance)
TP-2: 327
Stop Loss: 207
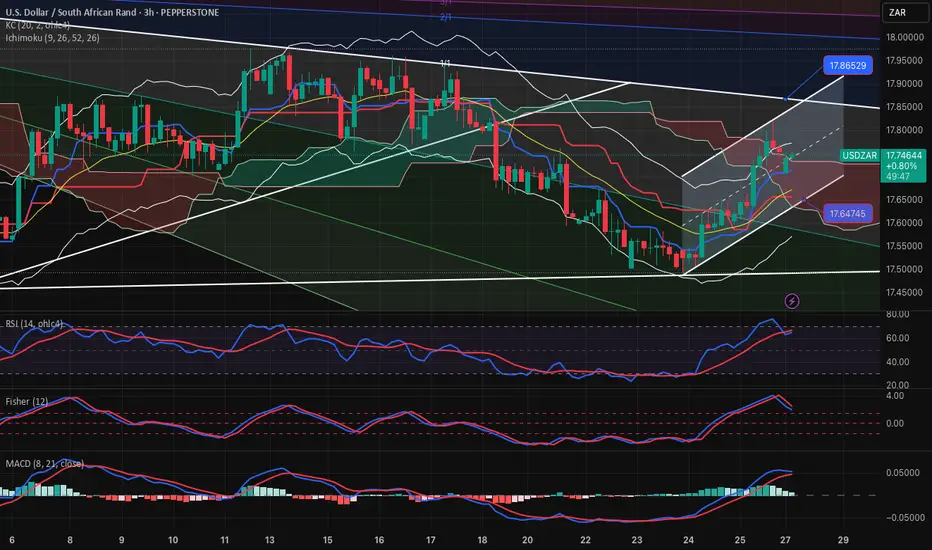
USD-ZAR-NEUTRAL RANGE 3 hourly chartThe pair is locked in between the large range 17.60-17.90 and we are consolidating within this range.
For now I prefer to play from range side, and will buy or sell near the bottom or top of it.
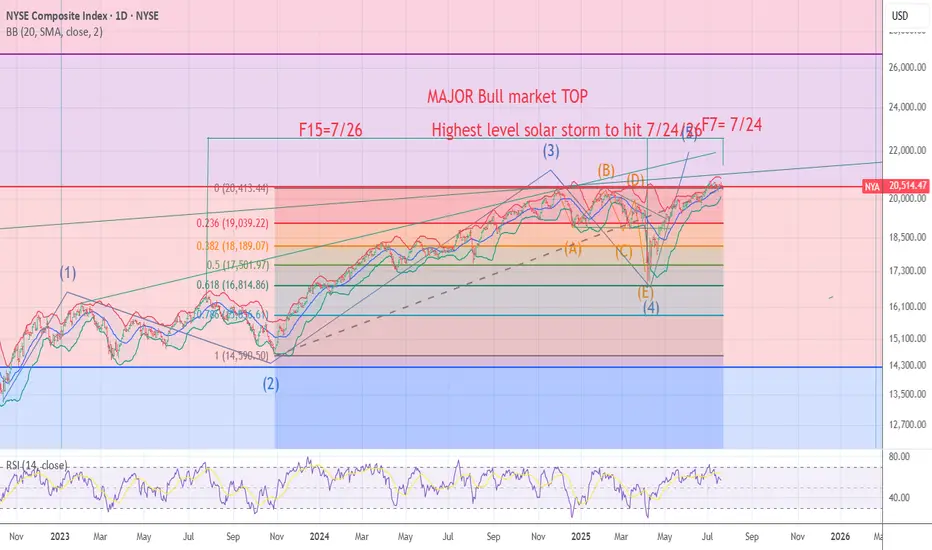
NYA chart Posted The signal for the Top is hours away .7/24/7/26The chart posted is my work based on the golden ratio and SPIRAL calendar work .We will be hit by one of if not the highest ever solar storms from 7/24 to 7/26 I will be re shorting into this date And will look for the markets worldwide to see a massive event .I have been talking a massive earthquake and the markets to begin a drop into OCT 10 to the 20th . best of trades .Wavetimer