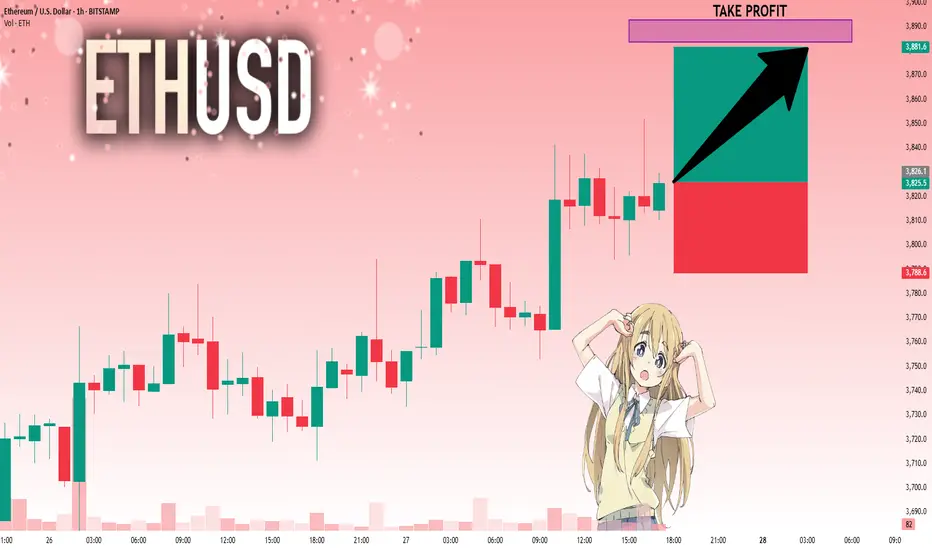
ETHUSD: Strong Bullish Sentiment! Long!
My dear friends,
Today we will analyse ETHUSD together☺️
The recent price action suggests a shift in mid-term momentum. A break above the current local range around 3,826.1 will confirm the new direction upwards with the target being the next key level of 3,883.6 and a reconvened placement of a stop-loss beyond the range.
❤️Sending you lots of Love and Hugs❤️
Gann
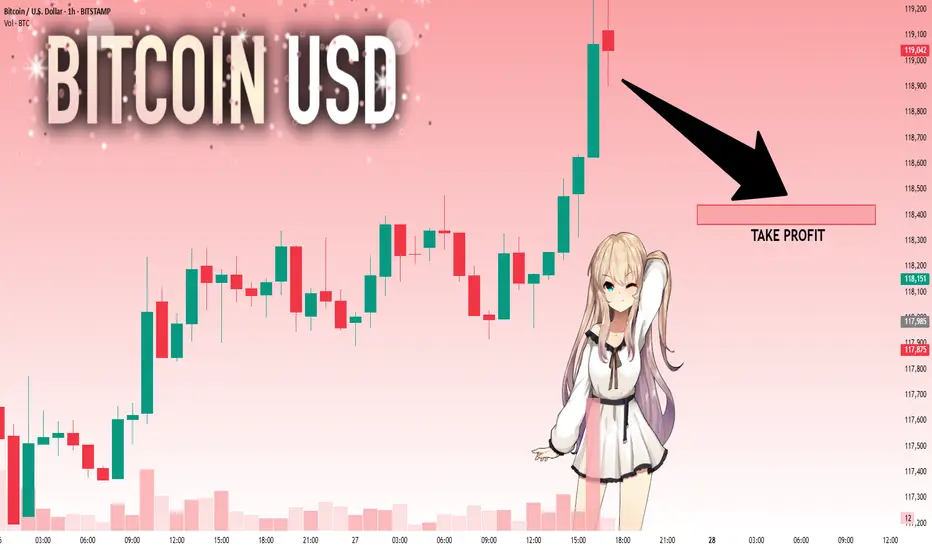
BTCUSD: Bears Are Winning! Short!
My dear friends,
Today we will analyse BTCUSD together☺️
The in-trend continuation seems likely as the current long-term trend appears to be strong, and price is holding below a key level of 118,973 So a bearish continuation seems plausible, targeting the next low. We should enter on confirmation, and place a stop-loss beyond the recent swing level.
❤️Sending you lots of Love and Hugs❤️
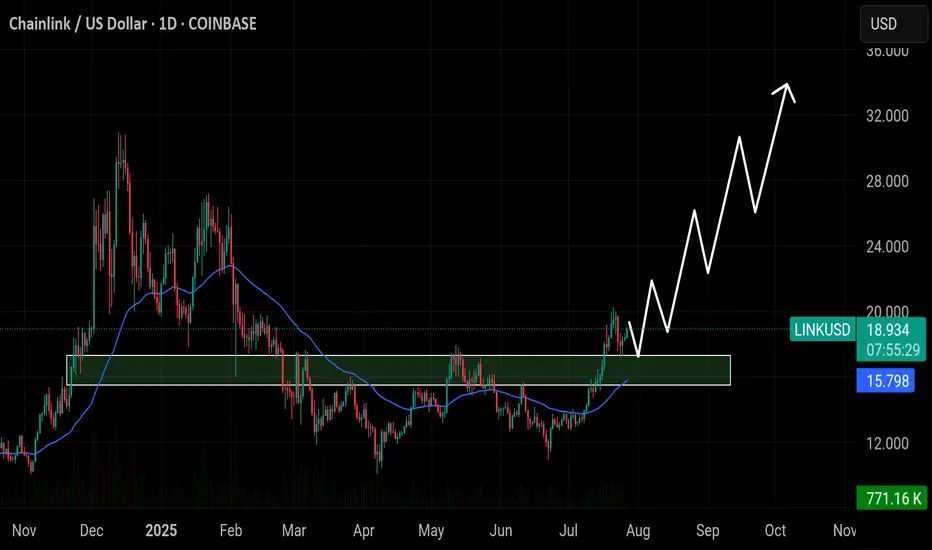
Chainlink ($LINK) has flipped the $15.80 zone into strong supporChainlink ( CRYPTOCAP:LINK ) has flipped the $15.80 zone into strong support — as long as it holds, bullish momentum could push toward $24, $28, and possibly $32 in the coming weeks.
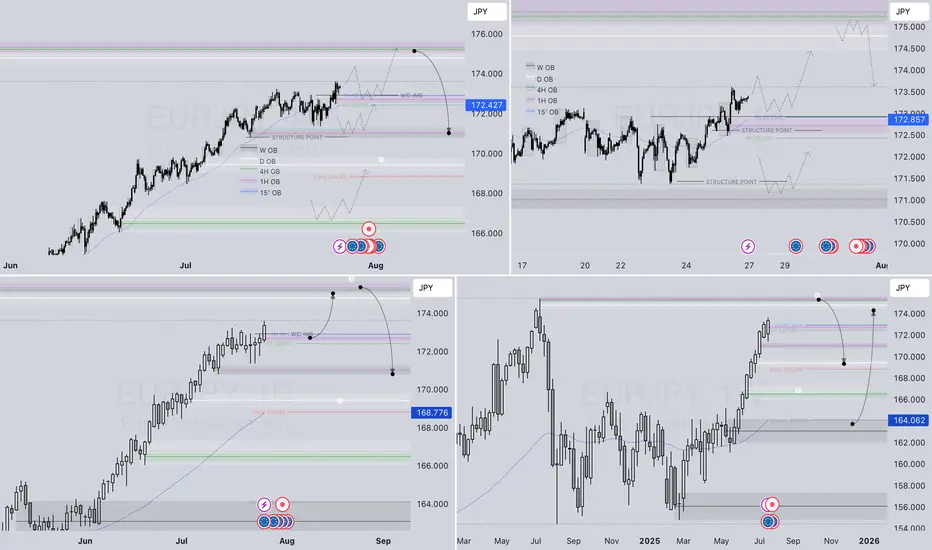
EURJPY – WEEKLY FORECAST Q3 | W31 | Y25📊 EURJPY – WEEKLY FORECAST
Q3 | W31 | Y25
Weekly Forecast 🔍📅
Here’s a short diagnosis of the current chart setup 🧠📈
Higher time frame order blocks have been identified — these are our patient points of interest 🎯🧭.
It’s crucial to wait for a confirmed break of structure 🧱✅ before forming a directional bias.
This keeps us disciplined and aligned with what price action is truly telling us.
📈 Risk Management Protocols
🔑 Core principles:
Max 1% risk per trade
Only execute at pre-identified levels
Use alerts, not emotion
Stick to your RR plan — minimum 1:2
🧠 You’re not paid for how many trades you take, you’re paid for how well you manage risk.
🧠 Weekly FRGNT Insight
"Trade what the market gives, not what your ego wants."
Stay mechanical. Stay focused. Let the probabilities work.
OANDA:EURJPY
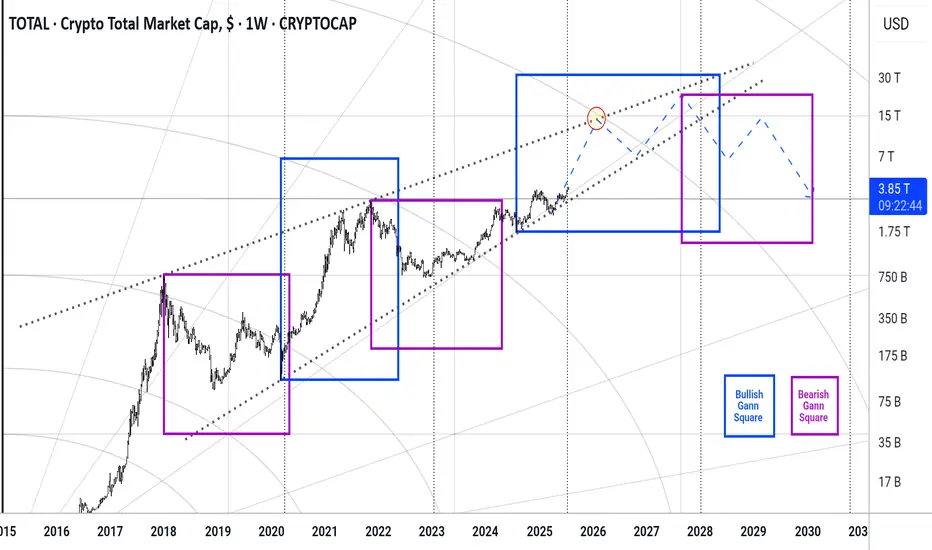
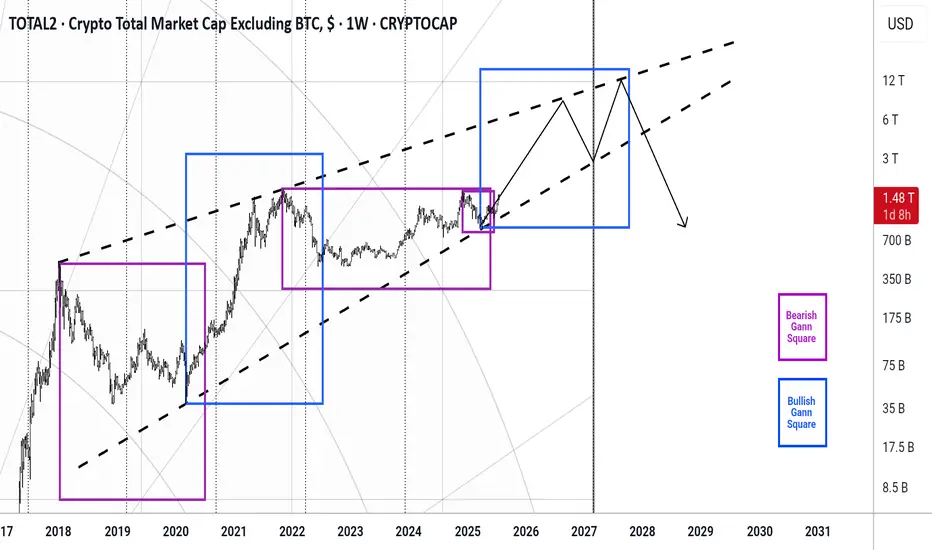
Total #002 ( Look at the Future !!! )Hello dear traders.
Good days.
First of all thanks for your comment and support.
---------------------------------------------------
In beautiful rising wedge of total market cap , the total market in this month broken 0.5 monthly Gann Square price level which means will be ready for test and retest 0.618 for final round befor market collapse.
With refer to the daily Bullish Gann Square ( Blue Square ) and Bearish Gann Square it is expected to within a year market will grow fast .
Safe trades and good luck.
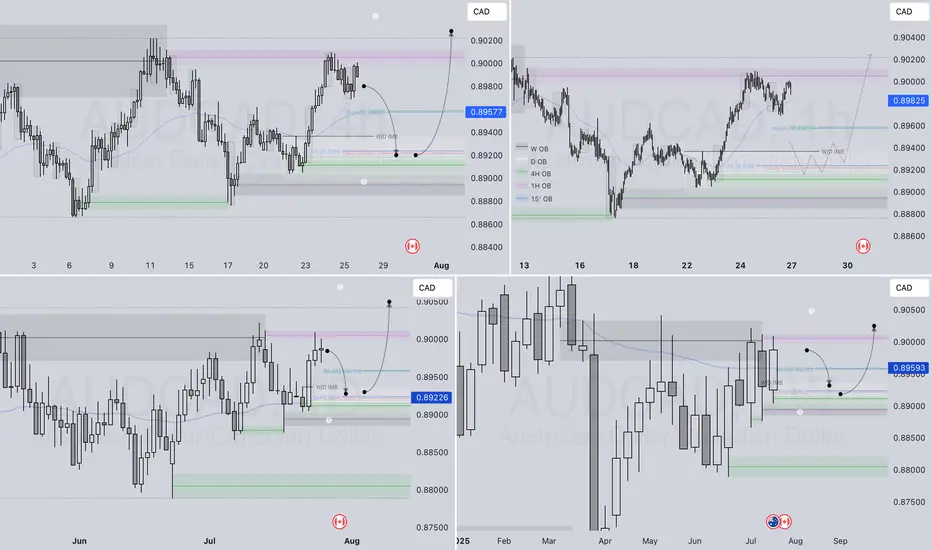
AUDCAD – WEEKLY FORECAST Q3 | W31 | Y25📊 AUDCAD – WEEKLY FORECAST
Q3 | W30 | Y25
Weekly Forecast 🔍📅
Here’s a short diagnosis of the current chart setup 🧠📈
Higher time frame order blocks have been identified — these are our patient points of interest 🎯🧭.
It’s crucial to wait for a confirmed break of structure 🧱✅ before forming a directional bias.
This keeps us disciplined and aligned with what price action is truly telling us.
📈 Risk Management Protocols
🔑 Core principles:
Max 1% risk per trade
Only execute at pre-identified levels
Use alerts, not emotion
Stick to your RR plan — minimum 1:2
🧠 You’re not paid for how many trades you take, you’re paid for how well you manage risk.
🧠 Weekly FRGNT Insight
"Trade what the market gives, not what your ego wants."
Stay mechanical. Stay focused. Let the probabilities work.
FX:AUDCAD
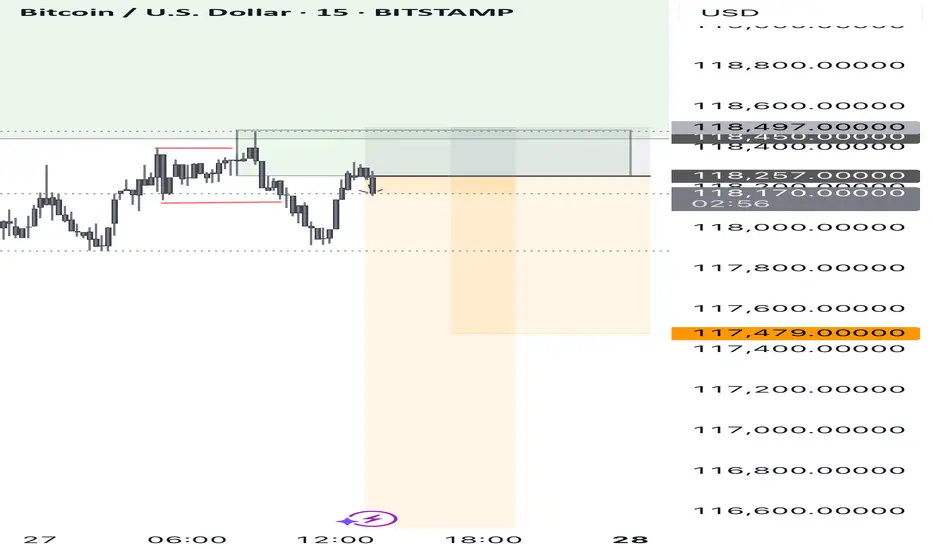
BTC SELL?A nice short opportunity for sell on Btc/Usd.
Intraday trade.
If it get continuation BTC could drop to lower levels.
Aiming for at least 3R
Let’s see how it plays out.
DGKC Monthly Buy Plan — Bullish Outlook📈 DGKC Monthly Buy Plan — Bullish Outlook
✅ Bias: Strongly Bullish
Price has broken major resistance levels with high momentum, forming a big bull trend on the monthly timeframe.
🔍 Key Observations:
Break of Structure:
Price broke past a major resistance zone (previous high).
Strong monthly green candles show institutional interest.
Demand Zone (Blue Box):
A fresh demand zone is formed — a possible area for pullback re-entry.
If price retests this zone, it may offer a high-probability long setup.
Liquidity Magnet Zone (Red Box):
A clear monthly imbalance / supply zone around the 210–220 range.
Could act as a temporary resistance before continuation.
Final Target:
Monthly inefficiency / liquidity target at 273.05, likely the final destination of the move.
Market structure suggests this level can be reached before any major reversal.
🔄 Plan Execution:
🔵 Scenario 1 (Pullback Entry):
Wait for a pullback to the blue demand zone.
Look for lower timeframe confirmation to enter long.
🔵 Scenario 2 (Momentum Continuation):
If price continues without deep pullback, consider smaller timeframes for continuation setups.
Do not chase price; wait for valid structure.

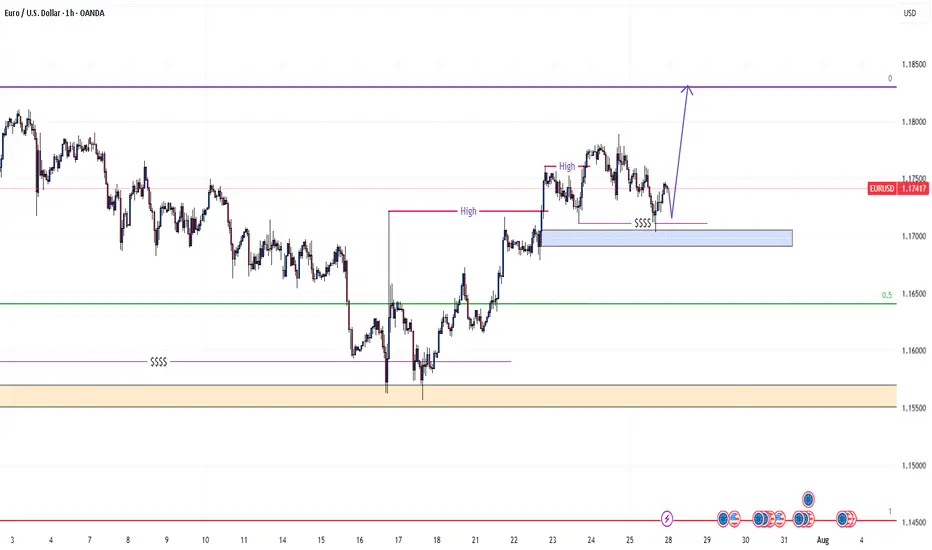
EURUSD 1HConsidering that the one-hour timeframe trend for the EURUSD symbol has turned bullish and liquidity has been collected at the last low, after a price correction in lower timeframes and observing a suitable candlestick setup, one can enter a buy trade and follow the price at least up to 1.18310.
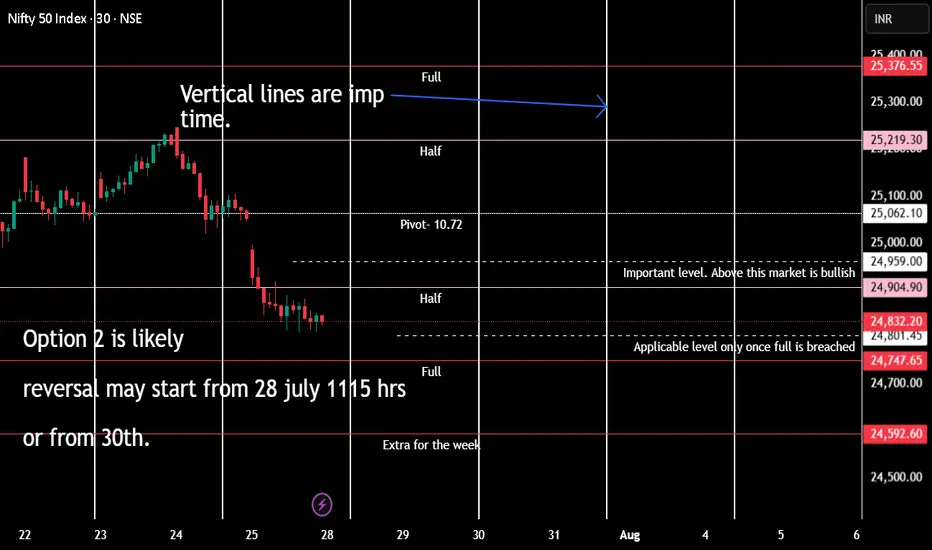
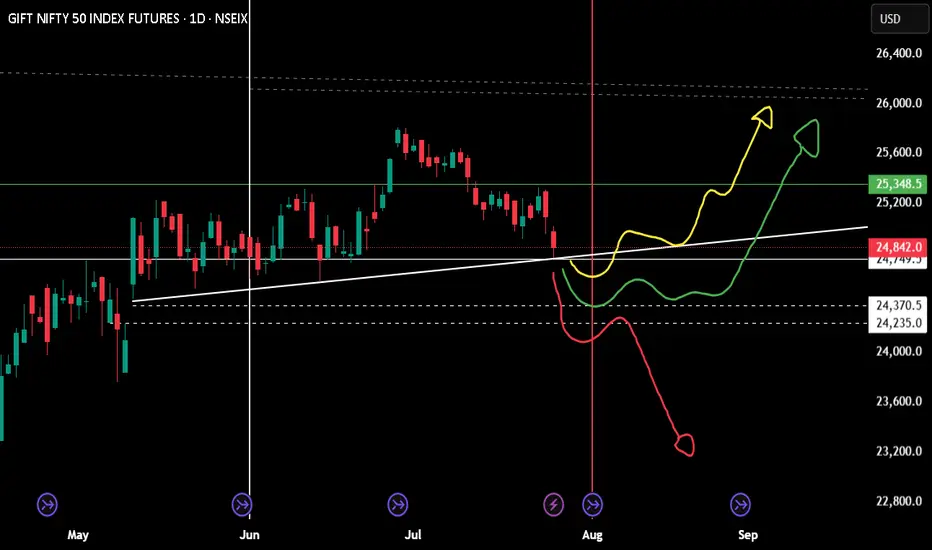
Monthly position for niftyExpecting a reversal, yes geo political and 1st August announcement will play a major role.
just wait for one day candle closing on your area.
If you wish to be on buying side (buy nifty future) a positive candle on top of the trend line.
Selling future for the month is only wise if 24k is crossed. Technically a bounce is expected and hopefully a green candle for August month.
$FARTCOIN/USDT – 4H(Not Financial Advice)
🔍 Key Technical Insights:
BOS (Break of Structure)
A clear BOS is marked near the 1.46 level, confirming a bearish market structure.
Price broke below the higher low, suggesting lower highs and lower lows in progress.
Supply Zone (Entry Region)
1.5189 – 1.5729 USDT is the defined supply zone where price is expected to react.
Current price is below this zone, indicating potential pullback entry for shorts.
Entry Strategy
Ideal short entry is upon rejection within supply, targeting previous demand zones.
Entry would be around 1.56 – 1.57 (red box top), stop just above 1.5729.
Targets
TP Zone (Demand): 1.3151
Mid-level TP: 1.4616 (prior support turned resistance)
Full TP: At the lower purple box between 1.21 – 1.31
Risk-to-Reward (RRR):
Visually, the trade setup shows an RRR > 2:1, making it favorable if rejection occurs.
🔧 Confluence & Bias
✅ BOS confirms trend shift
✅ Price rejected from premium zone
✅ Bearish candles confirming weakness
❌ No bullish market structure yet
❗ Watch for fakeouts in thin liquidity weekend

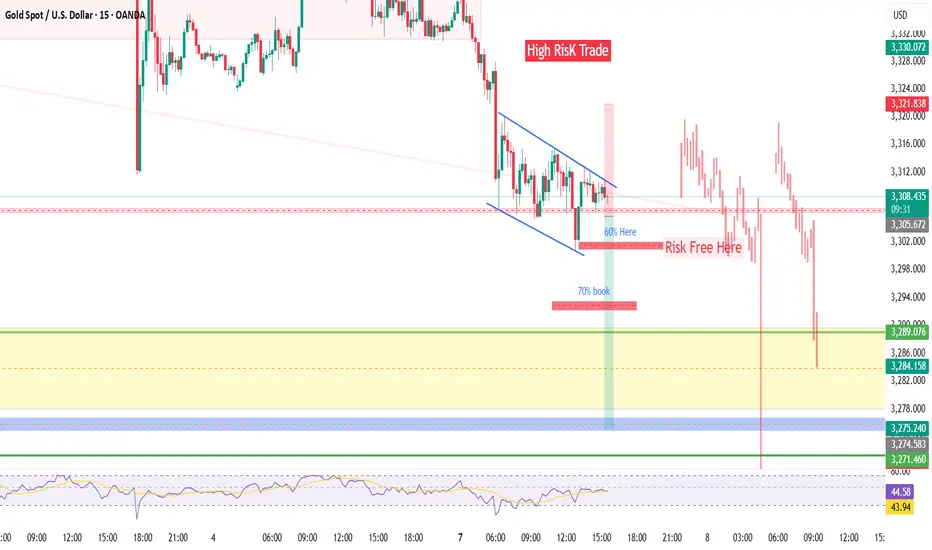
XAUUSDHigh Reisk Trade Short Planned
SL
TP
EP
Risk managment defined (risk free trade means move SL To ENtry)
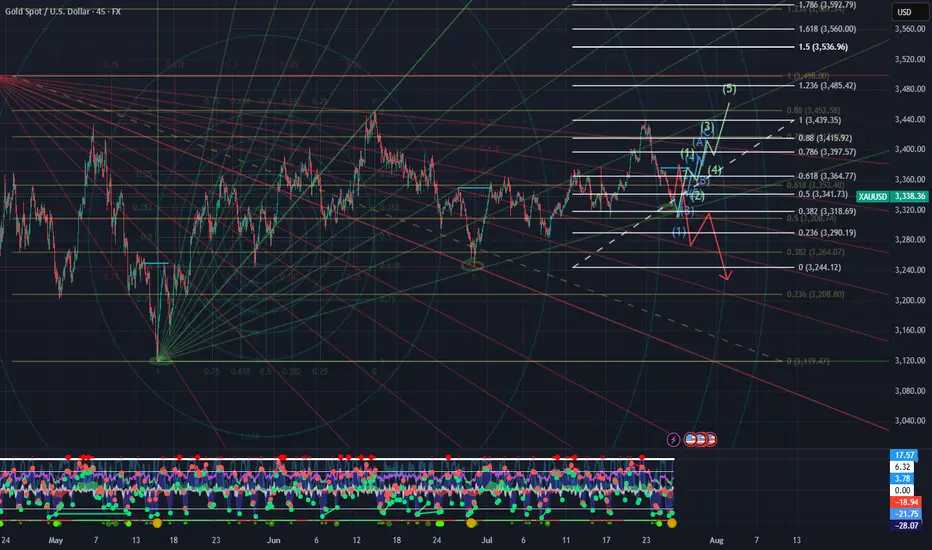
Bullish case forming but is it sustainableFollowing the Vumanchu Cipher B Divergence at the bottom of my chart: every golden dot has been followed by a pump to where the last drop happened. From there on we saw a drop to form a lower low and work our way through to the previous top.
This could likely be the move that brings us to that famous 3 400 level a lot of have been wanting to at least close to continue towards a downward trend and for bulls to form a stronger support around 3 333- 3 310.
The fan fib resistance 0 towards the bearish case has been put on the 2nd lower high on that 45 minutes timeframe to create a middle balance for shorter term analysis/scalping. Same thing for the fan fib showing rebound levels for the bulls has been targeted at the 2nd high of the same time frame.
The elliot waves showed on the chart are for potential price action speculations plays only please take it with a grain of salt. You may grab the chart and delete those if you wish.
I personally will be scaling my way in for a long position and will be expecting a drop from 3 385 ish and will be waiting for PA to re-analyze my bias.
Best of luck to all
USOIL: Next Move Is Up! Long!
My dear friends,
Today we will analyse USOIL together☺️
The market is at an inflection zone and price has now reached an area around 65.029 where previous reversals or breakouts have occurred.And a price reaction that we are seeing on multiple timeframes here could signal the next move up so we can enter on confirmation, and target the next key level of 65.579.Stop-loss is recommended beyond the inflection zone.
❤️Sending you lots of Love and Hugs❤️

TOTAL 2 # 002 ( GOOD for Altcoins )Hello dear traders .
Good days .
First of all thanks for your comment and support.
----------------------------------------------------------------------
Total 2 is growing in rising wedge .
With refer to the last Daily Bullish Gann Square ( Blue Square) and Bearish Gann Square and with considering bitcoin dominance which start its correction, expected to ALTCOIN season started and it can rise up to 8-9 T dollars which is looks good opportunity for investment together great benefits within a year .
Safe trades and good luck
NG1!: Target Is Up! Long!
My dear friends,
Today we will analyse NG1! together☺️
The price is near a wide key level
and the pair is approaching a significant decision level of 3.087 Therefore, a strong bullish reaction here could determine the next move up.We will watch for a confirmation candle, and then target the next key level of 3.107.Recommend Stop-loss is beyond the current level.
❤️Sending you lots of Love and Hugs❤️

NI225: Move Down Expected! Short!
My dear friends,
Today we will analyse NI225 together☺️
The recent price action suggests a shift in mid-term momentum. A break below the current local range around 41,456.23 will confirm the new direction downwards with the target being the next key level of 40,954.70 and a reconvened placement of a stop-loss beyond the range.
❤️Sending you lots of Love and Hugs❤️

BTCUSDT #056 ( Is it clear Road map ? )Hello dear traders.
Good days . First of all thanks for your comment and support.
-----------------------------------------------------------------------------------------------
On long term Gann Square, BTCUSDT stuck below 0.382 Gann Box price level.
With refer to all Daily bullish Gann Square ( Blue Square) of bitcoin, it is expected to fill up at least 0.75 Daily Gann Square up to 97 percent which will be 135-150 k for this bullish cycle .
Safe trades and good luck.

#TRU/USDT Low Risk vs High Rewards#TRU
The price is moving within a descending channel on the 1-hour frame and is expected to break and continue upward.
We have a trend to stabilize above the 100 moving average once again.
We have a downtrend on the RSI indicator that supports the upward break.
We have a support area at the lower limit of the channel at 0.0285, acting as strong support from which the price can rebound.
We have a major support area in green that pushed the price upward at 0.0280.
Entry price: 0.0300
First target: 0.0314
Second target: 0.0328
Third target: 0.0350
To manage risk, don't forget stop loss and capital management.
When you reach the first target, save some profits and then change the stop order to an entry order.
For inquiries, please comment.
Thank you.

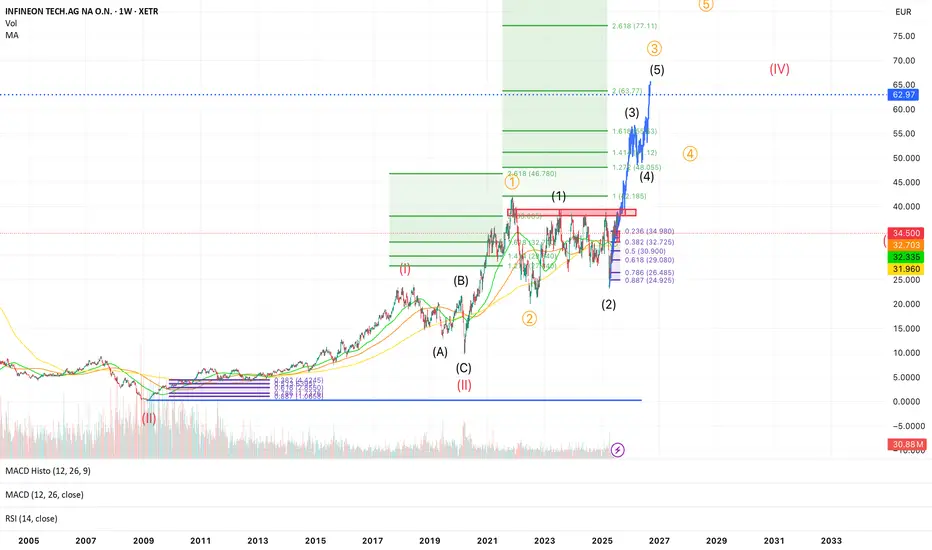
Infineon wave 3 to 62€ Gann-Methode🧠 Infineon (IFX.DE) - Massive Wave 3 in Progress 🚀 | Long-Term Elliott Wave Setup
Ticker: XETR:IFX
Exchange: XETRA 🇩🇪
Chart: Weekly (W1)
Technical Framework: Elliott Wave + Fibonacci + MA + RSI + MACD
🧩 Context:
Infineon has completed a massive corrective wave II (labelled in red) and is now in the early stages of a multi-year impulsive wave III. The price recently rejected at the 0.236 retracement (~35€) and is currently back-testing key moving averages. This zone could represent a wave (2) low of the internal (1)-(2)-(3)-(4)-(5) structure of orange wave ③.
🔎 Structure Breakdown:
✅ Wave (II) (in red) ended as a WXY-Flat-Correction, possibly in 2020
✅ Wave 1 and 2 of wave (III) are complete
✅ Current projection: we are in blue wave (3) of orange wave ③
📈 Fibonacci extensions suggest:
1.618x of wave (1) = ~53.83 €
2.0x = ~63.77 €
2.618x = ~77.11 € – ultimate long-term target for wave ③
🟦 Major resistance: 35–36 €, now acting as support
🟢 Key Moving Averages:
MA (32.7), MA (32.3), MA (31.96) are clustered — strong support zone
📊 Indicators:
MACD: Turning bullish, histogram just crossed above 0
RSI: Neutral (51), still lots of upside potential
Volume: Recent spike suggests accumulation during pullback
🔔 Key Levels:
Level Description
32.7 € Strong support (Fib 0.382 + MA)
39 € Fib 0.5 retracement
46.78 € 2.618x extension of orange wave ①
53.83 € Target: 1.618x of current wave (1)
63.77 € Major resistance / Wave (3) top?
77.11 € 2.618x extension of wave ③
🧠 Thesis:
If the recent low was wave (2), Infineon could be entering a parabolic wave (3) move with +50–100% upside potential over the next 12–18 months. The setup is supported by Elliott Wave structure, MA support, and volume confirmation.
⚠️ Risks:
Breakdown below ~30 € (0.5 Fib) would challenge this count
Macro events (e.g., chip cycle, geopolitics) may affect the timing
✅ Strategy:
I’m watching for confirmation of the local low around 32 €, and then adding during retracements. Targets are scaled into at 46 €, 54 €, and 63 €. Final wave (5) of ③ may push up to 77 €.
Tron Sets Nasdaq Debut After SRM Merger as TRX Overtakes ADATron Inc., the company behind the Tron blockchain and its native TRX token, is preparing for a landmark public listing on the Nasdaq, following its surprise merger with decentralized finance protocol Serum (SRM). The announcement sent shockwaves through the market, immediately catapulting TRX ahead of ADA to become the ninth-largest cryptocurrency by market capitalization.
The newly combined entity, operating under the name Tron Integrated Technologies, has filed its Form S-1 with the SEC, and aims to go public in Q4 2025—marking one of the first blockchain-native firms to emerge from a DeFi merger and enter public markets.
A Strategic DeFi Alliance
The deal with Serum is not just symbolic. It gives Tron deep liquidity infrastructure and decentralized exchange capabilities via Serum’s smart order routing and Solana-based engine. While the Solana connection raised eyebrows, Tron confirmed that a multi-chain expansion plan is in motion, with bridges being built across Ethereum, Solana, and BNB Chain.
“The merger with SRM accelerates our roadmap by three years,” said Tron CEO Marcus Lee. “This IPO isn’t just about capital—it's about positioning TRX as the digital fuel of a multi-chain financial internet.”
TRX Surges Amid Strategic Narrative
Following the merger news, TRX surged 22% over a five-day period, pushing its market cap to over $15.6 billion, surpassing Cardano (ADA) for the first time in over 18 months. Trading volume on centralized and decentralized exchanges spiked by over 60%, fueled by both retail speculation and whale accumulation.
According to data from Glassnode, over 84% of TRX supply is now held in long-term wallets, indicating a strong conviction among holders that the Nasdaq debut could further institutionalize the token.
Regulatory Spotlight and Market Implications
Tron’s Nasdaq listing is likely to put the project under closer regulatory scrutiny, especially given its ties to Asia-based user flows and complex tokenomics. However, sources within the SEC noted that the hybrid model—combining open-source protocol governance with a publicly traded corporate entity—could set a new precedent.
“This may be the template for the next generation of compliant crypto firms,” said Leah Thomason, regulatory analyst at Beacon Partners. “It’s essentially DeFi meets Wall Street.”
Conclusion
With the Nasdaq listing on the horizon, an ecosystem-level merger with SRM, and a strategic push toward interoperability, Tron is rewriting the playbook for token-backed companies. TRX’s leap into the top 10 is more than just a chart movement—it signals that capital markets may finally be ready for integrated blockchain operators.
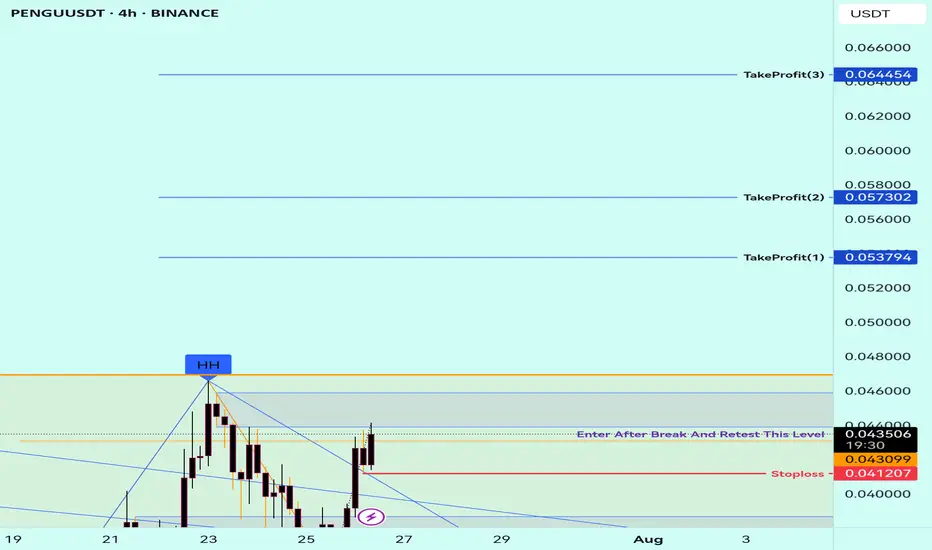
Buy Trade Strategy for PENGU: Betting on Meme Power and CommunitDescription:
This trading idea highlights PENGU, an emerging meme-based cryptocurrency that has gained popularity through its strong community support and viral potential. Inspired by internet culture, PENGU represents more than just humor — it taps into the growing trend of community-driven tokens that generate momentum through engagement, social media buzz, and grassroots marketing. With a limited supply and increasing visibility across platforms, PENGU positions itself within a niche market where speculation, culture, and community collide.
While meme coins like PENGU can offer explosive short-term potential, they also carry high levels of risk due to their dependence on community sentiment and lack of traditional utility or fundamentals. Market dynamics can shift rapidly, and what gains popularity quickly may also fade just as fast. Therefore, any investment in PENGU should be approached with caution.
Disclaimer:
This trading idea is for educational purposes only and does not constitute financial advice. Investing in cryptocurrencies, especially meme tokens like PENGU, involves significant risk, including the potential loss of all invested capital. Always conduct thorough research, understand the speculative nature of such assets, and consult a financial advisor before making any trading decisions. Past performance is not indicative of future results.
Weekly Range for nifty (applicable till the expiry)This are mathematical calculation not based on important level of fib or support level that are derived by most of the Technical trader.
just trade the level with few point stop loss. for grabbing greater points.
please do check out sensex where few greater points are explained.