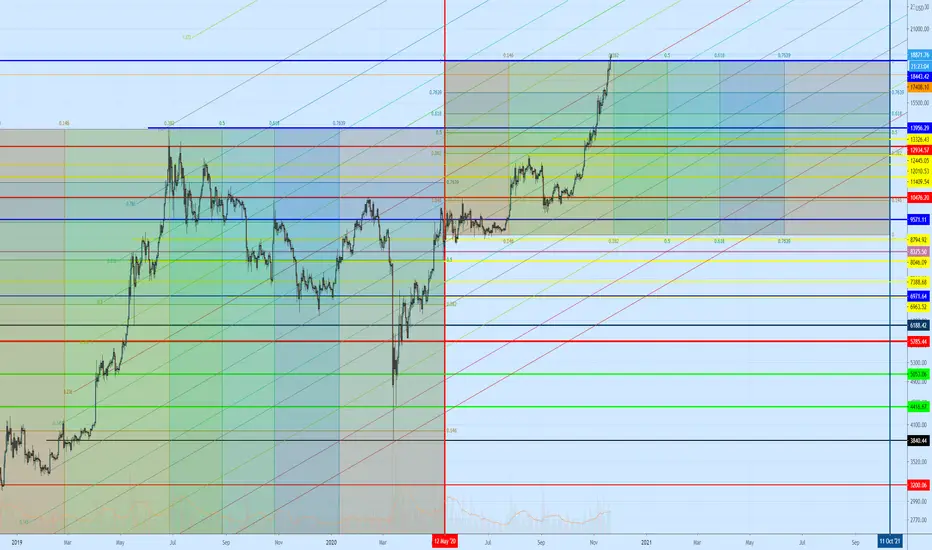
Black Friday is comingAccording this Gann box BITSTAMP:BTCUSD can be a little bit cheaper in a week...
Gann Box
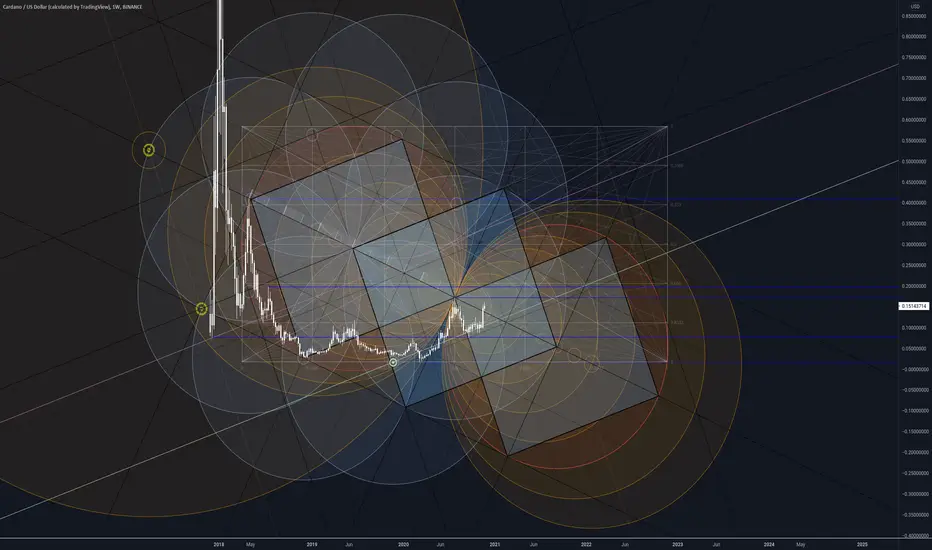
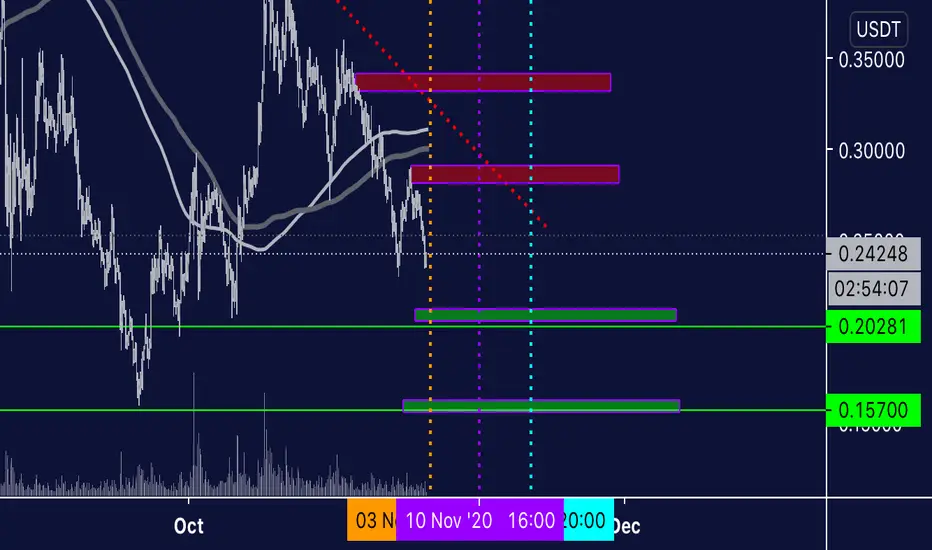
ADAUSD | Floral Plaid CardanoAdorn yourself in the newest fashion forward print this fall, Floral Plaid Cardano!
Not trading advice.
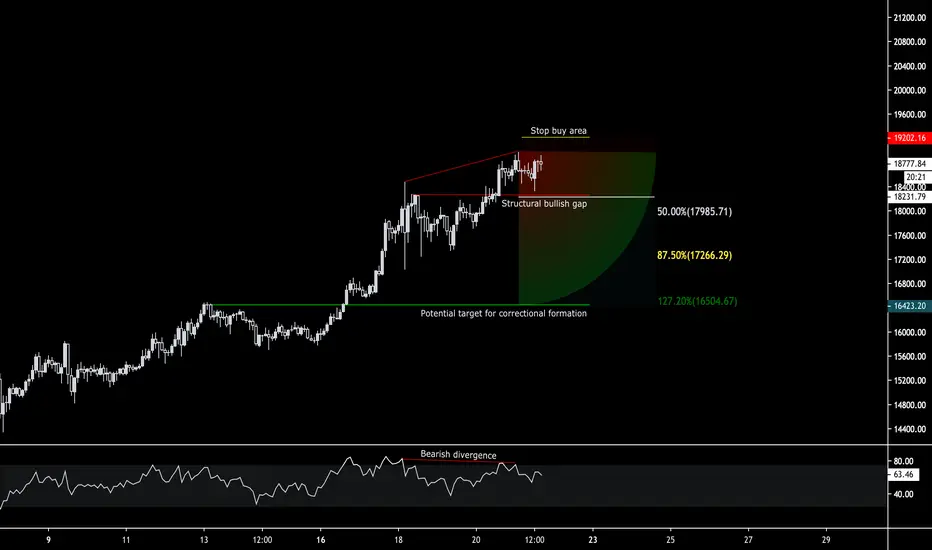
BTCUSD: A Potential FadeReasons to consider getting out of short risk exposure if the highlighted area fails:
Bearish Divergence
Break of Structural Gap
Overextended state
These reasons might trigger some traders to short or sell this pair; however, in terms of probability, the market still favours bullish bias, evidenced by the context to the left.
The break of the highlighted bullish structural gap area can serve as a warning for short risk exposure. If that happens and higher timeframes close below that area, that can be considered as a decent indication towards further downside for short risk exposure.
Constructive discussions are always welcome, just drop a line in the comments section.
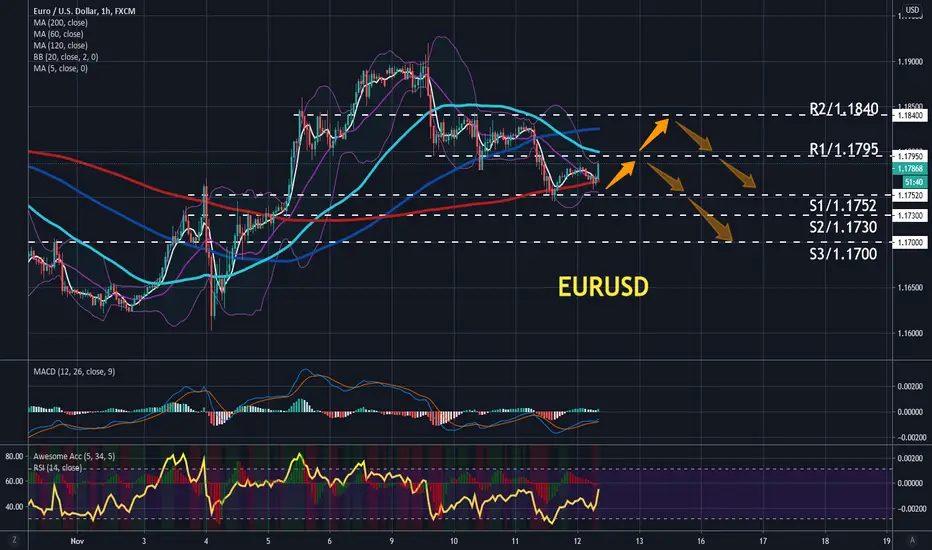
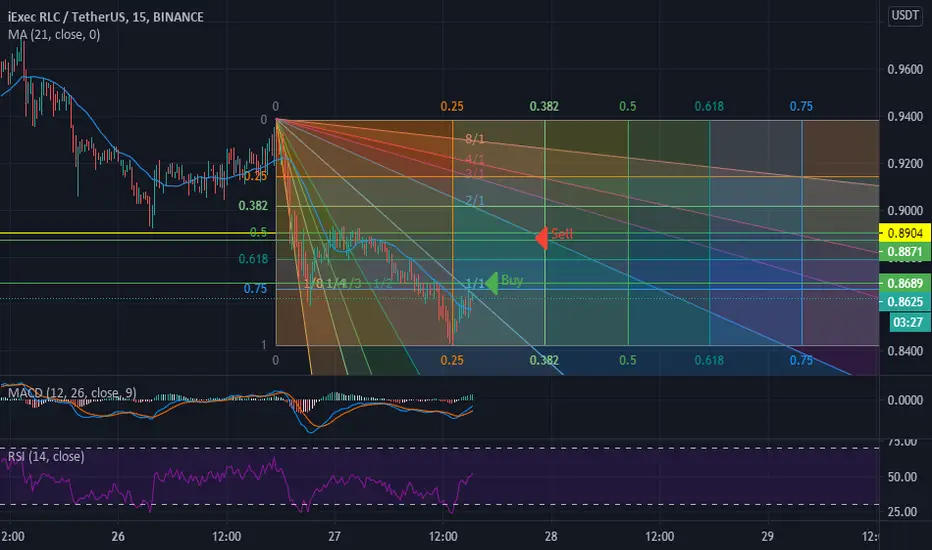
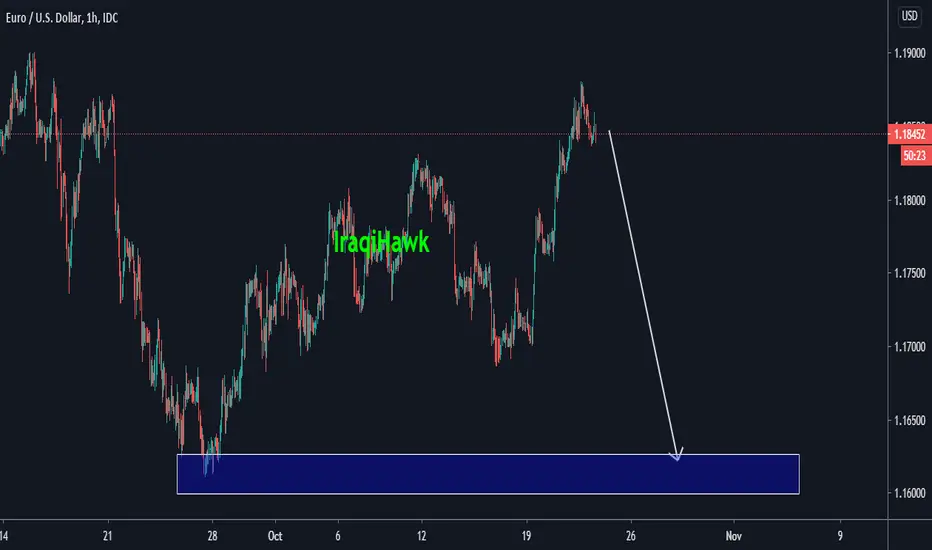
EURUSD H1 Real-time strategyThe U.S. Dollar Index bottomed above the integer 92, and there is a chance to oscillate higher, so the EURUSD fluctuated slowly down trend.
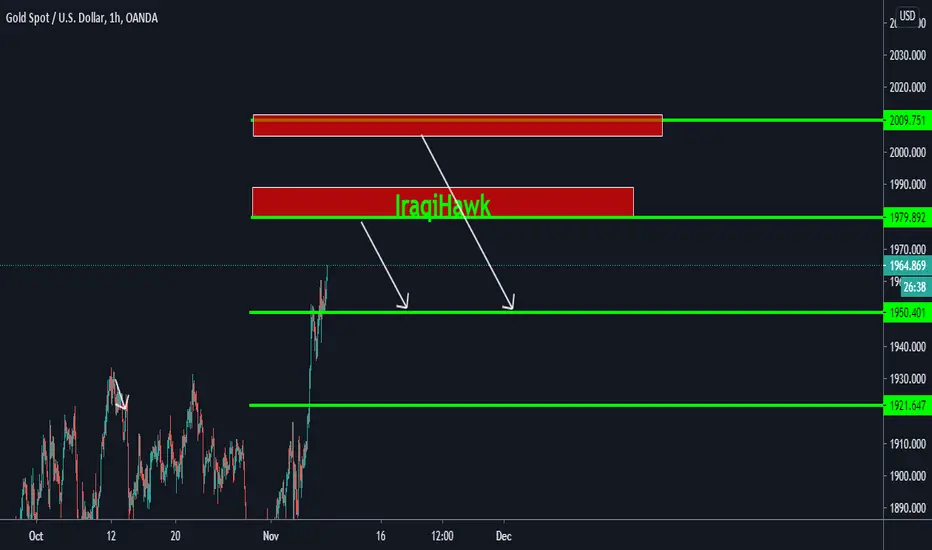
XAUUSDThe analysis according to the theory of William Delbert Gann
And also directional movement and price behavior
And also an astronomical analysis
Just the idea of the decision with your hand first and foremost
Accept respect and appreciation from me to you
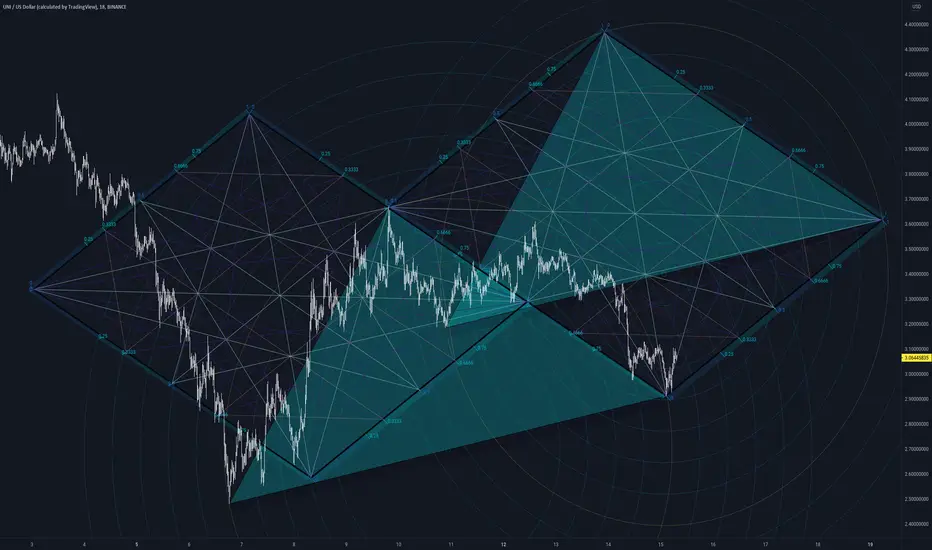
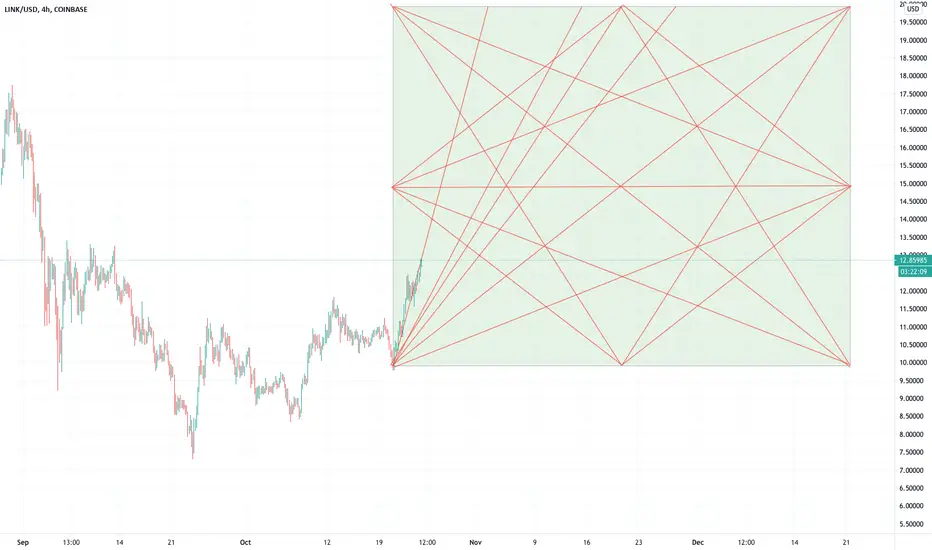
UNIUSD | PerspectivesChart squared via Thales to last major LHL swing (left most teal triangle). Right triangle was then replicated and placed at first major dip after the local high, which highlighted the angular trend through October 14. Using Fib Channels you can construct a perspective Gannbox (right most grid formation). Backtested idea by then duplicating and offsetting a second Gannbox (left). Watching how price action reacts to this geometry. Not Trading Advice.

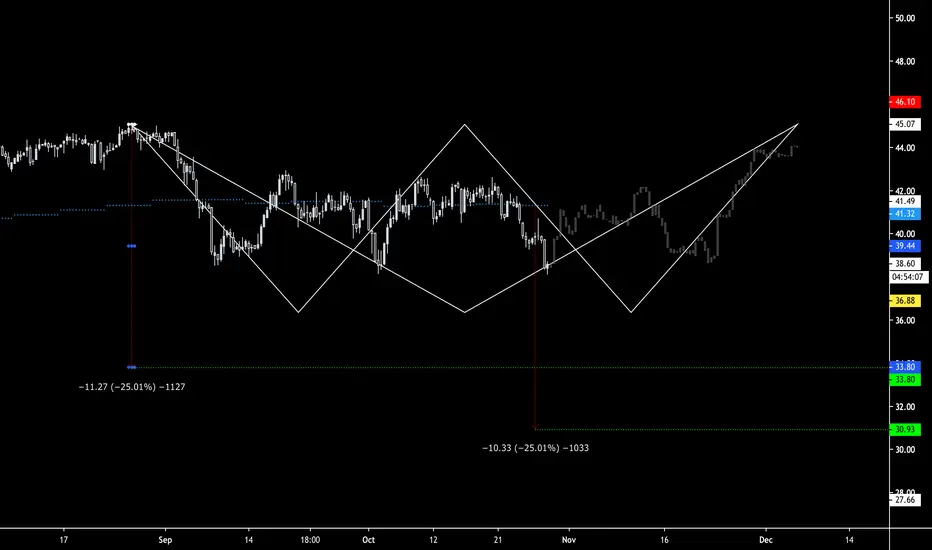
CLH2021: A Potential Swing Higher This analysis makes use of the Gann Box tool; however, only certain lines are highlighted. The bars pattern is mirrored to show the potential for symmetry here; a beautiful tendency of markets and nature in general. Looking for higher targets from here.


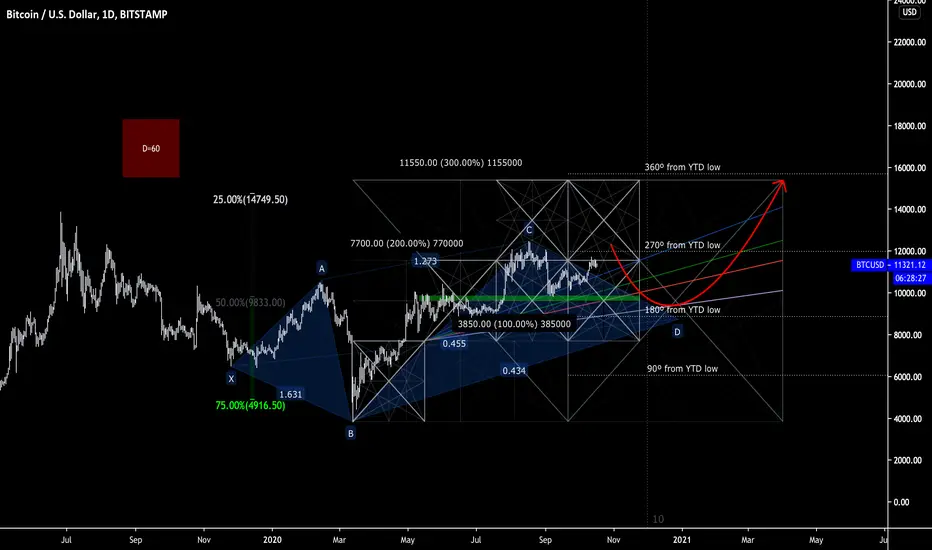
BTCUSD: Daily Chart BreakdownI am getting a feeling that there could be a 5-0 correctional harmonic formation in its maturity phase, currently. It can also be viewed as an inverse head and shoulders pattern. The highlighted harmonic pattern is the 5-0 pattern with the X being the 1. TV doesn't have a tool for 5-0 patterns, so the Cypher tool is used which lacks one leg. The highlighted projection of price is regarded as a rough estimation of this pattern's completion. The pattern is usually seen during a post correctional phase, where there was a rather hard sell-off (a strong upthrust in a bearish version), which was followed by a V type recovery. When this V type recovery is being corrected as much as 38.20%-50.00%, that's where you anticipate entering into short risk exposure.
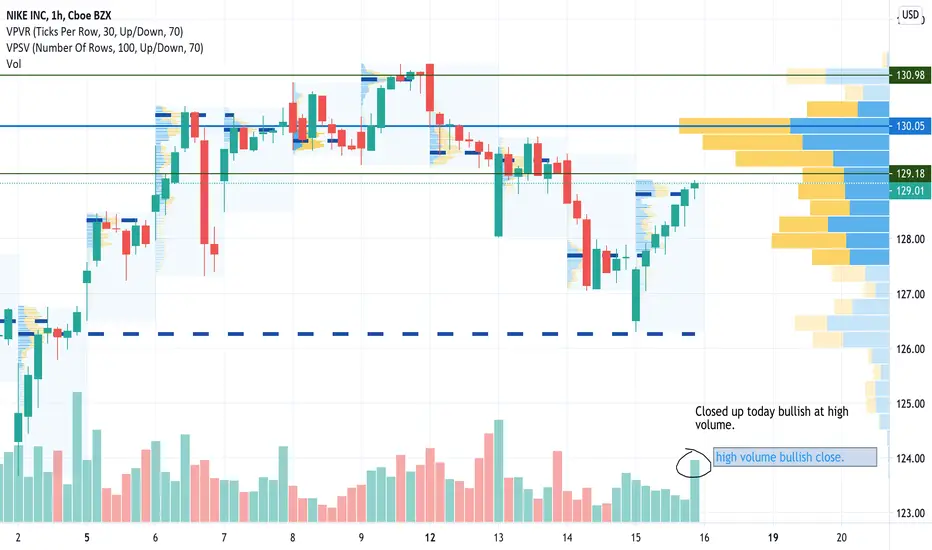
Nike Long to 130.90 if breaches 129.18If you look at the volume profile the POC ended at the days high with the high volume bar right at the end of the day. There is resistance at 129.18 , next stop at 130.90

XAUUSDThe analysis according to the theory of William gann
And also directional movement and price behavior
Just the idea of the decision with your hand first and foremost
Accept respect and appreciation from me to you

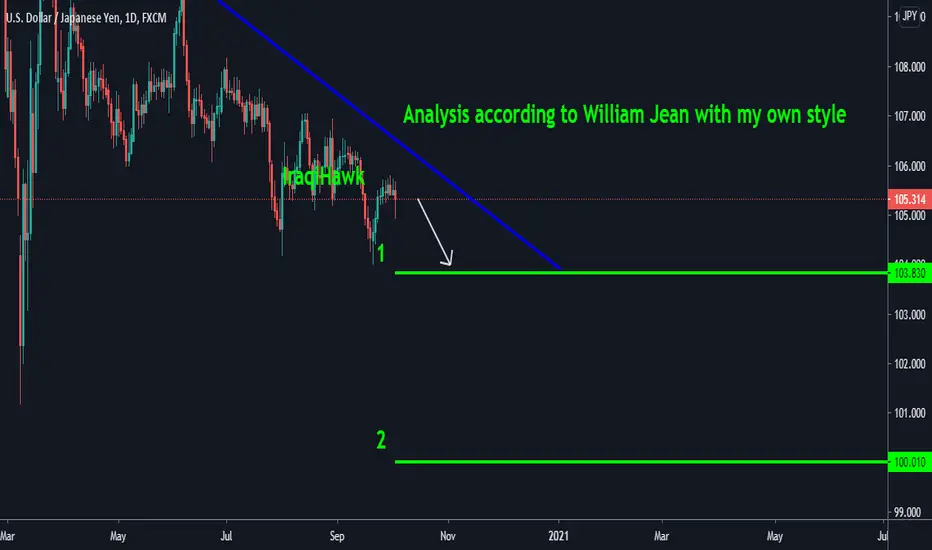
USDJPYThe analysis according to the theory of William Jean
And also directional movement and price behavior
Just the idea of the decision with your hand first and foremost
Accept respect and appreciation from me to you
USDCHFThe analysis according to the theory of William Jean
And also directional movement and price behavior
Just the idea of the decision with your hand first and foremost
Accept respect and appreciation from me to you