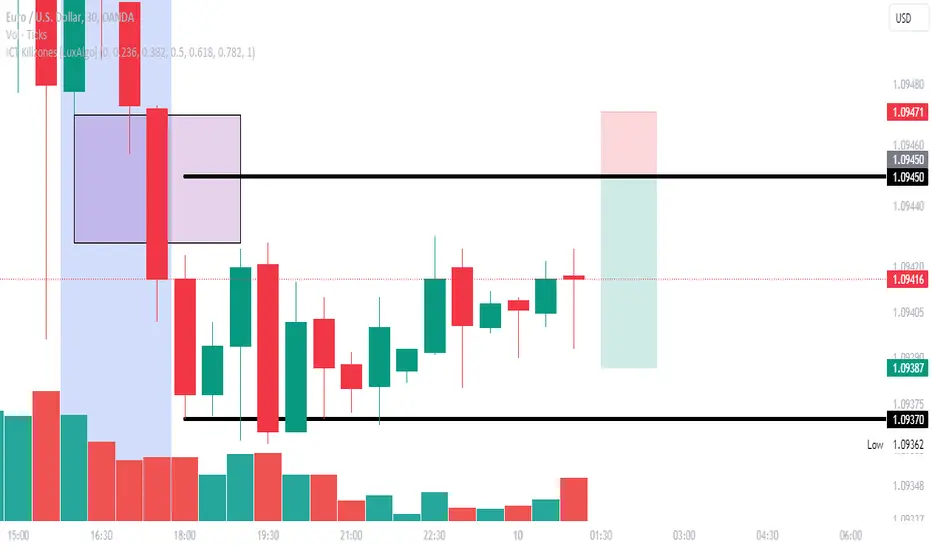
EURUSD SHORT ENTRYHello All
This is an short entry for scalping trader
entry sell 1.0945
stope lose 1.0971
good luck
Gann Box
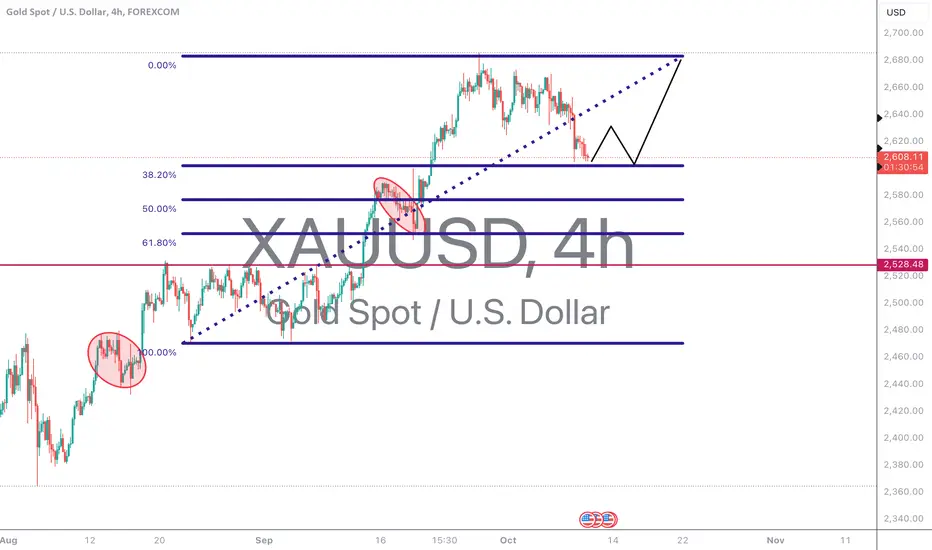
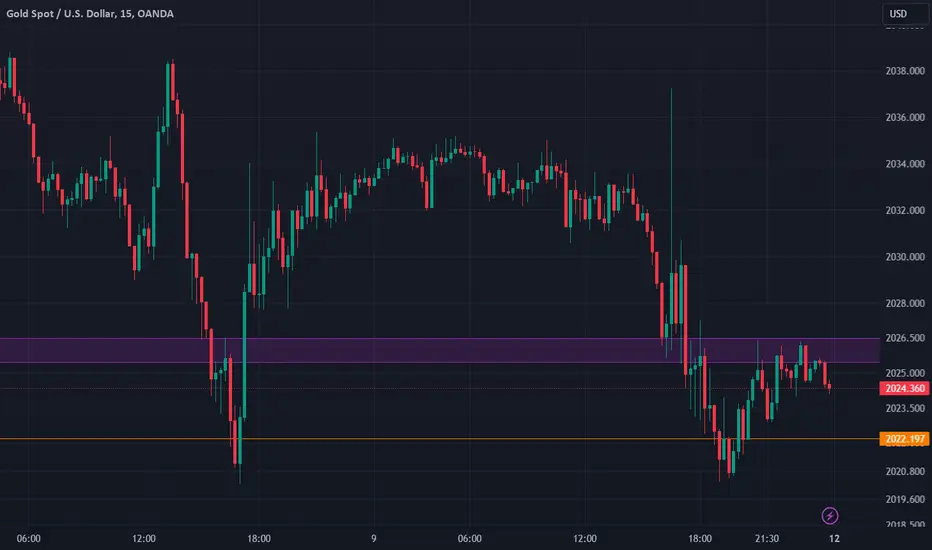
GoldThis. Refers seems you’re referring to the Fibonacci retracement tool, which is often used by traders to identify potential levels of support or resistance in the market.

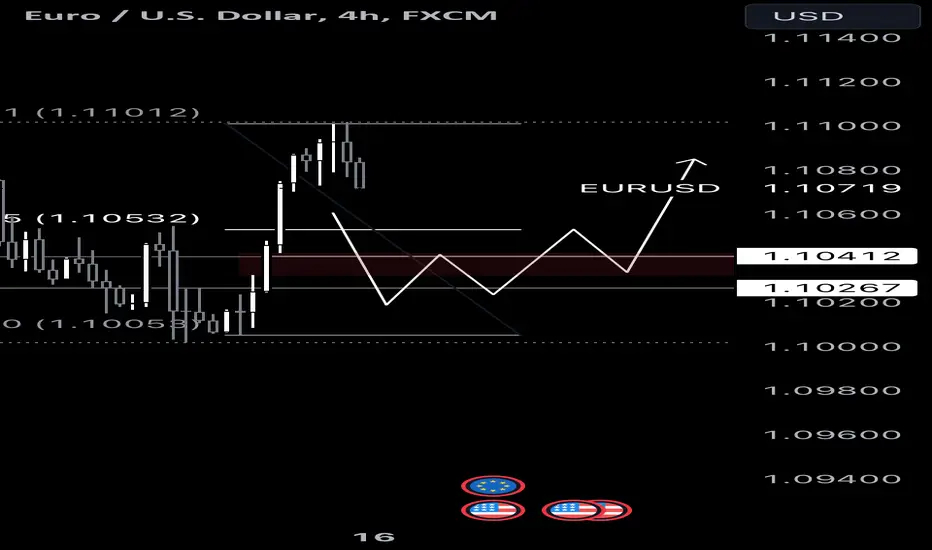
Eur/usd high probability buying zoneIf we see a retrace into the discounted fib range as well as rejection of the FVG, we can expect potential buys.
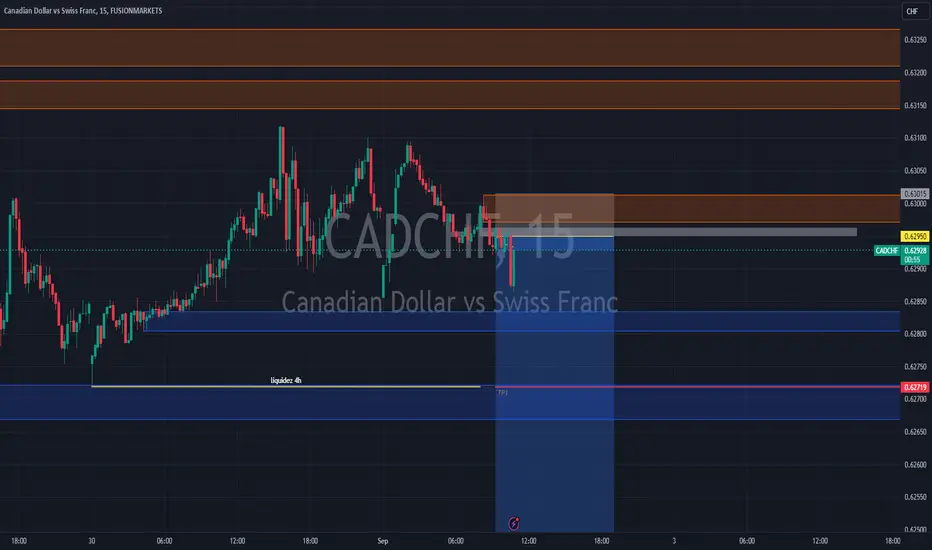
Trade of the day..... Let´s seeI´m short in cadchf. I´m not a scalper or intrday trader. My trade are based on weekly tf, first trading with trend. So i love swing trade style.
Monthly 10K blocksTop-down ICT analysis - Obvious targets if we move lower are the Yearly FVG to come back into play and eventually held as an iFVG driving us lower.
Monthly $10,000 Gann Box's - As always with the Gann box and its angles you want to find the best X and Y points, with the right ratios and you anticipate price to be within "equilibrium" as it follows the major angles in the geometry of the Gann box. For this idea I'm using halves (0, 0.5 and 1) with a $10,000 price axis and 1 calendar month for the time axis.

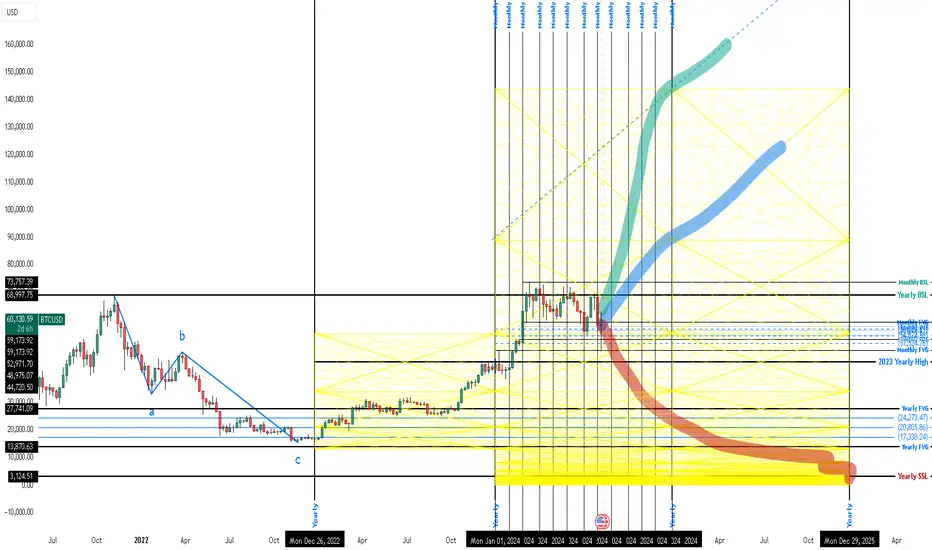
Yearly Fibonacci OverlayLaid on the Daily chart and plotting the calendar year within the Fibonacci ratios.
Also shown are some top-down ICT analysis of key levels.
I highlighted 3 of the most obvious paths i'd like the see here and personally speaking, i think the USD will flex on everything, crippling crypto and all other currencies over the next few years and thus we would see the red highlighted path unfold here. I also included a blue highlighter path where price should be most probable to continue on the path that its already on and with the green highlighter showing what a lot of strength would be.
HTF Fibonacci Plotting the Fibonacci sequence in multiple fractals (0-144), within the calendar year from the Monthly chart.
Also shown are Fibonacci Gann Box's for the year, plotted 0-144 of their respective Fibonacci sequence.

GMTUSDT Important Levels For Next Cycle - GridHello Dear Traders,
- Important Levels
On the Chart "Horizontal Lines" Based on Gann Square of 9
Works as Support/Resistance. Watch for Price action around those levels
- Jinny Gann Grid
- Vertical lines works as time lines. Expect Reversal around them.
For Today
Support : 0.1129
Resistance :0.172 then .206
Wish you Good Luck Trading.

Dip it n Rip itOne more chance to accumulate long positions before we blast off on NQ. I believe we are still in a large buy program. One last shift to end the year and into Q1 before we have a troubling 2024.

Bake Smart Money ConceptPossible 2000% gain with minimal risk, this crypto is highly volatile if you want this big move I highly suggest to do it in spot

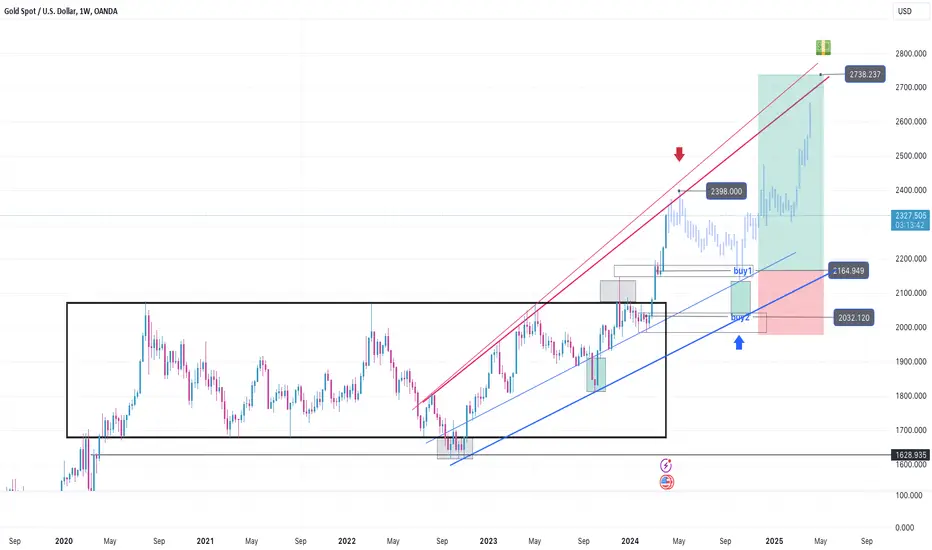
Plan to take profits and collect goods in 2024Plan to take profits and collect goods in 2024
In the previous scenario, we collected goods in a very beautiful demand area of 1985
We have achieved target 3 and have taken profit, our job is to wait for the market to collect goods at the end of the 3rd quarter in the buy1 area or in the 4th quarter in the buy2 area. And hold on to the final target 27xx-28xx
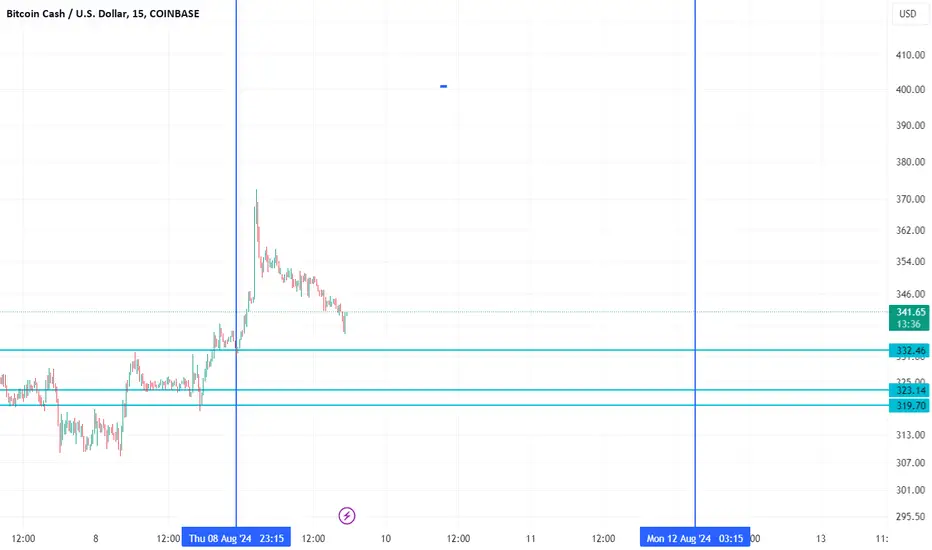
Bitcoin support and resistance rangeThe support and resistance range of Bitcoin is specified in the chart.

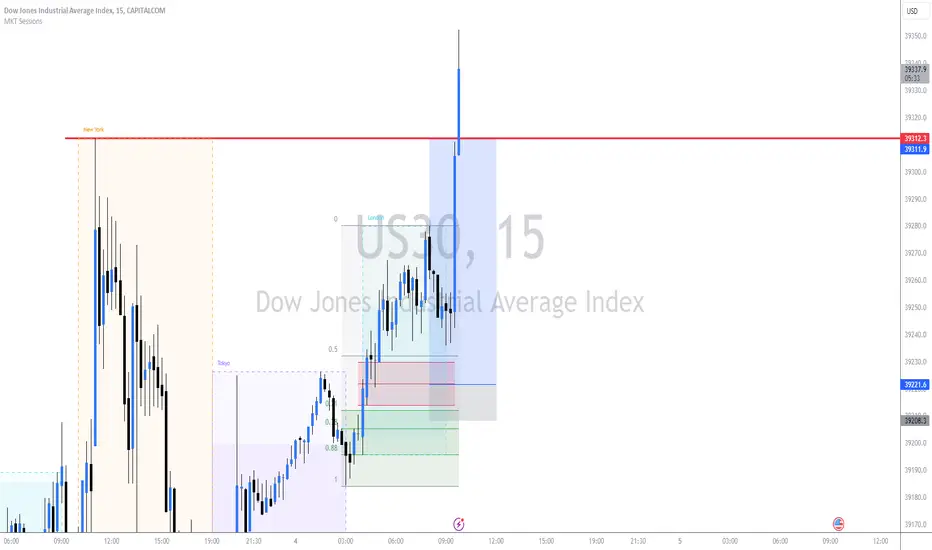
Navigating Market Waters: Embracing Flexibility on US30In trading, adaptability is key. Reflect on the journey navigating the volatile waves of US30. While some trades may slip away, embracing the fluidity of the market ensures resilience and growth. Let's explore the importance of flexibility and seizing opportunities amidst market turbulence.
Possible Macro - Short Trade in 4H.Check it, The Market is Downtrend for take Short Positions with Smart Money Concepts.

Support and resistance range For ETHUSDThe support and resistance range for ETHUSD is specified in the chart.

ASX200 - Breakout! Target 10800After the v-shaped recovery from the COVID-19 pandemic, we have seen a rally to the 7650 handle, where the market went sideways for the later 100-plus weeks. The accumulation stage is about to end as the 7650 resistance price was finally broken.
The RSI is above 4o and moving above 60, which indicates bull market conditions.
The composite index has shown a bullish divergence with price, also found in RSI.
The Gann time count of 144 weeks from the prior high, is almost complete and should align will the Gann boxes count of 1 complete Octave.
Furthermore, the 144-week bullish wedge formation forming in the chart.
A calculation of a possible target is 10,000 points, using Fibonacci extensions, but more likely 10800 using Gann box techniques.

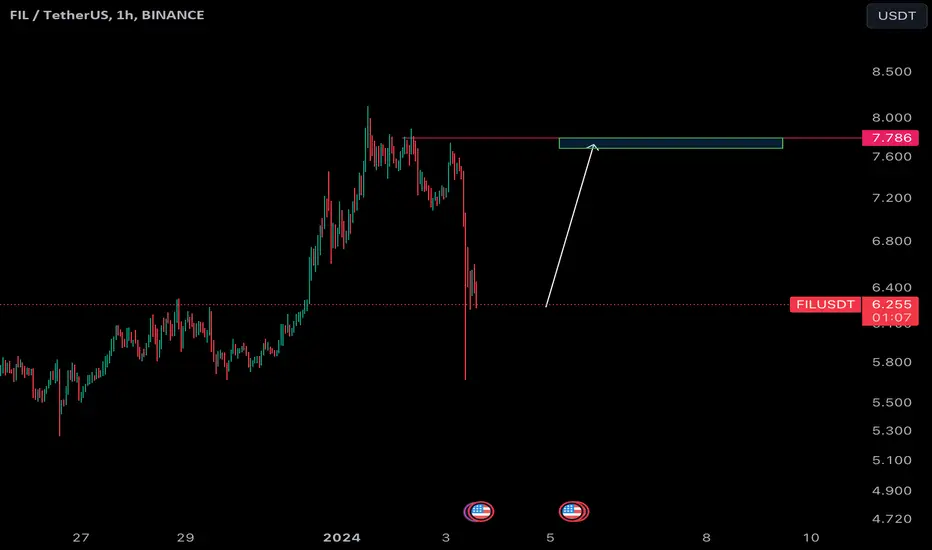
ScalpA great scalp position, given that we are in a strong uptrend and corrective wave analysis we can expect to return to the green zone.
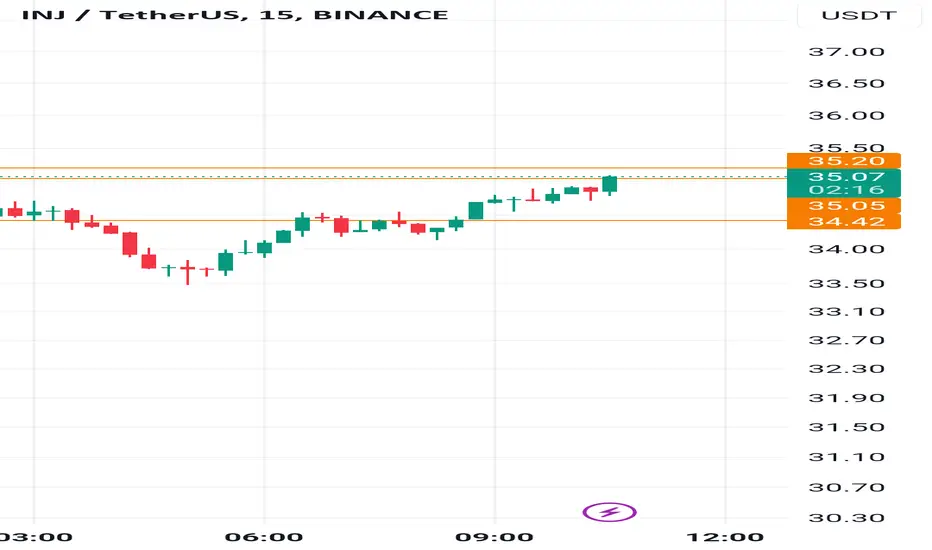
Resistance and support ranges for INJUSDTSupport and resistance ranges for INJUSDT are marked on the chart.
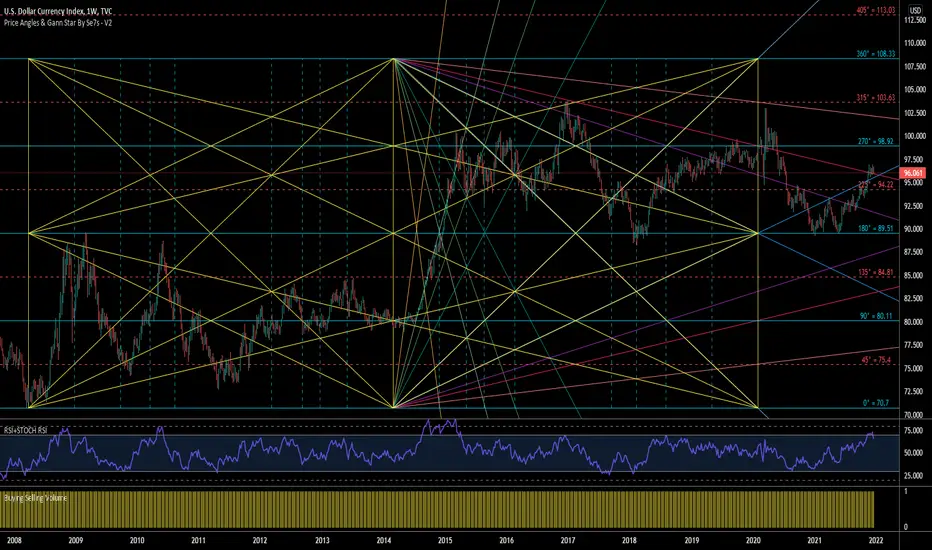
DXY LONG-TERM LEVELS + GANN FANSLONG TERM Important LEVELS.
+ GANN FANS
horizontal lines are Support/Resistance .
Vertical lines are time pivots .
Appreciate your Comments.
GL