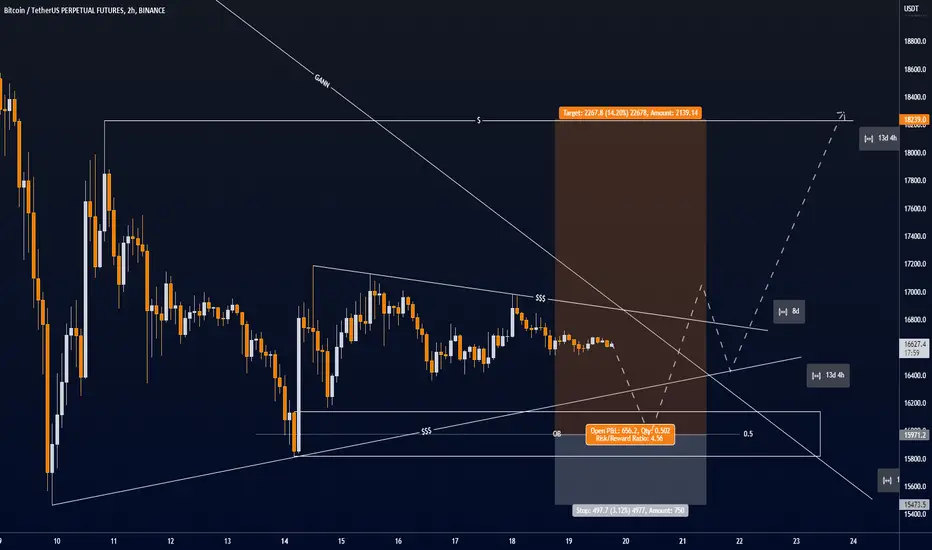
Gann Box

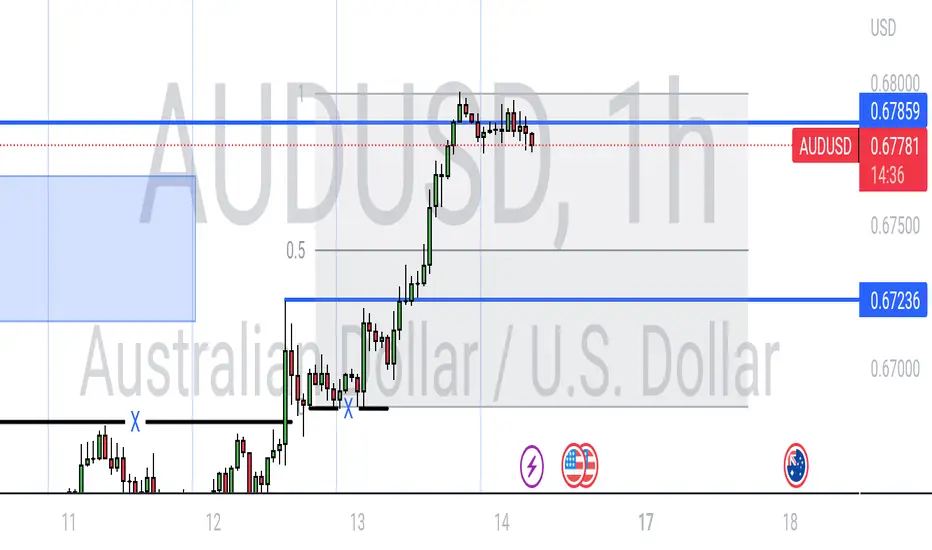
Would love to see the sell side liquidity taken out I would love to see the sell side liquidity taken out prior to the relatively equal lows where liquidity is resting below and it happens to be just below the discount zones... yesterday I and my community went long on GBPUSD/AUDUSD and eurusd ...if you have been following my shared ideas here I did say I would love to see the buyside liquidity on Gbpusd taken out ..well go look at your chart ..anyways stay safe guys ...
#Iamace #Acethetrader #AcetradeingAcademy
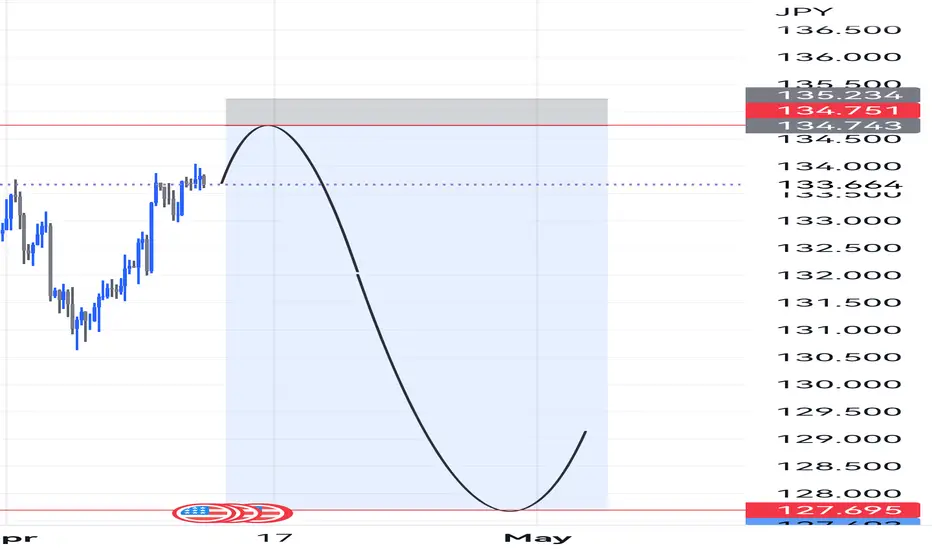
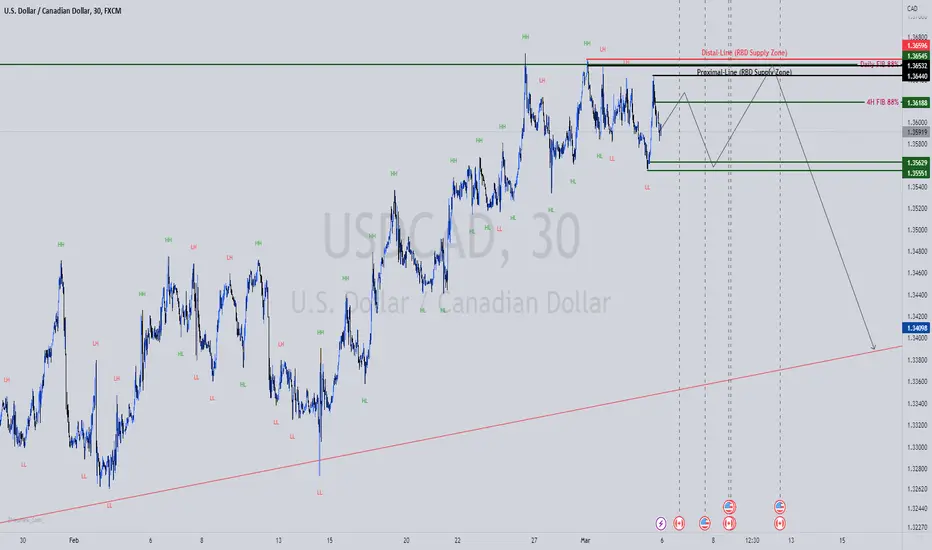
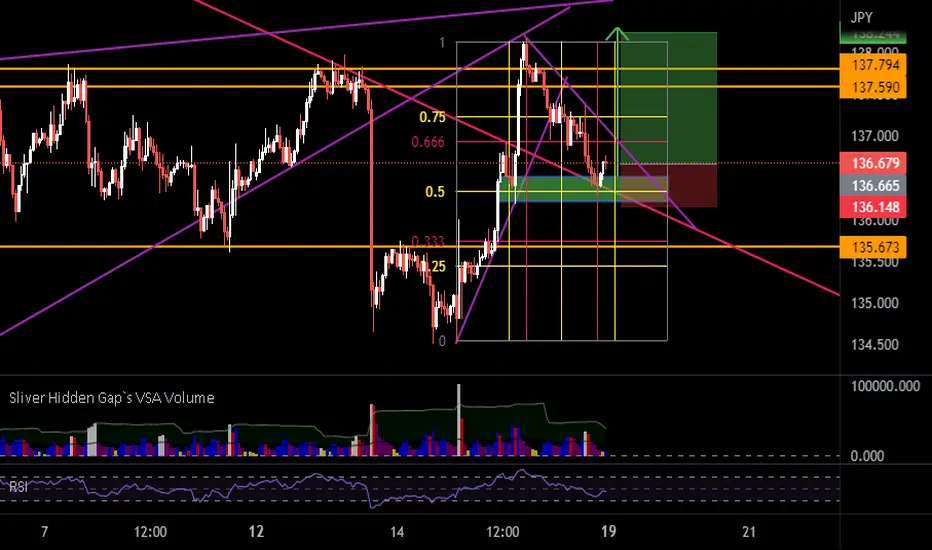
USDJPY IDEAUSDJPY is at 61.8 Fibonacci Retracement Level plus a bonus Supply Level, I'd like to see the drop with or with fundamentals assistance, Goodluck
Gann box workingGann box consist or few points that is 0-0.25-0.5-0.75-1 vertically as well horizontally
Gann BoxThe exact price and time levels can be set by users in accordance to their strategy. The Gann Box can be applied across various markets to forecast key price and time levels and can be used with or without angles.
predict Chart * SW Down for my Idea

BABA double bottom on 60 (long)My 1st try in Ideas.
China Zero-COVID + BABA double bottom on 60 and go up to 120 return to 90 and to 130 -> 160

RVNUSDT DUMP, may be the last dump before flyblue fork is describing the price movement precisley and the red fork is a bearish fork which breaking its hagoppian line shows a sgnifacnt possibility for upward movement. RVN may create a big profit in 2023 ! BINANCE:RVNUSDT

$OPUSDT pair, Waiting for break down, Shortwaiting for break down before taking a position, potential gain 10-15%, sell half on 10% gain, trend follow(20ma) for the remaining half.

gbp moving within Range Gbp stuck between Range. Where best is to sell on top and buy on Low. Big move will see after the breakout. Within a range move will break during The F.o.m.c
all the mentioned level is important so be careful on that.

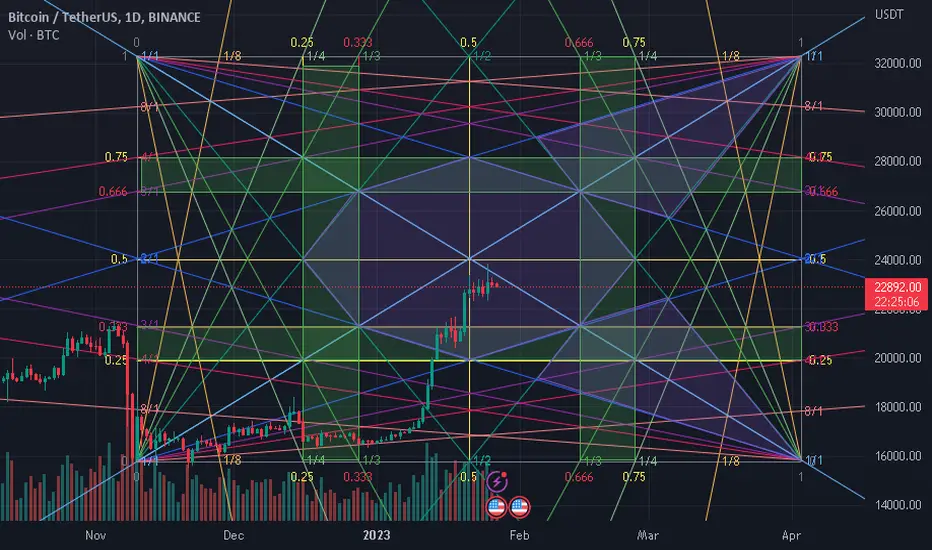
btc ideait's gann box of 144 i don't know if i do it right so i ask about what you think guys
btc to 32k or 15.7k about 3 apr
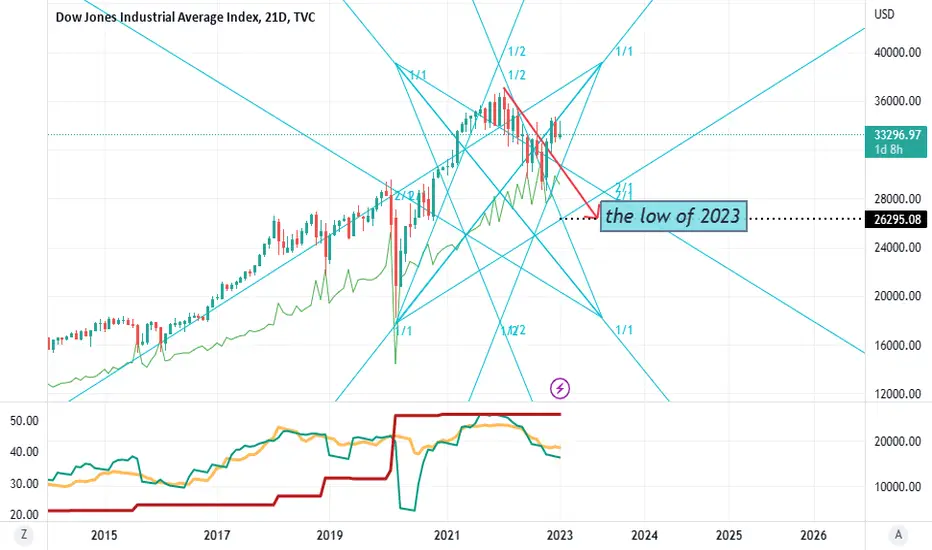
accordance to Gann strategy DJI still on UP trendDJI @ risk if the uptrend line broken and expected to have the indicated in the Chart before June,2023.
SELL SPYSPY is currently on a downtrend on the weekly chart and is near downtrend line liquidity. It's currently in a resistance area based on the 30 min chart. In addition it seems to be rejecting from the fib retracement level (red lines). Hence I think sells are possible this coming week.


Scalping on MATICUSDT MATIC is come to an 5min Orderblock and in my Strategy I think we can open an short.

INBX 1H TRADE IDEA got into the box after the false break out I see it will break make an attempt to exit the box balance area once more 2:1 trade idea

BTC/USD possible sellThere is liquidity to the upside which may be taken out before btc resumes its move to the downside
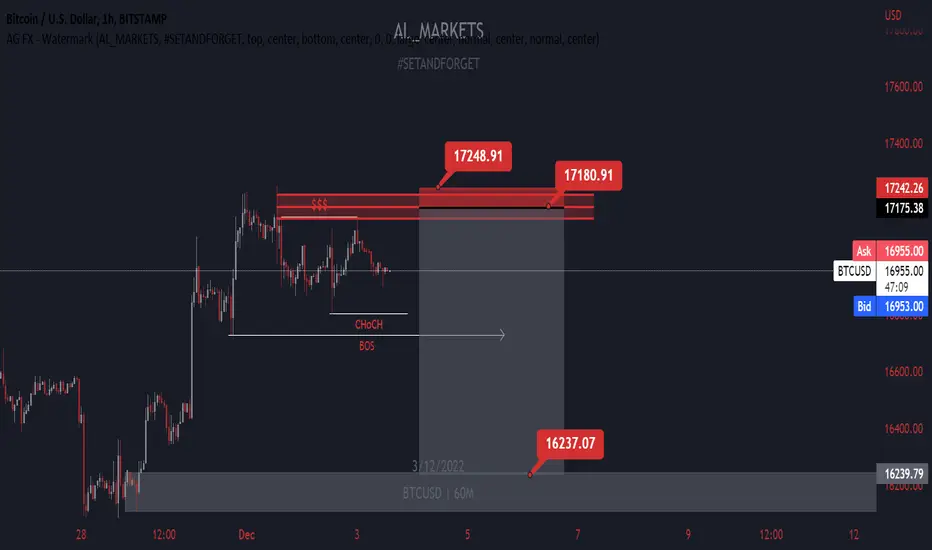
Going to form a Bearish Flat?
Just speculation.
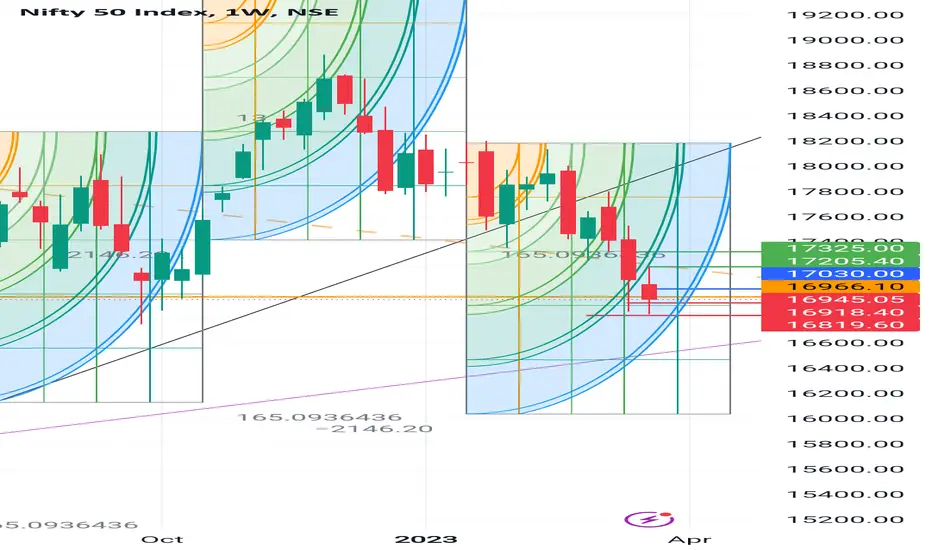
This chart seems to respect Gann Box, Gann Square, and Arcs as depicted.
If so, Gann 1 x 1 would exhibit a significant resistance at the 17400-17700 level.
If so, an Elliott wave theory's Bearish (expanded) flat could form.
Again, this is just speculation- for a more orthodox analysis, see my previous ideas linked below.
Hate comments won't be welcomed but will be immediately reported.

A chart to watch 👀A beautiful view of a pentagon, if you like Geometry you'd probably like this chart, if you like time, you'd probably like it more.
If you know about the Square of 9 Angles, you probably understand how beautiful this chart is.
Market is random and uncertain, but that randomness is well organized or that's what they say.
Just wanted to share this, for fun, let's just watch 👀👀.

POTENTIAL US30 SELLUS30 is approaching an area that has some imbalance (labelled IMB) as shown on the chart followed by an area left unmitigated which is the area of interest for a sell. That area more specifically is between 34825 - 35511. Another indicator that a trend reversal is approaching is the volume bar noticeably on a down trend on the daily chart. Hence, the reason I would suggest shorting that area.

BTCUSDT LONG Triangle pattern both side liq taken.
I believe we will visit higher liq levels afterwards.