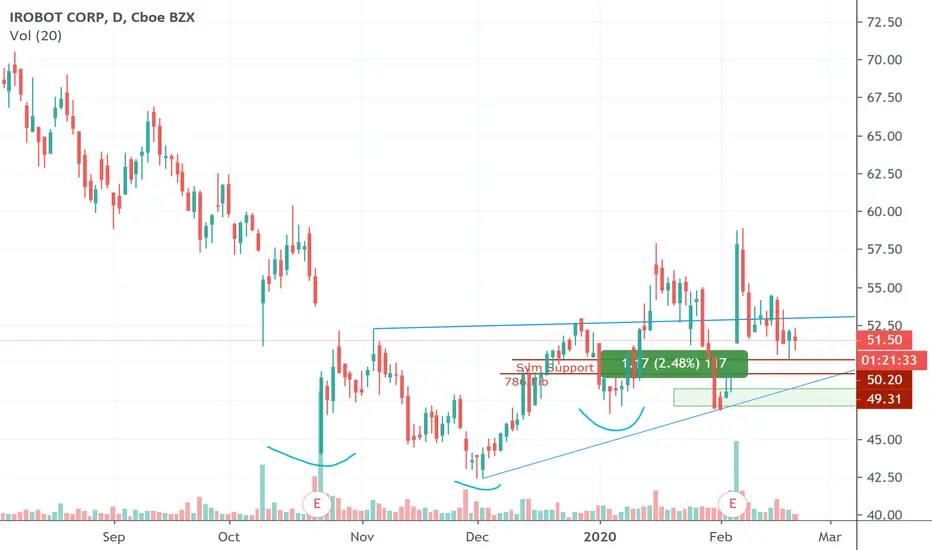
IRBT Shorts "Sweep" in the Cards?IRBT - I'm expecting a move up. What I like:
- Half-assed inverse head and shoulders on a daily
- Start of an uptrend (albeit disorganized and choppy)
- Relative strength with the indexes down over 1%
- Holding closest symmetry support at $50.20
- Cluster of symmetry support from $47-48.33 with the uptrend line
-786 fib retracement at $49.31
- Big ass gap above
Beyond the technicals, my intuitive/dowsing approach is hinting at a short squeeze and move higher; and with 50% of the shares shorted (as I understand it), that could be F-U-N!
Gaps
60 Min Channel bounced back in it down. Was on the phone earlier with a good friend while this 60 min first red candle down wicked into the gap and came down. I'm like Mark this is going down. 200 plus ticks later I was right...again! If you aren't using channels you are missing out on easy moves. Best part is the drawing tool is free on most platforms. You have to frame your trades before you add your indicators. We teach this in our live classes around the USA.

W5T Elliot Wave, BITS, Roller Coaster GAPS ES Live video of the ES/ S&P 500 wave 5start back up. Buyers kicking in this morning. Watch the power of these daily and weekly gaps as we touch them to the tick and pull back and then force through them. W5T Elliot Wave on a daily chart helps you see where we are and can possibly go.

ES1 W5T Elliot Wave, BITS, Roller Coaster Indicators working!Third update today - Look where we are right now? The exact to the tick weekly gap I said we would hit next. GAPS work people! Our Roller Coaster indicator picked up a nice 220 tick move on the @es_f today as well and our Elliot Wave indicators picked up a massive 5th wave move. What are you using to find moves like this??

ES1! - W5T Elliot Wave, BITS, Roller Coaster IndicatorFollow up from yesterdays @es_f Elliot Wave 4 pullback and completed 5th wave to the tick! Both BITS and Elliot Wave Indicators called this move today. 75-100 plus ticks. Roller Coaster likes to have a more stable environment and didn't have much on it today. Gaps play a MAJOR part in where the market goes guys and gals.

@ES_F Daily/Weekly Gap played very well! W5T Roller Coaster moveUPDATE from last nights post. Look how we blew through the weekly gap, a couple daily gaps, and bounced off the daily center channel line. If you read the Price Action Breakdown book by Laurentiu Damir we wicked just below the daily center channel, filled a daily gap, and rocketed back up 80 plus ticks. The W5T Roller Coaster indicator called this move days ago and only went a few ticks negative one day. The rest was down hill short big time!

W5T Elliot Wave, BITS, Roller Coaster Indicators ES1!Nice gap down on the Sunday open creating a deeper W5T Elliot wave 4 pullback on a daily chart. Almost a wave 5 down on a 5 minute chart. A lot of people don't realize you can have multiple wave patterns going opposite directions at the same time. With the right charting and wave count isolated you can see them in action. The wave 5 down on the 5 minute is actually a wave 4 pullback on a daily chart. Stay tuned for updates tomorrow on this.

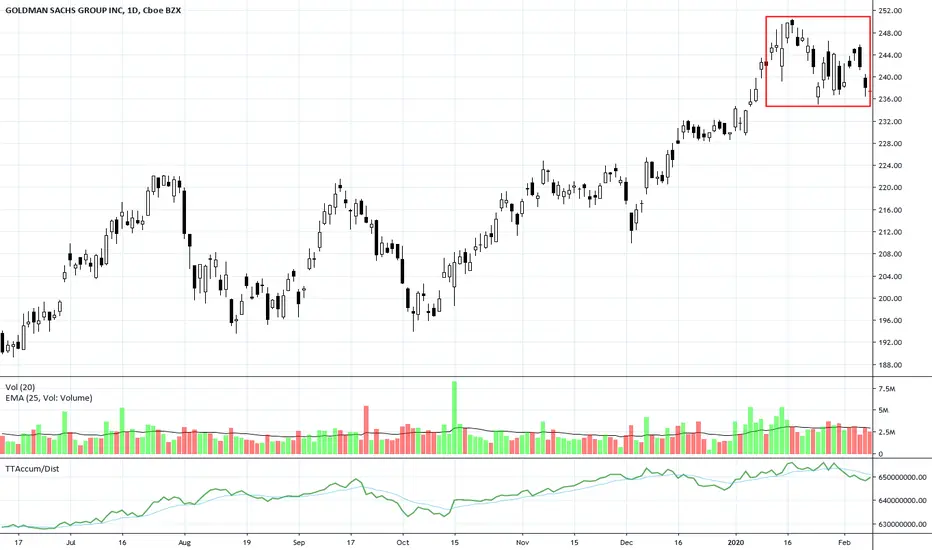
GS Shifting to a Sideways Price PatternResistance thwarted GS price action, causing the stock to retrace. It is now shifting to a sideways price action with common gaps.
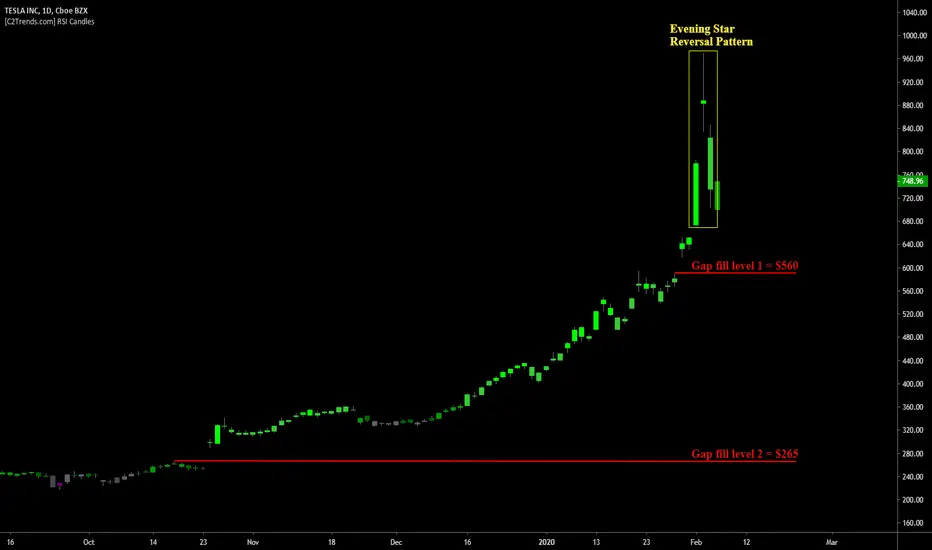
TSLA Evening Star & GapsAfter a parabolic advance that would make crypto traders envious, Tesla has created an Evening Star Reversal pattern which tend to mark the top of a price advance, or in this case, a potential blow-off top. Moves like this are rarely sustainable long-term so a pullback in the short-term is expected. Lower levels to watch for potential support stem from previous gaps in price, shown in red.
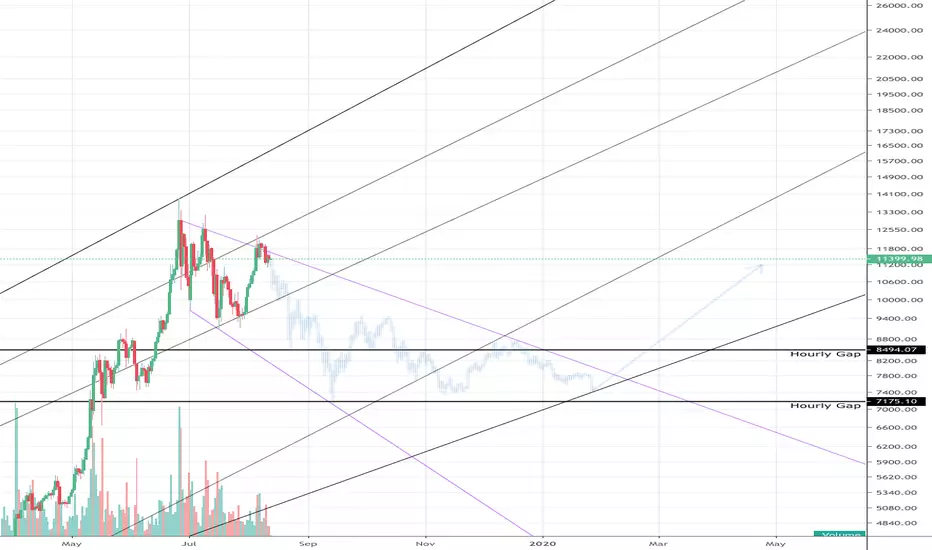
Remaining 2019 Corn Price ActionThis is how 2019 is going to play out.
I can't believe how well this fractal lines up with the trendlines and the CME Gaps.
Both gaps at $8494 and $7175 will be filled by mid-September.
Sideway movement will follow until late January/early February.
Launch sequence to the moon will have begun by Mid-February.

BYND Beyond Meats - Gaps to fill
May not be ready just yet but the 60 HMA has flipped bullish (blue) on the 4H
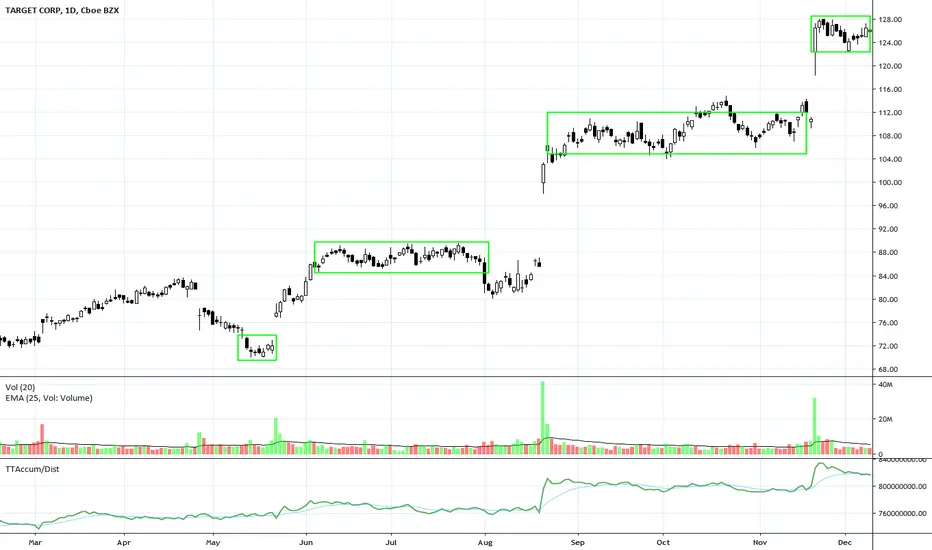
TGT Platform Position TrendTGT has a Platform candlestick pattern which is a Position Trading style sideways price action. It is indicative of Dark Pool Quiet Accumulation that then triggers High Frequency Trader gaps. The resumption of another Platform candlestick pattern indicates the accumulation is not over.
Uber Short Term BullishEntered a options call on Monday (expires Friday – high risk) since most of my indicators point short term bullish and we have 2 gaps that will probably get filled before tanking again to even lower lows. Anyone agree? As long as price maintains above $28, I will be in profit for my options call.

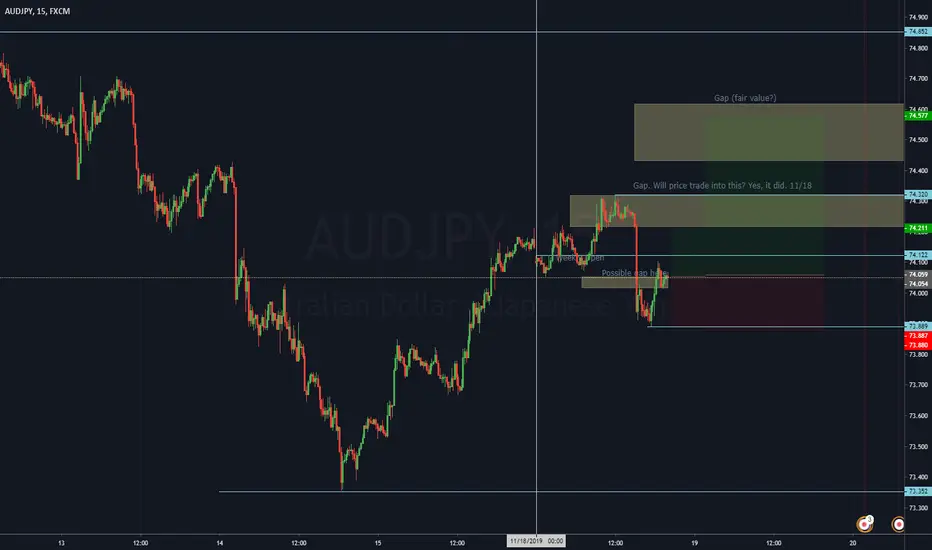
Long AudJpy (11/18) Liquidity gaps "Liquidity gaps" have been proving themselves over and over. Everytime there is a decent sized movement, price always seems to "fill in" or trade through those spots again. I've highlighted two spots in light yellow. (A third was a maybe).
It looks like price is likely going to trade in to these "gaps" , I've highlighted. These are concepts learned from ICT.
Also, I watched price fill the Weekly open last night and have noted this for a possible trading opp in the future. Any tips on Weekly opening gaps welcomed.
In a small position long with a short term target and a longer term target.
Outstanding BTC CME GapsGot a lot of shite for saying these gaps would most likely get filled. Almost there.
See previous ideas for historical gaps

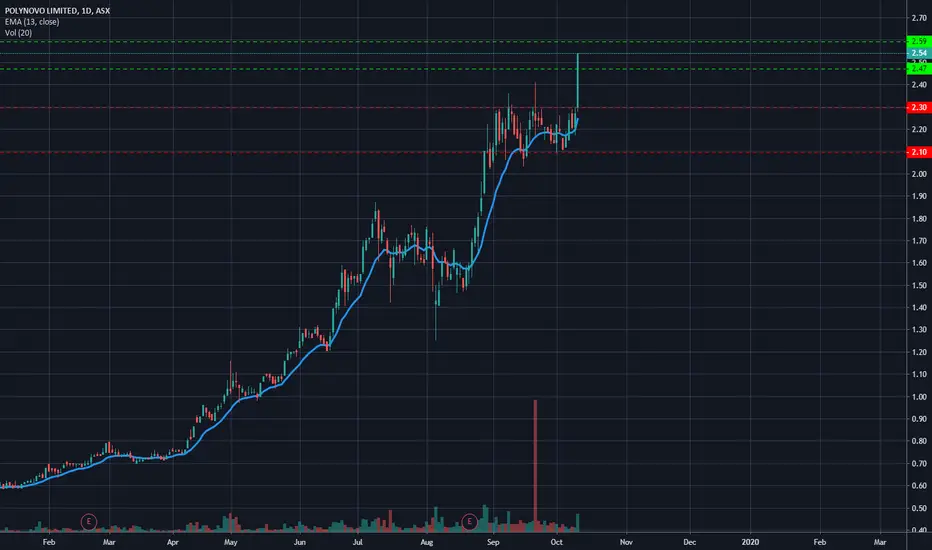
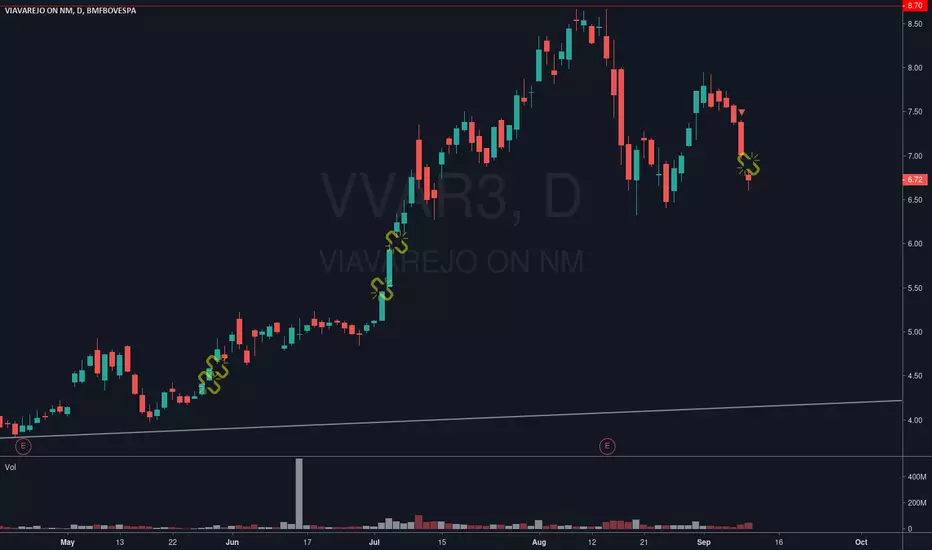
Looking for a short Had a massive gain of 11.89%, but its way overextended now. If gaps up ill be looking for a short between $2.59 and $2.47.
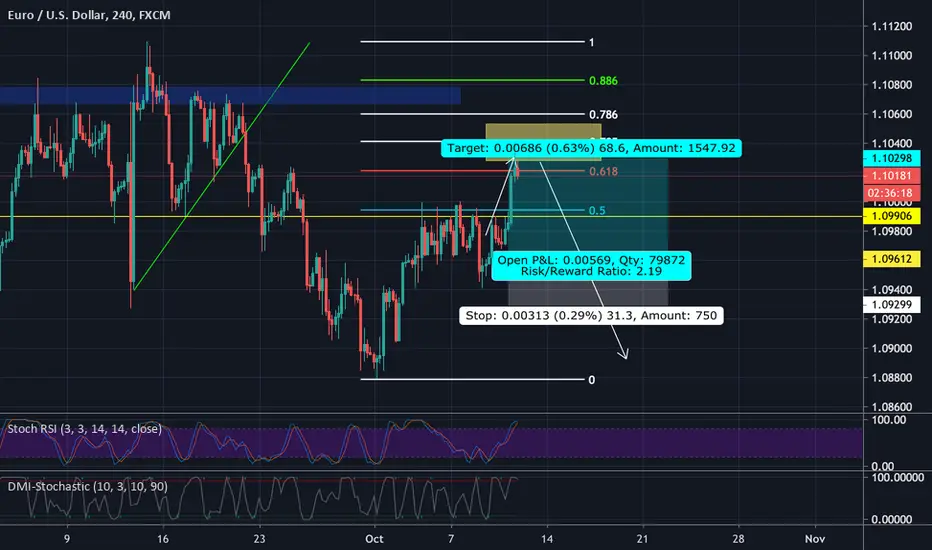
EU SellHave been following EURUSD some. Still newer to trading. However, I do see a gap in the market lower down on the weekly. Price may come down to there. Was looking for a sell setup as a previous buy from a couple weeks ago did not pan out. And here, we may have made a new lower high before dropping down again. Taking the fib tool and we can see how price has reacted right off of there. As traders, we also know price could retrace back up, maybe take a second position. For now, I have a small position that is headed downward.
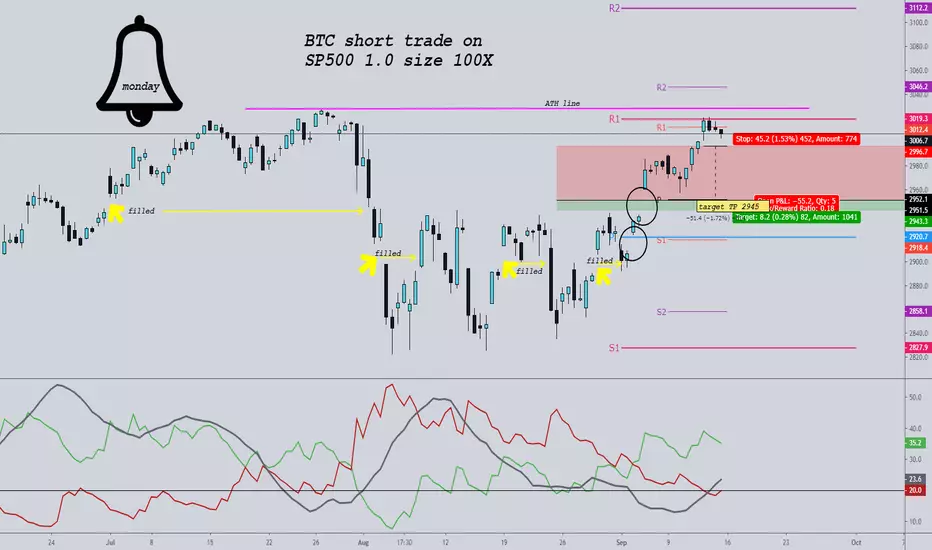
S&P 500 / XBT Trade Hi Traders ,
This could be very risky play but I'm setting my short order at 2996.5 and TP 2945 . There are multiple gaps on there as you can see in black circles that need to be filed . You can also see in yellow historical gaps and areas they got filled .
If market decide to go higher this shouldn't get triggered but anything its possible.
As you an see D- its curling up and D+ loosing steam . I believe that price it will go down. We got rejected at R1 on 1M and 1W that confirms my approach .
My previous experience with AU in this situation worked out for me . This is not trading advice in anyway and I never share my entry and exit points but this time I will .
Market its in very unpredictable zone and anything can happen including hitting new ATH .
Thank you for checking this out and I would like to hear your opinion on this .
#BTC Update in 2H View - open gapsThese 2 gaps approximately linger around
- $8,500 - $8,400
- $6,000
Not only have the technicals I've provided since the midpoint of this year make sense, the CME Futures gaps confluence these levels perfectly as a bonus.
The first target remains at the $8,500 - $8,400 zone given. $6,000 remains the final zone we would see price achieve in the event of a catastrophic meltdown.

All gaps get filled, Nature only knows truth and math cant lie.It is simple Nature abhors a vacuum. So those gaps (empty space/vacuums/gaps) get filled regardless of what we can say or do about it. TA is can be done with minimal knowledge of Biorhythms and entropy. Gaps always get filled unless a system reaches catastrophic failure to the point where data points will always equal a parabolic trend indicator.
This is a machines way of saying "fuck if I know".

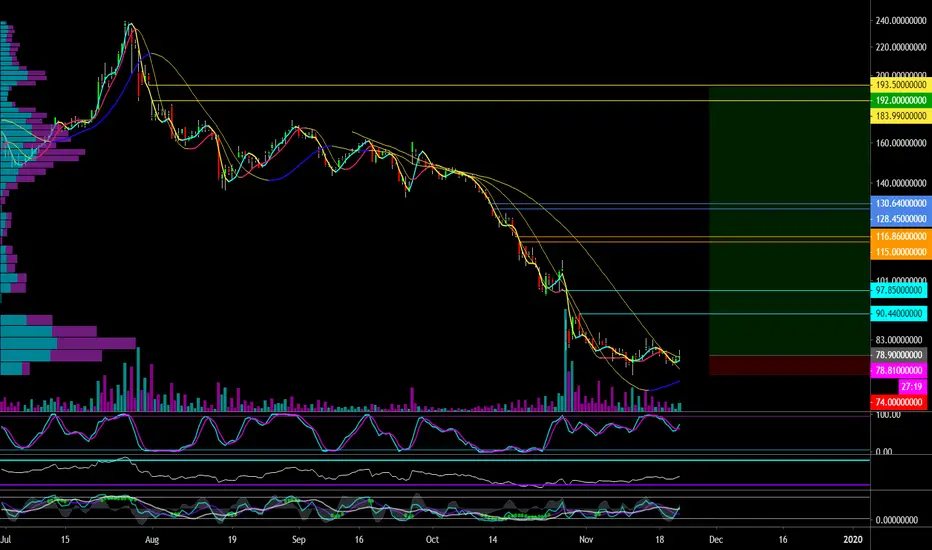
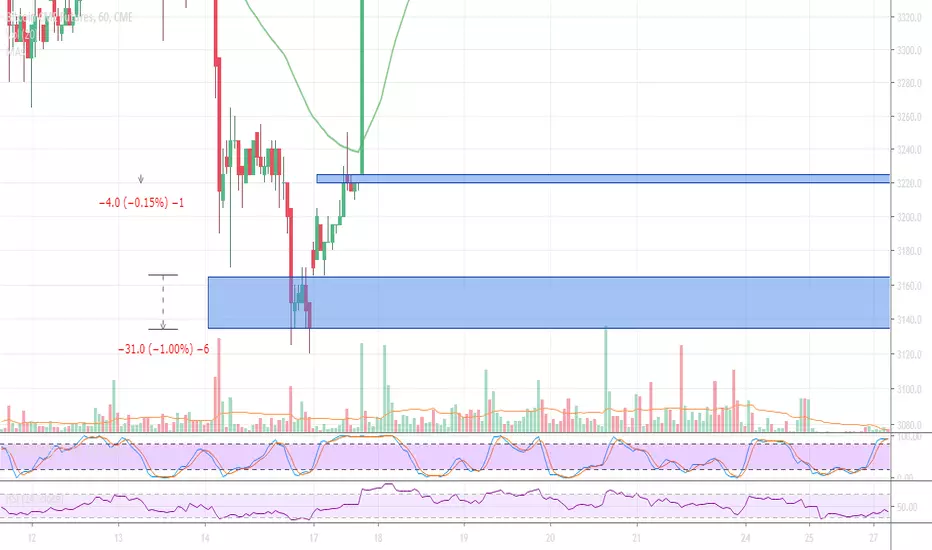
BTC tagets - 2 MORE GAPS2 Potential Gaps to be filled on the 1hr.
0.15% Gap
&
1% Gap
Did they make enough to bother coming back to fill?
Would like anyone else' opinion with history on futures, how often do these small gaps get closed? Is it likely?
Remainder of 2019 Corn Price ActionThis is how 2019 is going to play out.
I can't believe how well this fractal lines up with the trendlines and the CME Gaps.
Both gaps at $8494 and $7175 will be filled by mid-September.
Sideway movement will follow until late January/early February.
Launch sequence to the moon will have begun by Mid-February.