Gaps
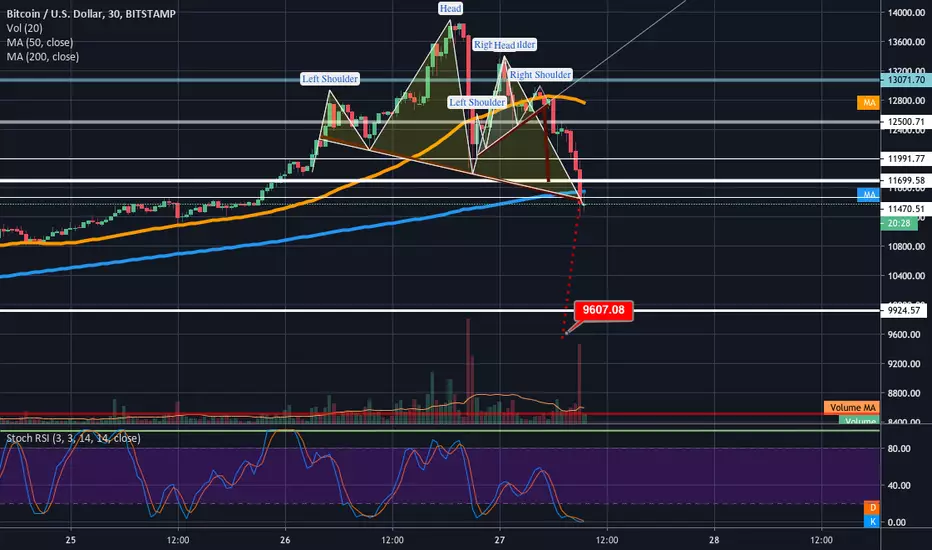
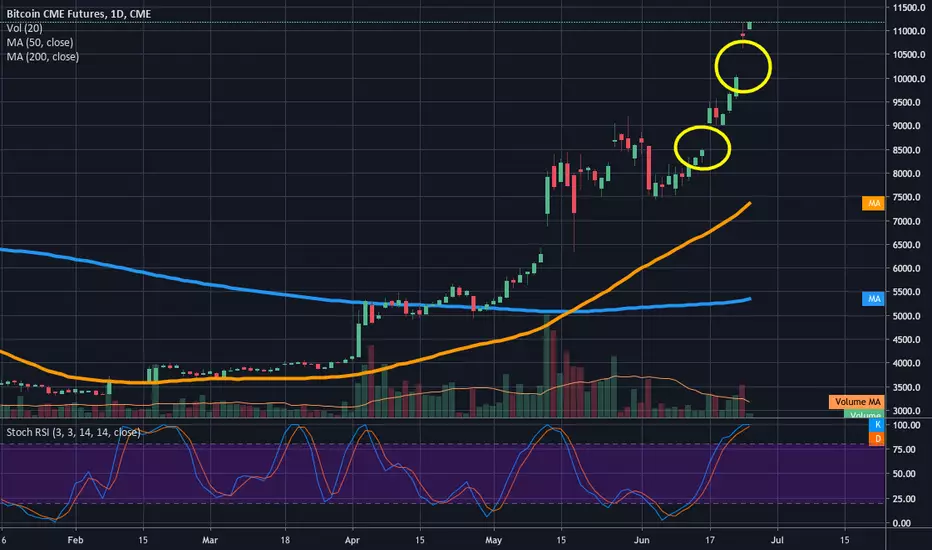
5 minute h&s inside 30minute h&s's right shoulder triggersA 5 minute chart head and shoulder pattern hidden inside the right shoulder of a 30 minute charts head and shoulder pattern has triggered and reached its drop target sending price action down to the neckline of the 30 minute head and shoulder pattern. If the 30 minute h&s pattern triggers it's drop target is 9.6k or so. Considering we have gaps on the CME futures contracts to fill around 8500 odds are very good we will continue to dip lower so I think it's no coincidence that on the eve of the G20 summit at which they will be discussing unilaterally applying the FATF's new universal rules on crypto that the exchange bittrue suffers a big hack and price plummets setting the stage with pre FUD for G20 to employ even more FUDmongering. So I anticipate even more FUD from G20 to take the price even further doesn't to the 39% retracement support line at 8504 to fill all th gaps on thee CME futures. They say in stocks "All gaps must get filled" and while statistically 91.4% of all up gaps do get filled her's still that .6% of the time gaps don't get filled so i is very wise to ladder back in portions of your position on the way to 8504 because here's np guarantee we reach the bottom gap. That's what I will be doing anyways of course this is no financial advice and just my opinion so take from it whatever you will. Thanks for reading and good luck!
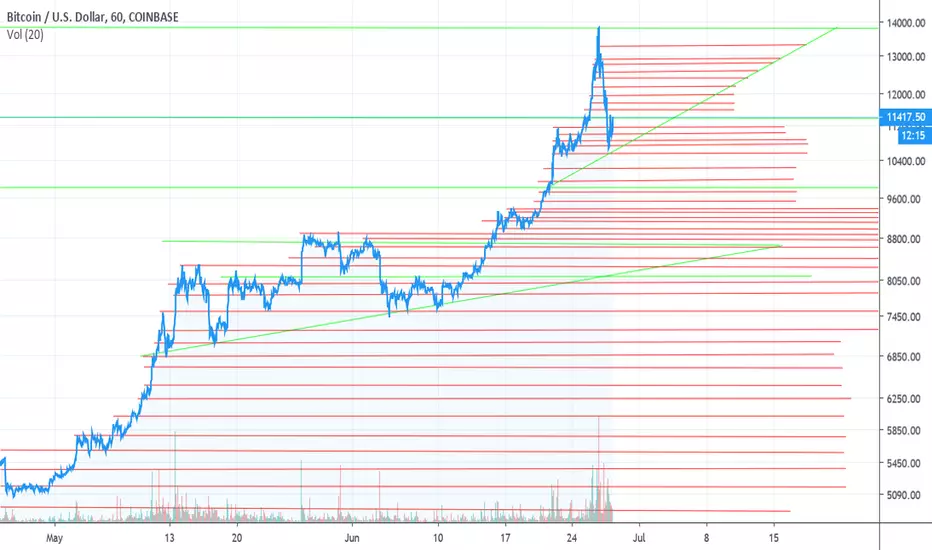
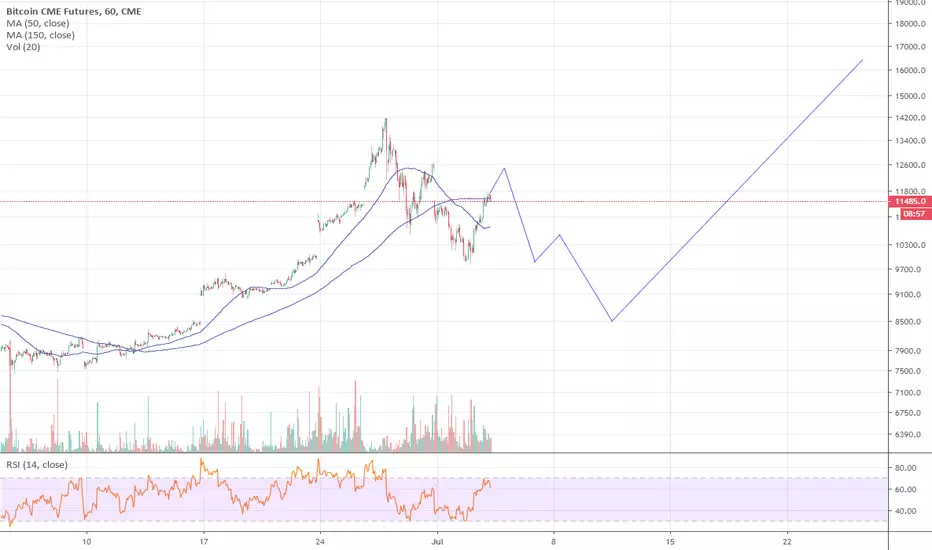
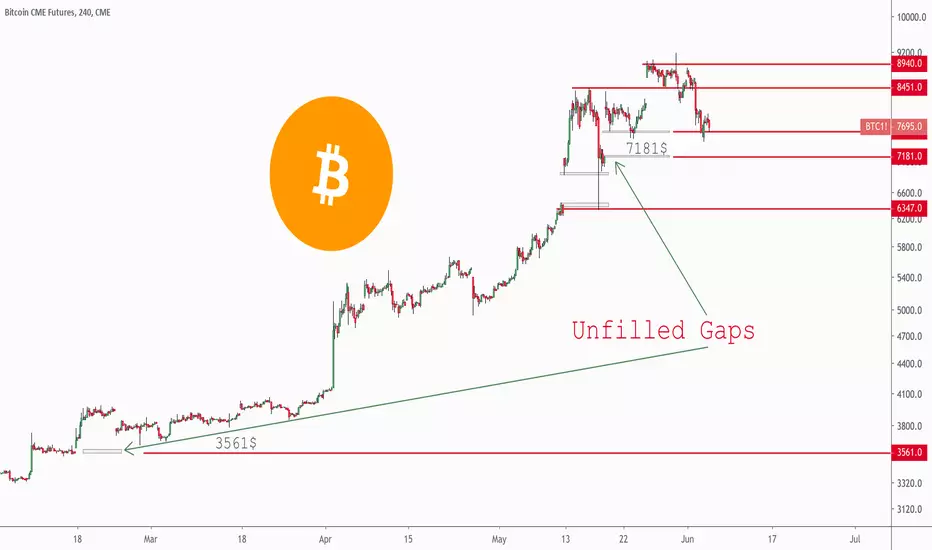
2 gaps on cme chart prompt valid concern for a correction I think we sill have another leg or 2 to break up but these gaps on the CME are alarming....mainly because traditional stock charts tend to always fill these gaps eventually and looking left on this chart we can see that any gaps in the past on this futures chart have indeed ben filled shortly thereafter. While I don't believe filling the gaps is an absolute, it has a high enough probability that I wouldn't be surprised if after one more leg up on bitcoin, we may see the long overdue 31-41% correction that has ye o come his bull run, a drop from the 12k range of 31% would dip us down to right around that area. Of course there's always a chance the gap isn't filled although far lower probability on that one. Something to keep an eye on regardless.
Bitcoin GapsThere is Two unfilled gaps on the Bitcoin CME Futures chart.
Gaps are areas on a chart where the price of a stock (or another financial instrument) moves sharply up or down, with little or no trading in between. As a result, the asset's chart shows a gap in the normal price pattern. The enterprising trader can interpret and exploit these gaps for profit.
Gap Basics
Gaps occur because of underlying fundamental or technical factors. For example, if a company's earnings are much higher than expected, the company's stock may gap up the next day. This means the stock price opened higher than it closed the day before, thereby leaving a gap. In the forex market, it is not uncommon for a report to generate so much buzz that it widens the bid and ask spread to a point where a significant gap can be seen. Similarly, a stock breaking a new high in the current session may open higher in the next session, thus gapping up for technical reasons.
How to Play the Gaps
There are many ways to take advantage of these gaps, with a few strategies more popular than others. Some traders will buy when fundamental or technical factors favor a gap on the next trading day. For example, they'll buy a stock after hours when a positive earnings report is released, hoping for a gap up on the following trading day. Traders might also buy or sell into highly liquid or illiquid positions at the beginning of a price movement, hoping for a good fill and a continued trend. For example, they may buy a currency when it is gapping up very quickly on low liquidity and there is no significant resistance overhead.
Some traders will fade gaps in the opposite direction once a high or low point has been determined (often through other forms of technical analysis). For example, if a stock gaps up on some speculative report, experienced traders may fade the gap by shorting the stock. Lastly, traders might buy when the price level reaches the prior support after the gap has been filled. An example of this strategy is outlined below.
Here are the key things you will want to remember when trading gaps:
∙ Once a stock has started to fill the gap, it will rarely stop, because there is often no immediate support or resistance.
∙ Exhaustion gaps and continuation gaps predict the price moving in two different directions – be sure you correctly classify the gap you are going to play.
∙ Retail investors are the ones who usually exhibit irrational exuberance; however, institutional investors may play along to help their portfolios, so be careful when using this indicator and wait for the price to start to break before taking a position.
∙ Be sure to watch the volume. High volume should be present in breakaway gaps, while low volume should occur in exhaustion gaps.
Source: investopedia.com
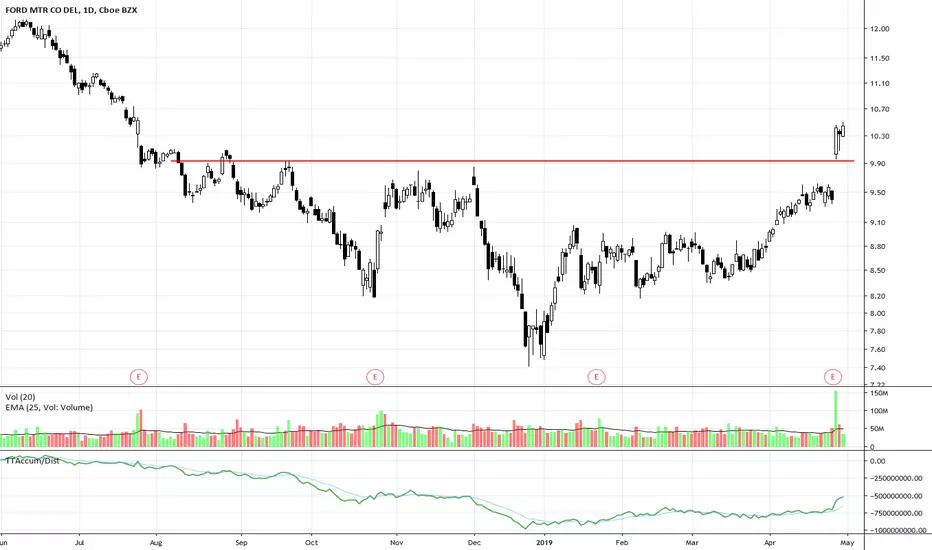
Ford Motor Company GapsFord Motor Company has been in an intermediate-term bottoming formation that completed recently. The stock gapped after a strong earnings report. The stock has sustained the gains from the gap. The stock may shift sideways or consolidate before resuming an uptrend.
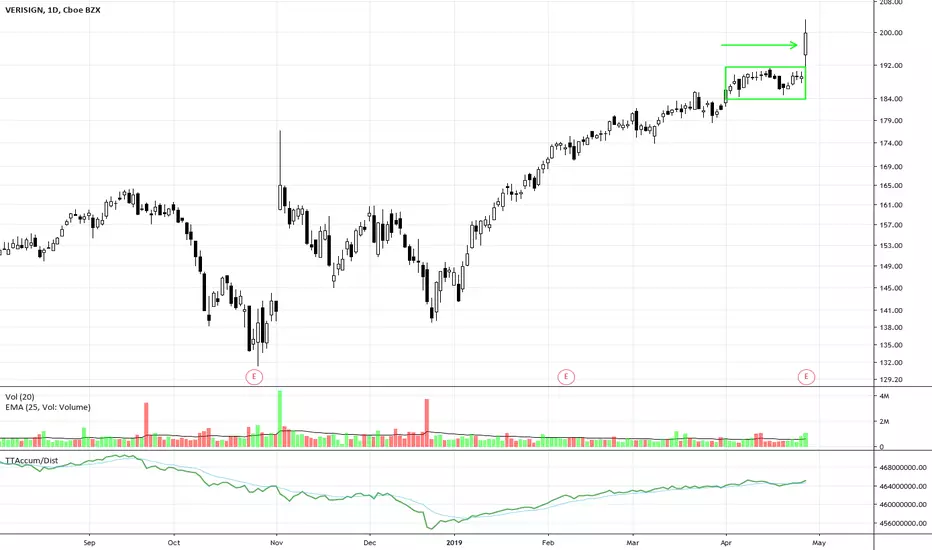
VRSN Compression Gaps on NewsVerisign Inc. had a typical compression pattern and then gapped on good news. The gap is a breakaway due to the pattern of the consolidation.
HFTs Make a Mistake on CELGCelgene Corp has had 3 HFT gaps this year. The first was gigantic. Then HFTs made a mistake and gapped the stock down. This resulted in Pro Trader buying at that lower level. Recently it gapped up and is in a compression mode.

CMT Gaps & S/R #long#CMT have a lot of gaps to fill on the way up, the full green horizontal lines, all other lines are EMA's, MA's, Ichimoku S/R
There is one gap below unfilled at 730 sats, this is where you long.


$TWTR | TA (gaps)Do gaps work the same way in the stock market as they do crypto? I have traded normal stocks in years.
This chart was well explained.
Enjoy.

AAPL / D1 : exhaustion gap to trap the dumb money ?TIP :
A trend in stocks generally has 3 types of gaps along the way :
1st gap is often a breakout gap to trigger the trend trade
2nd gap is a common gap acting as continuation on the trend
3rd gap generally occurs like a trap at the end of the trend. Trying to show the stock has some more potential when it's already to late. Dumb traders enter, smart money reverses. The gap is generally filled a few days after it occured. Signaling the trend is terminated and that the prices will enter in corrective territory.
Hope this idea will inspire some of you !
Don't forget to hit the like/follow button if you feel like this post deserves it ;)
That's the best way to support me and help pushing this content to other users.
All my scenarios and portfolio managements are explained in a daily basis on my Youtube channel.
You'll find a link to get there in my profile signature here : @PRO_Indicators
The English videos are posted upon the "Market Forecast (ENG)" Playlist.
Kindly,
Phil

Short Setup USOILCurrently USOIL is testing upper MLH of inside fork as well as the lower 0.5 of regular fork based on pivots that were formed later. An inflow of supply at this level is expected. Selling short 6635 with 1.8*ATR stops and looking for 2R-3R targets below is the plan.

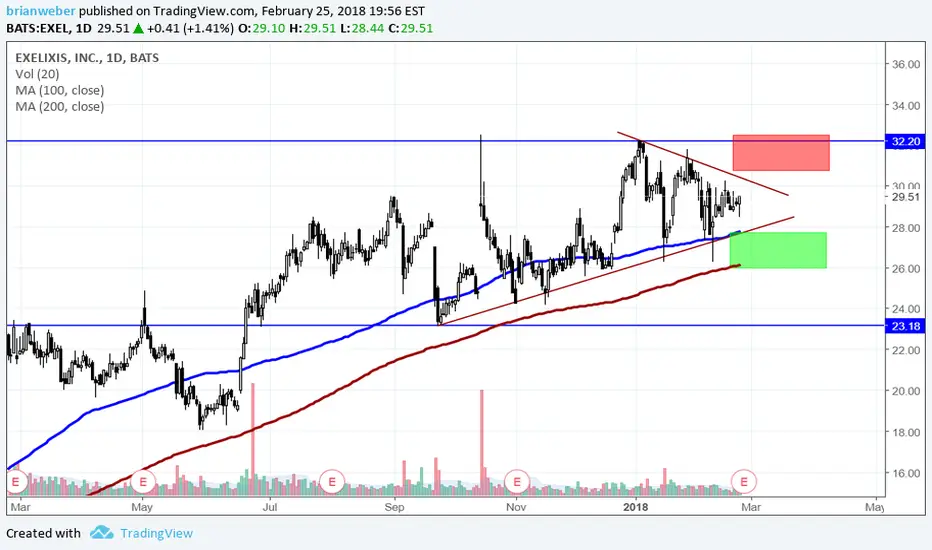
My earnings analysis on EXELThere is a nice symmetrical triangle pattern that has formed just in time for earnings. A good indication that a decent move is in store for EXEL depending on the ER.
Green box : gap down here into support we could see some buying off the lower trendline and 100 day SMA, or the 200 day SMA if the price gaps that far. The latter being a much stronger area to buy.
Red box : gap up into resistance we could see some selling. However, if the move is strong enough, the resistance at $32.20 could be broken and she moves higher. At that point look to buy the rest off that old resistance, new support.
Let's see what happens tomorrow for earnings.
Good luck :D
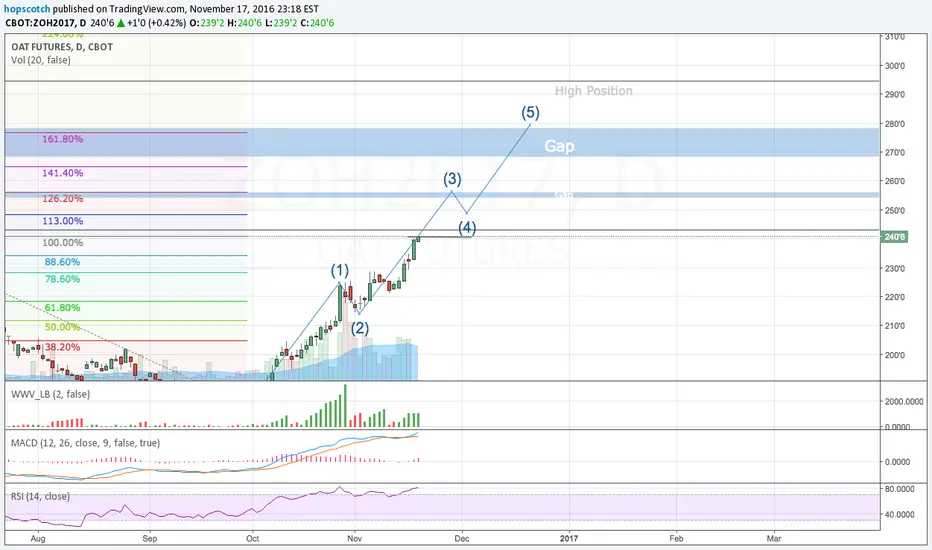
March 2017 Oats has climbs higherMarch 2017 Oats has two gaps to fill that were created back in October 2015 on the Weekly chart. It is possible that bulls want to fill these gaps. Look for more upside to 256'4 and then 280'0. Highest achievable point maybe 294'2 made back in fall of 2015.
$SPY Windows closing to the downside 204.28 up nextI am seeing 2 windows recently closed and a third on the way at 204.28. Also a downward megaphone. 60min chart

TATA MOTORS - Covering Gap (Sell)As per the previous close, it seems bearish and looks like it will fill up the previous gap up on daily chart as well as hourly.
Take 50% profits at the first target zone marked in the range of 444-447.
Manage your risk with entry and positioning sizing.

pennies to thousands above cloud gap up holding observebologna bands widening get our book pennies to thousands 40 yrs trading to read bologna bands mad crossed stoc crossed rbi good cci and per r upper band

New Intra-Day Gap Indicator. V1 - More Features Coming Soon!CM_Gap_Indicator_Intra-Day_V1
This is a Simple Gap Indicator.
Version 1…Many Additional Features To Come.
***Designed for Intra-Day Charts.
***Great for Stocks…Forex and Futures Sunday Night Gaps.
***Plots Green Lines If Gap Up
***Plots Red Lines If Gap Down
Additional Filters Coming Soon:
***Minimum Gap% Filter
***Gap Mid Lines
***Color Coding On Filled Gaps

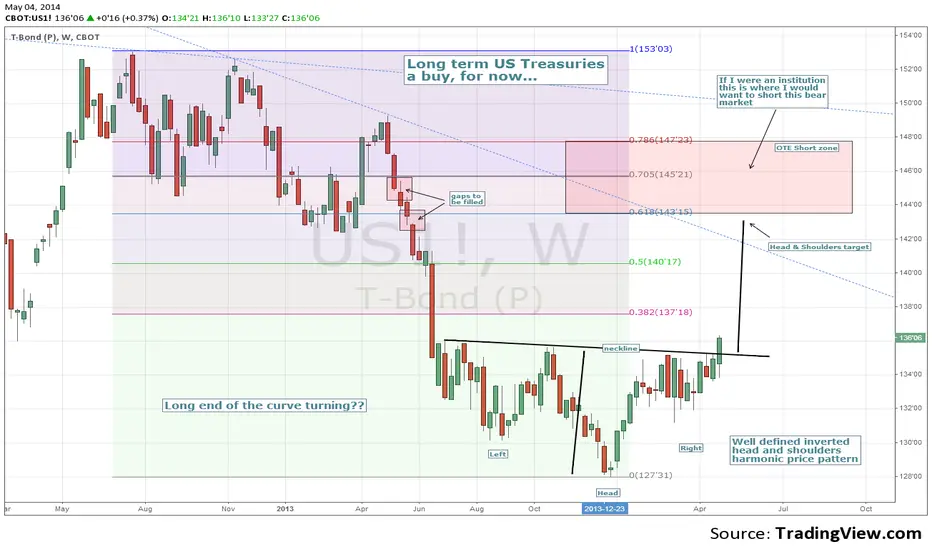
Long term US Treasuries - A buy, for now...As we fast approach the typical seasonal top for the North American economy it shouldn't surprise us to see the anti-equity-market proxy (bonds) start to look more attractive. While I am not suggesting a trade (low reward to risk ratio on setup prevents me from considering the idea) , I do respect the fact that we may see a nice rally from current levels. Three justifiable reasons suggest to me price wants to revisit the low 140 area in the not too distant future. 1. Inverted Head and shoulders price pattern target (outlined on chart). 2. Optimal Short Trade Entry (OTE) zone currently about 144 to 148 . 3. Gaps near 143 & 145 need to be filled. Put it all together and I can comfortably understand a bond market rally - but as previously mentioned, because reward is about equal to risk I simply can not justify taking a trade....
Cheers all and I hope my simple analysis is of benefit...
If my charts help you, or you use my indicators...
please consider a BTC donation to allow me to
continue my work :
1EBttA56cWsgtsZn83VGiNT8si7inZV5Z5
& follow me on Twitter @CRInvestor