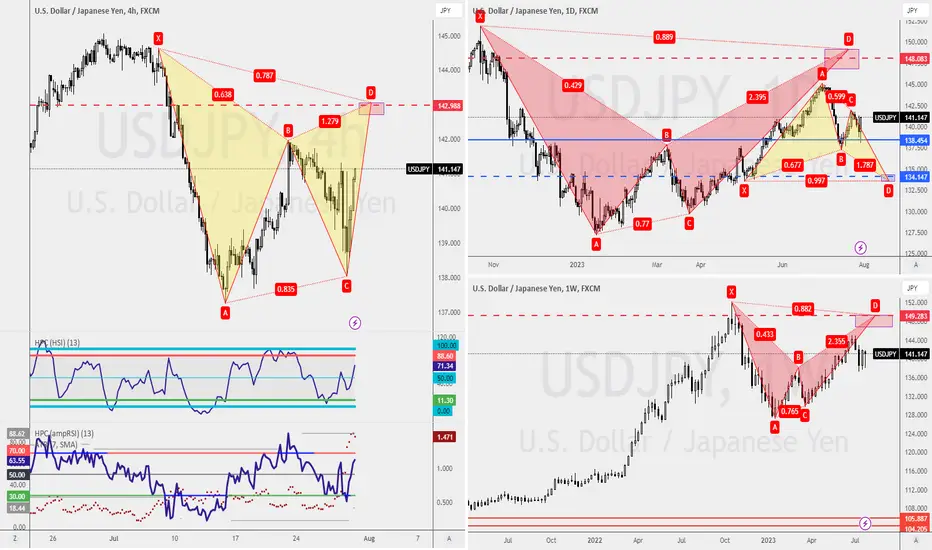
Dollar Yen: Riding the Bullish Wave!📊 On the weekly chart, a strong W formation with a long tail signals potential upward movement. Daily chart shows another bullish W formation, indicating a powerful uptrend. Four-hour chart proves the market's strength after breaking support. Trend traders wait for confirmation above 141.96.
🎯 Weekly Bearish Bat Pattern at 149.45 presents a trading opportunity. Daily Gartley Pattern at X 133.60 offers buying potential for trend traders. Counter-trend traders eye a shorting opportunity at 149.18 on the rise. Four-hour Bearish Gartley Pattern at 143.06 sets the stage for another trade.
⏱️ Spend just 15 mins a day to spot money-making trades! Join our community to master trend identification. 💪💰
📉 Consider the resistance level at 141.25 or wait for a pullback to 139.91 for a buying opportunity on the one-hour chart.
💡 Follow my only account @raynlim for more insightful trade ideas and updates. 📈💡
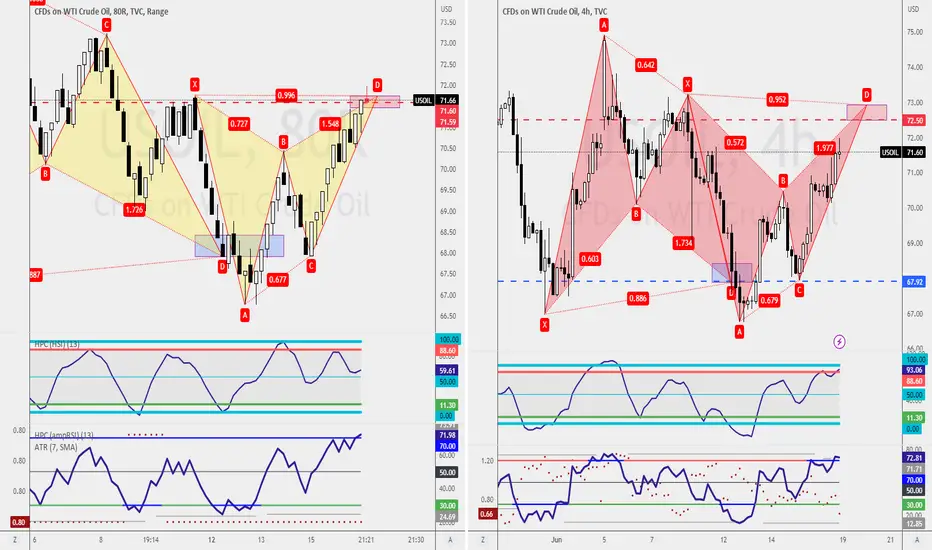
Gartleypatternatx
Fantastic OpportunitiesAs the WTI or US Oil is on a sideway movement, it creates fantastic trading opportunities for counter-trend traders like myself.
There are 2 approaches I'm looking at in the following week. A Bearish Gartley Pattern at X, a shorting opportunity on the 8-range bar chart, or a Bearish Bat Pattern on the 4-hourly chart.
The important candlesticks confirmation on the Gartley Pattern at X requires the next candlestick to touch 71.47 before the pattern is valid; failure to do so, I'll be waiting for the Bearish Bat Pattern.
Magic Candle has to appear at 72.94 for the Bat Pattern on the 4-hourly chart(right) to be valid.
This is how trading should be. Plan your trade, and wait for candlestick pattern confirmation before engaging the trade.
What's your trade plan for WTI?