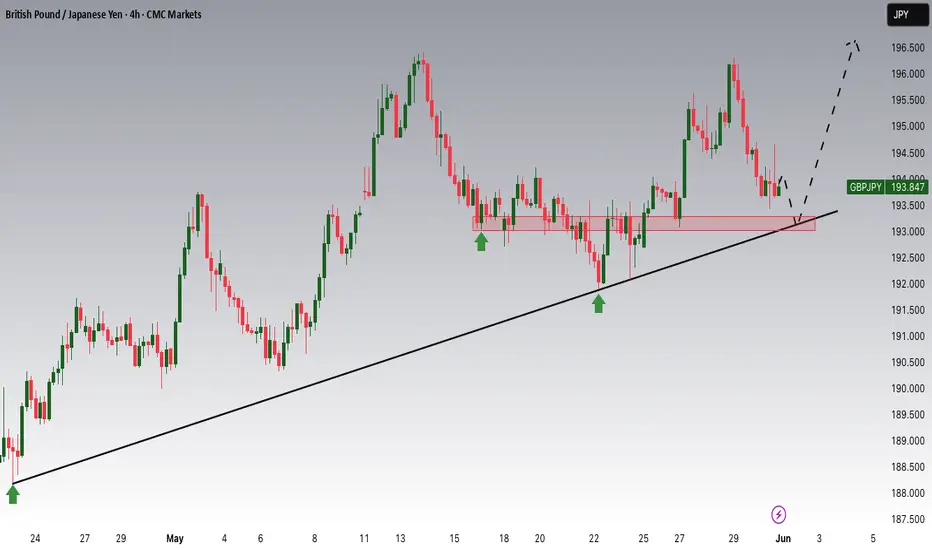
GBPJPY Potential UpsidesHey Traders, in the coming week we are monitoring GBPJPY for a buying opportunity around 193.300 zone, GBPJPY is trading in an uptrend and currently is in a correction phase in which it is approaching the trend at 193.300 support and resistance area.
Trade safe, Joe.
GBP (British Pound)
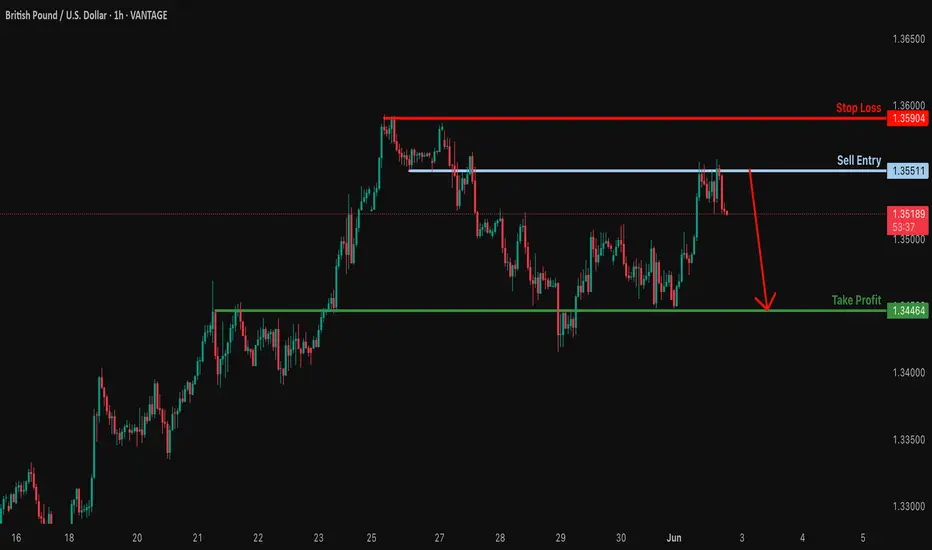
Potential bearish drop?GBP/USD has rejected off the reistance level which is a pullback resistance and could drop from this level to our take profit.
Entry: 1.3551
Why we like it:
There is a pullback resistance level.
Stop loss: 1.3590
Why we like it:
There is a pullback resistance level.
Take profit: 1.3446
Why we like it:
There is an overlap support level.
Enjoying your TradingView experience? Review us!
Please be advised that the information presented on TradingView is provided to Vantage (‘Vantage Global Limited’, ‘we’) by a third-party provider (‘Everest Fortune Group’). Please be reminded that you are solely responsible for the trading decisions on your account. There is a very high degree of risk involved in trading. Any information and/or content is intended entirely for research, educational and informational purposes only and does not constitute investment or consultation advice or investment strategy. The information is not tailored to the investment needs of any specific person and therefore does not involve a consideration of any of the investment objectives, financial situation or needs of any viewer that may receive it. Kindly also note that past performance is not a reliable indicator of future results. Actual results may differ materially from those anticipated in forward-looking or past performance statements. We assume no liability as to the accuracy or completeness of any of the information and/or content provided herein and the Company cannot be held responsible for any omission, mistake nor for any loss or damage including without limitation to any loss of profit which may arise from reliance on any information supplied by Everest Fortune Group.
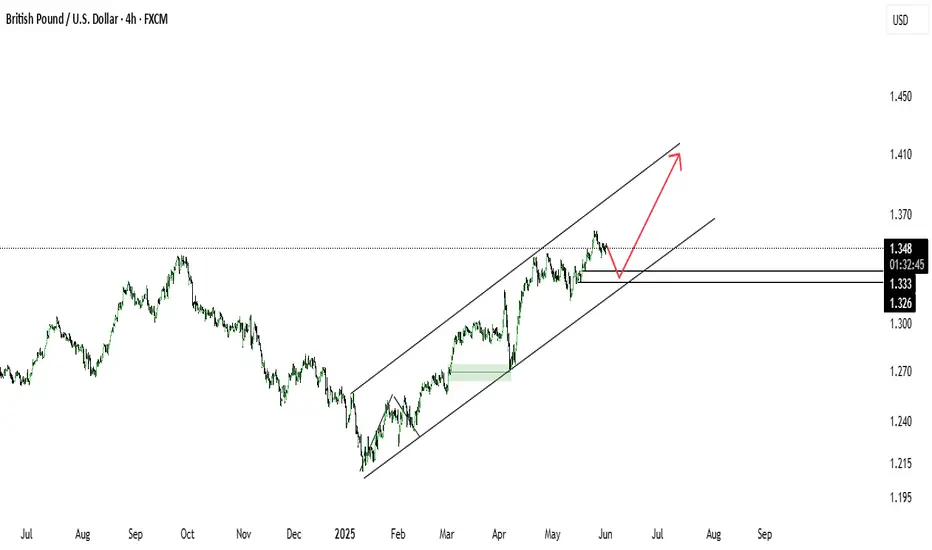
GBP/USD Bullish Channel Holding–Pullback Before the Next Leg Up?This is a 4-hour chart of the British Pound vs US Dollar (GBP/USD) from FXCM, showing a strong bullish market structure within a rising parallel channel.
🔍 Key Technical Insights:
Uptrend Channel: Price has been consistently making higher highs and higher lows within a well-defined ascending channel.
Support Zones: Three horizontal levels are marked at 1.348, 1.333, and 1.326 — likely acting as short-term demand zones or reaction points.
Projection Path (Red Line): A pullback into the lower part of the channel (likely near 1.333–1.326 zone) is anticipated, followed by a bullish continuation toward the upper channel resistance.
🧭 Market Outlook:
Bias: Bullish while above channel support.
Buy Area: Ideal long setup may develop around the 1.333–1.326 support region.
Target Zone: Potential continuation toward 1.410+ if the structure holds.
This chart favors trend continuation after a correction, aligning with smart money accumulation and institutional flow behavior within a bullish channel.
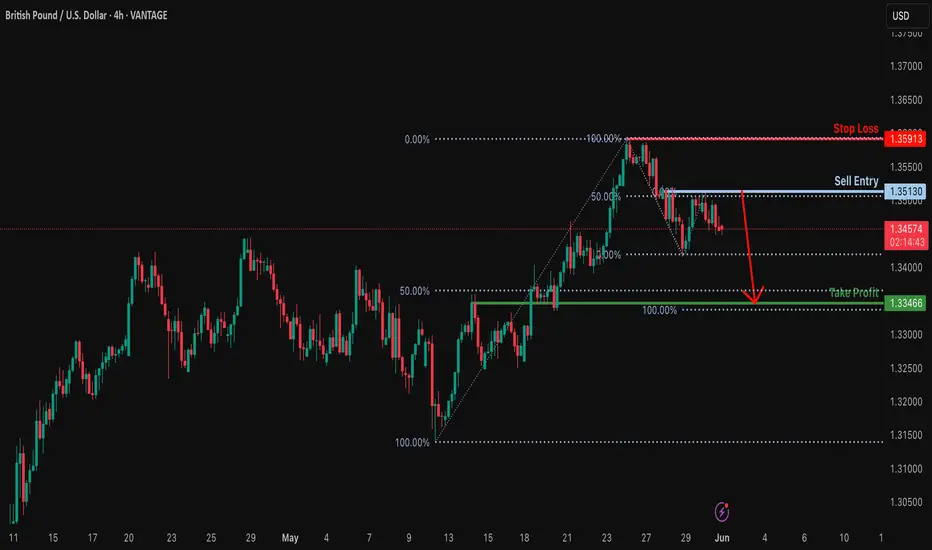
Potential bearish drop?GBP/USD has reacted off the resistance level which is a pullback resistance that lines up with the 50% Fibonacci retracement and could drop from this level to our take profit.
Entry: 1.3346
Why we like it:
There is a pullback resistance level that aligns with the 50% Fibonacci retracement.
Stop loss: 1.3591
Why we like it:
There is a pullback resistance level.
Take profit: 1.3346
Why we like it:
There is a pullback support level that lines up with the 50% Fibonacci retracement.
Enjoying your TradingView experience? Review us!
Please be advised that the information presented on TradingView is provided to Vantage (‘Vantage Global Limited’, ‘we’) by a third-party provider (‘Everest Fortune Group’). Please be reminded that you are solely responsible for the trading decisions on your account. There is a very high degree of risk involved in trading. Any information and/or content is intended entirely for research, educational and informational purposes only and does not constitute investment or consultation advice or investment strategy. The information is not tailored to the investment needs of any specific person and therefore does not involve a consideration of any of the investment objectives, financial situation or needs of any viewer that may receive it. Kindly also note that past performance is not a reliable indicator of future results. Actual results may differ materially from those anticipated in forward-looking or past performance statements. We assume no liability as to the accuracy or completeness of any of the information and/or content provided herein and the Company cannot be held responsible for any omission, mistake nor for any loss or damage including without limitation to any loss of profit which may arise from reliance on any information supplied by Everest Fortune Group.
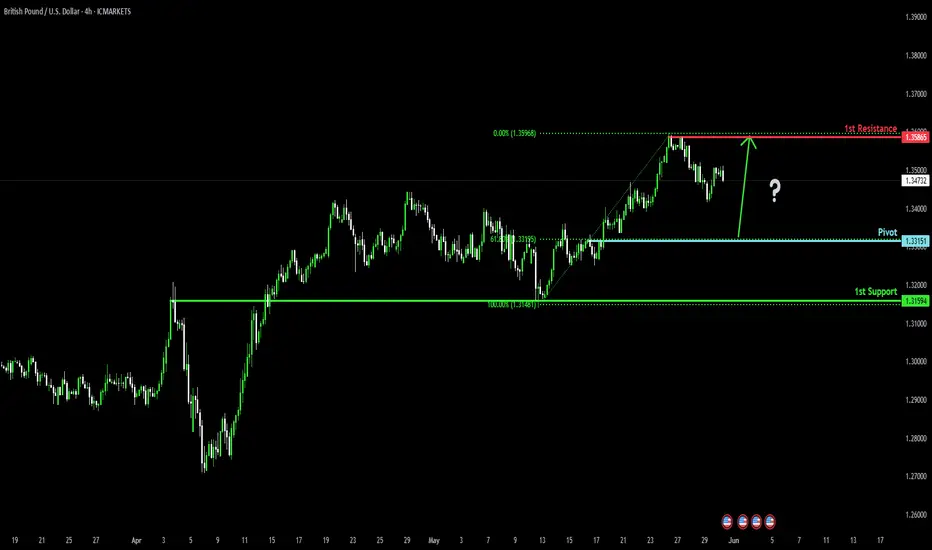
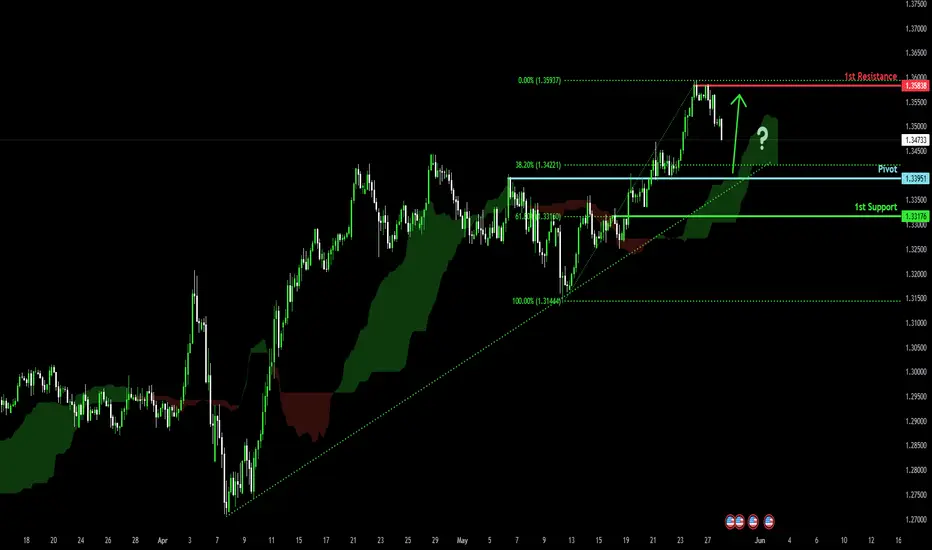
Falling towards 61.8% Fibonacci support?The Cable (GBP/USD) is falling towards the pivot and could bounce to the 1st resistance, which is a pullback resistance.
Pivot: 1.3314
1st Support: 1.3159
1st Resistance: 1.3566
Risk Warning:
Trading Forex and CFDs carries a high level of risk to your capital and you should only trade with money you can afford to lose. Trading Forex and CFDs may not be suitable for all investors, so please ensure that you fully understand the risks involved and seek independent advice if necessary.
Disclaimer:
The above opinions given constitute general market commentary, and do not constitute the opinion or advice of IC Markets or any form of personal or investment advice.
Any opinions, news, research, analyses, prices, other information, or links to third-party sites contained on this website are provided on an "as-is" basis, are intended only to be informative, is not an advice nor a recommendation, nor research, or a record of our trading prices, or an offer of, or solicitation for a transaction in any financial instrument and thus should not be treated as such. The information provided does not involve any specific investment objectives, financial situation and needs of any specific person who may receive it. Please be aware, that past performance is not a reliable indicator of future performance and/or results. Past Performance or Forward-looking scenarios based upon the reasonable beliefs of the third-party provider are not a guarantee of future performance. Actual results may differ materially from those anticipated in forward-looking or past performance statements. IC Markets makes no representation or warranty and assumes no liability as to the accuracy or completeness of the information provided, nor any loss arising from any investment based on a recommendation, forecast or any information supplied by any third-party.

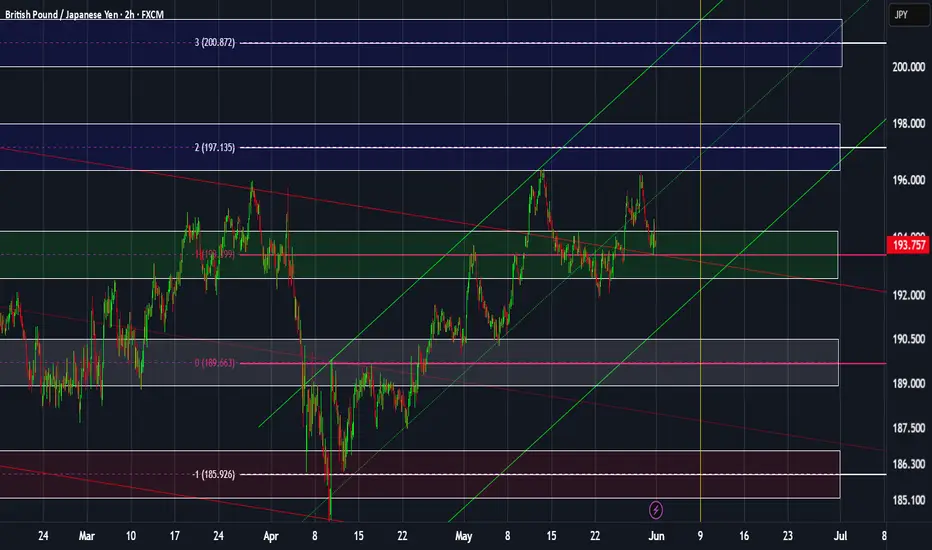
GBPJPY Weekly overview Jun 1, 2025 – Jun 7, 2025BOJ Gov Ueda Speaks could make market move faster in its direction. avoid trading around his speech.
*******************************************************************
The indicated levels are determined based on the most reaction points and the assumption of approximately equal distance between the zones.
Some of these points can also be confirmed by the mathematical intervals of Murray.
You can enter with/without confirmation. IF you want to take confirmation you can use LTF analysis, Spike move confirmation, Trend Strength confirmation and ETC.
SL could be placed below the zone or regarding the LTF swings.
TP is the next zone or the nearest moving S&R, which are median and borders of the drawn channels.
*******************************************************************
Role of different zones:
GREEN: Just long trades allowed on them.
RED: Just Short trades allowed on them.
BLUE: both long and short trades allowed on them.
WHITE: No trades allowed on them! just use them as TP points
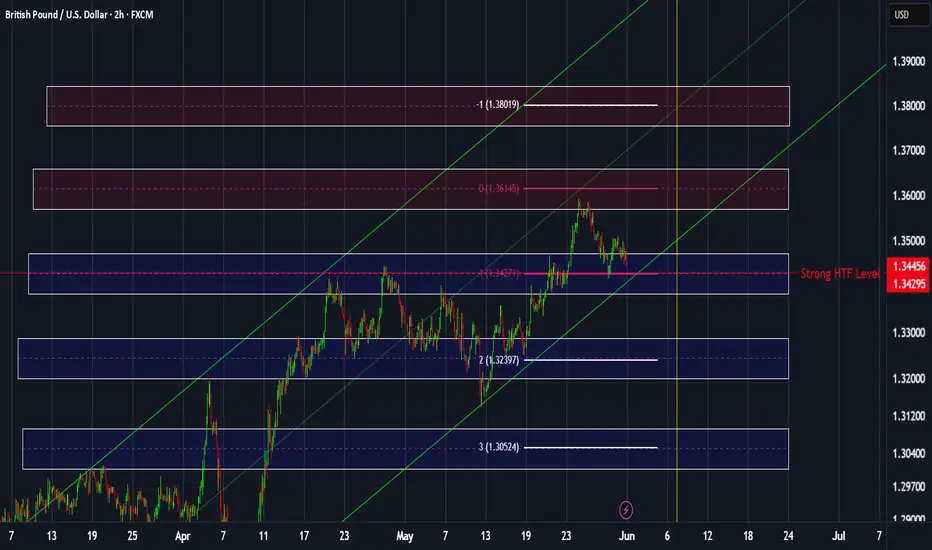
GBPUSD Weekly overview Jun 1, 2025 – Jun 7, 2025We are approaching a strong HTF reversal level from lower prices. It means we might have some unexpectable strong bearish players in the market. I'll take a little less than normal for the bullish trades.
While the mid-term overview indicates us a bullish trend some bearish move won't surprise me.
*******************************************************
The indicated levels are determined based on the most reaction points and the assumption of approximately equal distance between the zones.
Some of these points can also be confirmed by the mathematical intervals of Murray.
You can enter with/without confirmation. IF you want to take confirmation you can use LTF analysis, Spike move confirmation, Trend Strength confirmation and ETC.
SL could be placed below the zone or regarding the LTF swings.
TP is the next zone or the nearest moving S&R, which are median and borders of the drawn channels.
*******************************************************************
Role of different zones:
GREEN: Just long trades allowed on them.
RED: Just Short trades allowed on them.
BLUE: both long and short trades allowed on them.
WHITE: No trades allowed on them! just use them as TP points
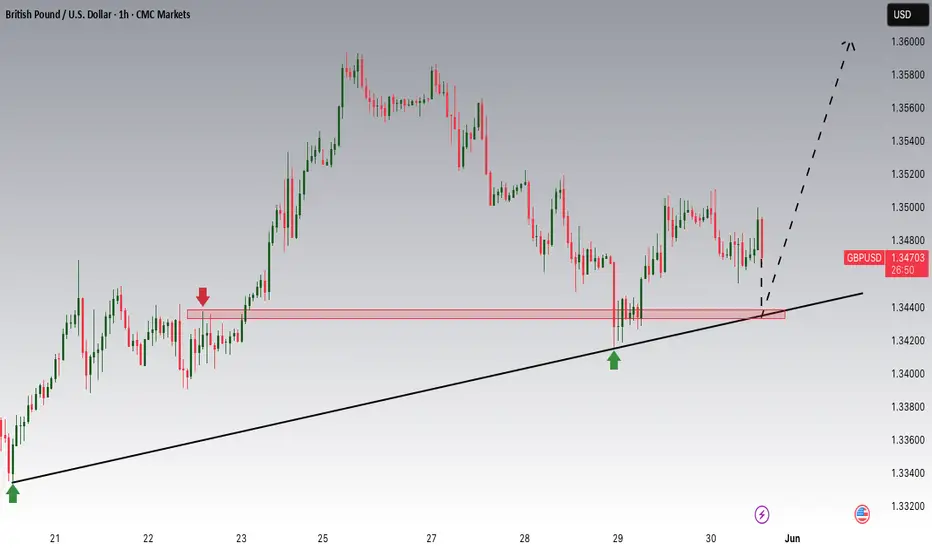
GBPUSD is Nearing an Important Support!!Hey Traders, in today's trading session we are monitoring GBPUSD for a buying opportunity around 1.34400 zone, GBPUSD is trading in an uptrend and currently is in a correction phase in which it is approaching the trend at 1.34400 support and resistance area.
Trade safe, Joe.
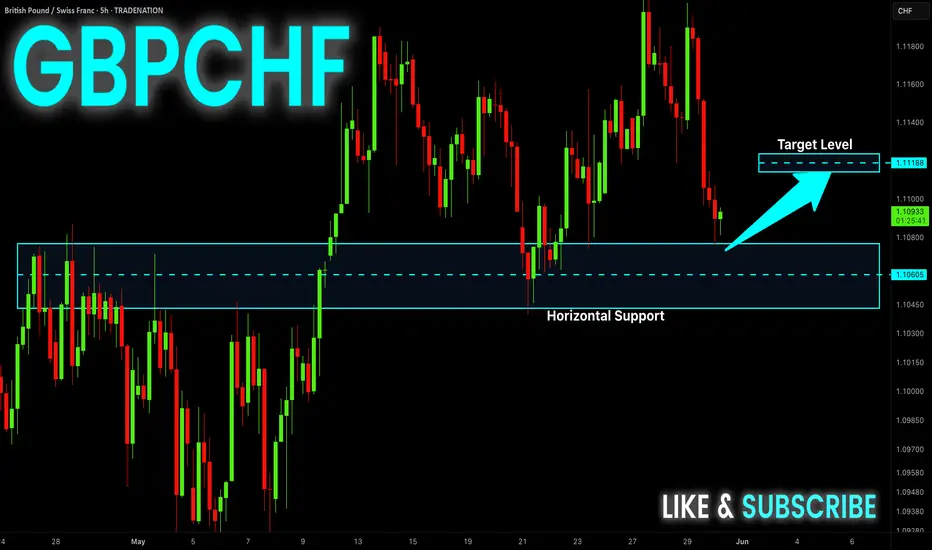
GBP_CHF POTENTIAL LONG|
✅GBP_CHF is going down now
But a strong support level is ahead at 1.1051
Thus I am expecting a rebound
And a move up towards the target of 1.1088
LONG🚀
✅Like and subscribe to never miss a new idea!✅
Disclosure: I am part of Trade Nation's Influencer program and receive a monthly fee for using their TradingView charts in my analysis.

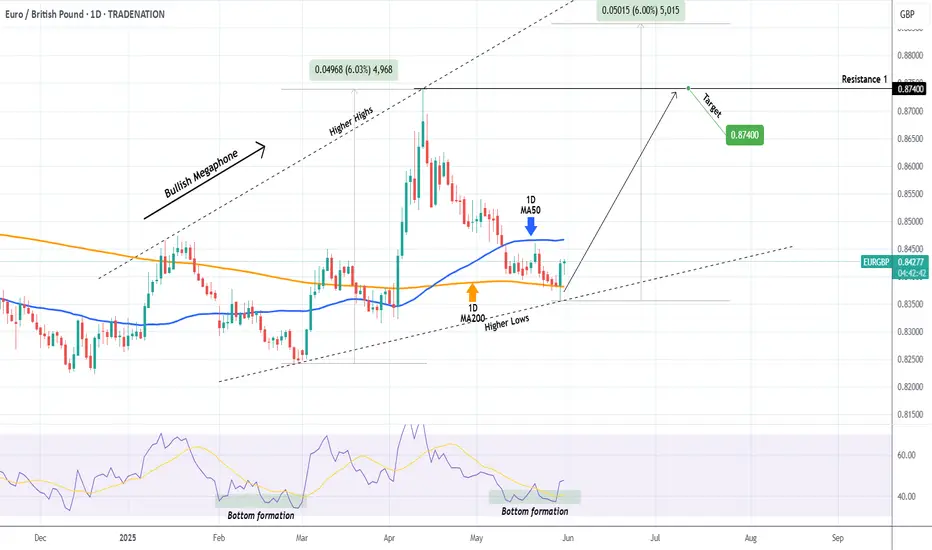
EURGBP Megaphone bottom. Strong buy opportunity.The EURGBP pair is trading within a Bullish Megaphone since the start of the year. For the past 2 weeks it has been ranging within the 1D MA50 (blue trend-line) and 1D MA200 (orange trend-line).
This is technically the bottom formation of the pattern on its new Higher Low, as the 1D RSI has been printing the same sequence as February's which priced the previous Higher Low.
We are expecting at least a Resistance 1 test at 0.87400.
-------------------------------------------------------------------------------
** Please LIKE 👍, FOLLOW ✅, SHARE 🙌 and COMMENT ✍ if you enjoy this idea! Also share your ideas and charts in the comments section below! This is best way to keep it relevant, support us, keep the content here free and allow the idea to reach as many people as possible. **
-------------------------------------------------------------------------------
Disclosure: I am part of Trade Nation's Influencer program and receive a monthly fee for using their TradingView charts in my analysis.
💸💸💸💸💸💸
👇 👇 👇 👇 👇 👇
GBPCHF: Bullish Continuation is Expected! Here is Why:
It is essential that we apply multitimeframe technical analysis and there is no better example of why that is the case than the current GBPCHF chart which, if analyzed properly, clearly points in the upward direction.
Disclosure: I am part of Trade Nation's Influencer program and receive a monthly fee for using their TradingView charts in my analysis.
❤️ Please, support our work with like & comment! ❤️

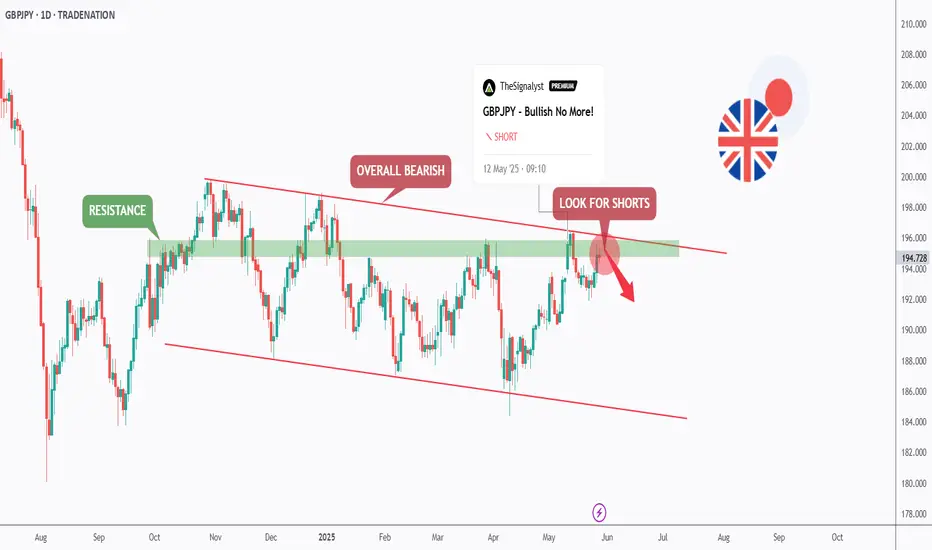
GBPJPY - Bearish Control, Again!Hello TradingView Family / Fellow Traders. This is Richard, also known as theSignalyst.
📉As per our last GBPJPY analysis (attached on the chart), it rejected the upper red trendline and traded lower.
What's next?
GBPJPY is currently retesting the upper bound of the falling red channel again.
Moreover, the green zone is a strong structure and resistance.
🏹 Thus, the highlighted red circle is a strong area to look for sell setups as it is the intersection of structure and upper red trendline acting as a non-horizontal resistance.
📚 As per my trading style:
As #GBPJPY is around the red circle zone, I will be looking for bearish reversal setups (like a double top pattern, trendline break , and so on...)
📚 Always follow your trading plan regarding entry, risk management, and trade management.
Good luck!
All Strategies Are Good; If Managed Properly!
~Rich
Disclosure: I am part of Trade Nation's Influencer program and receive a monthly fee for using their TradingView charts in my analysis.
GBP-CHF Risky Long! Buy!
Hello,Traders!
GBP-CHF will soon hit
A wide horizontal support
Level around 1.1048 and
After the retest a local
Bullish rebound and a move
Up are to be expected
Buy!
Comment and subscribe to help us grow!
Check out other forecasts below too!
Disclosure: I am part of Trade Nation's Influencer program and receive a monthly fee for using their TradingView charts in my analysis.
Falling towards 61.8% Fibonacci support?The Cable (GBP/USD) is falling towards the pivot, which serves as pullback support and could bounce to the 1st resistance, which acts as pullback resistance.
Pivot: 1.3315
1st Support: 1.3159
1st Resistance: 1.3586
Risk Warning:
Trading Forex and CFDs carries a high level of risk to your capital and you should only trade with money you can afford to lose. Trading Forex and CFDs may not be suitable for all investors, so please ensure that you fully understand the risks involved and seek independent advice if necessary.
Disclaimer:
The above opinions given constitute general market commentary, and do not constitute the opinion or advice of IC Markets or any form of personal or investment advice.
Any opinions, news, research, analyses, prices, other information, or links to third-party sites contained on this website are provided on an "as-is" basis, are intended only to be informative, is not an advice nor a recommendation, nor research, or a record of our trading prices, or an offer of, or solicitation for a transaction in any financial instrument and thus should not be treated as such. The information provided does not involve any specific investment objectives, financial situation and needs of any specific person who may receive it. Please be aware, that past performance is not a reliable indicator of future performance and/or results. Past Performance or Forward-looking scenarios based upon the reasonable beliefs of the third-party provider are not a guarantee of future performance. Actual results may differ materially from those anticipated in forward-looking or past performance statements. IC Markets makes no representation or warranty and assumes no liability as to the accuracy or completeness of the information provided, nor any loss arising from any investment based on a recommendation, forecast or any information supplied by any third-party.
GBPCHF My Opinion! SELL!
My dear friends,
My technical analysis for GBPCHF is below:
The market is trading on 1.1144 pivot level.
Bias - Bearish
Technical Indicators: Both Super Trend & Pivot HL indicate a highly probable Bearish continuation.
Target - 1.1126
About Used Indicators:
A pivot point is a technical analysis indicator, or calculations, used to determine the overall trend of the market over different time frames.
Disclosure: I am part of Trade Nation's Influencer program and receive a monthly fee for using their TradingView charts in my analysis.
———————————
WISH YOU ALL LUCK

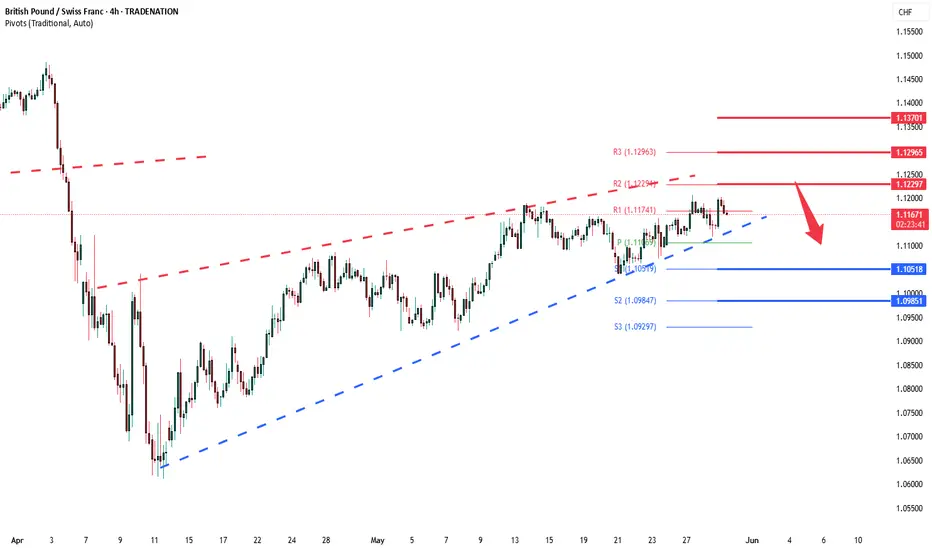
GBPCHF INTRADAY bearish below 1.1230The GBP/CHF currency pair is currently exhibiting a bearish sentiment, aligned with the broader downtrend. Recent price action shows the market is in a sideways consolidation phase, indicating a potential pause before the next directional move.
Key Trading Level: 1.1230
This level marks a prior intraday consolidation zone and serves as a critical resistance area within the current trend context.
Bearish Scenario (on rejection from 1.1230):
A failed test of 1.1230 resistance would likely reinforce bearish momentum.
Downside support targets include:
1.1100 – Initial support
1.1050 – Next structural support
1.0980 – Long-term bearish target
Bullish Scenario (on breakout above 1.1230):
A confirmed breakout and daily close above 1.1230 would invalidate the bearish structure.
In that case, potential upside targets include:
1.1300 – Key resistance level
1.1370 – Higher resistance from previous reversal zones
Conclusion
The medium-term outlook for GBP/CHF remains bearish, with 1.1230 acting as a decisive pivot level. As long as price stays below this threshold, downside continuation toward 1.1100 and beyond remains favored. However, a clear breakout above 1.1230 on a daily closing basis would shift the sentiment and open the door for a bullish correction toward 1.1300–1.1370. Traders should monitor the 1.1230 level closely for directional confirmation.
This communication is for informational purposes only and should not be viewed as any form of recommendation as to a particular course of action or as investment advice. It is not intended as an offer or solicitation for the purchase or sale of any financial instrument or as an official confirmation of any transaction. Opinions, estimates and assumptions expressed herein are made as of the date of this communication and are subject to change without notice. This communication has been prepared based upon information, including market prices, data and other information, believed to be reliable; however, Trade Nation does not warrant its completeness or accuracy. All market prices and market data contained in or attached to this communication are indicative and subject to change without notice.
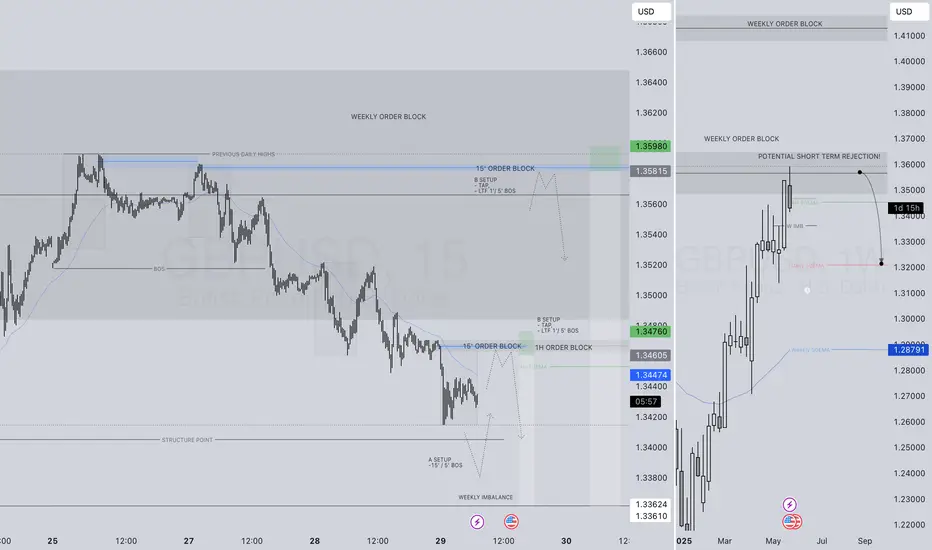
CONFLUENCE KEY GBPUSD SHORT FORECAST Q2 W22 D29 Y25GBPUSD SHORT FORECAST Q2 W22 D29 Y25
🔥👀QUICK SCOPE TECHNICAL REVERSAL HOT PICK
Professional Risk Managers👋
Welcome back to another FRGNT chart update📈
Diving into some Forex setups using predominantly higher time frame order blocks alongside confirmation breaks of structure.
Let’s see what price action is telling us today!
💡Here are some trade confluences📝
✅Weekly order block
✅15' order block
✅1 hour order block
✅Tokyo ranges to be filled
🔑 Remember, to participate in trading comes always with a degree of risk, therefore as professional risk managers it remains vital that we stick to our risk management plan as well as our trading strategies.
📈The rest, we leave to the balance of probabilities.
💡Fail to plan. Plan to fail.
🏆It has always been that simple.
❤️Good luck with your trading journey, I shall see you at the very top.
🎯Trade consistent, FRGNT X
GBP/USD Breakout (28.05.2025)The GBP/USD Pair on the M30 timeframe presents a Potential Selling Opportunity due to a recent Formation of a Breakout Pattern. This suggests a shift in momentum towards the downside in the coming hours.
Possible Short Trade:
Entry: Consider Entering A Short Position around Trendline Of The Pattern.
Target Levels:
1st Support – 1.3424
2nd Support – 1.3380
🎁 Please hit the like button and
🎁 Leave a comment to support for My Post !
Your likes and comments are incredibly motivating and will encourage me to share more analysis with you.
Best Regards, KABHI_TA_TRADING
Thank you.
Disclosure: I am part of Trade Nation's Influencer program and receive a monthly fee for using their TradingView charts in my analysis.

Bullish continuation?GBP/USD is falling towards the support level which is an overlap support that is slightly above the 50% Fibonacci retracement and could bounce from this level to our take profit.
Entry: 1.3395
Why we like it:
There is an overlap support level that is slightly above the 50% Fibonacci retracement.
Stop loss: 1.3304
Why we like it:
There is a pullback support level that aligns with the 61.8% Fibonacci retracement.
Take profit: 1.3581
Why we like it:
There is a pullback support level.
Enjoying your TradingView experience? Review us!
Please be advised that the information presented on TradingView is provided to Vantage (‘Vantage Global Limited’, ‘we’) by a third-party provider (‘Everest Fortune Group’). Please be reminded that you are solely responsible for the trading decisions on your account. There is a very high degree of risk involved in trading. Any information and/or content is intended entirely for research, educational and informational purposes only and does not constitute investment or consultation advice or investment strategy. The information is not tailored to the investment needs of any specific person and therefore does not involve a consideration of any of the investment objectives, financial situation or needs of any viewer that may receive it. Kindly also note that past performance is not a reliable indicator of future results. Actual results may differ materially from those anticipated in forward-looking or past performance statements. We assume no liability as to the accuracy or completeness of any of the information and/or content provided herein and the Company cannot be held responsible for any omission, mistake nor for any loss or damage including without limitation to any loss of profit which may arise from reliance on any information supplied by Everest Fortune Group.

Bullish bounce?The Cable (GBP/USD) is falling towards the pivot which is an overlap support and could bounce to the 1st resistance.
Pivot: 1.3395
1st Support: 1.3317
1st Resistance: 1.3583
Risk Warning:
Trading Forex and CFDs carries a high level of risk to your capital and you should only trade with money you can afford to lose. Trading Forex and CFDs may not be suitable for all investors, so please ensure that you fully understand the risks involved and seek independent advice if necessary.
Disclaimer:
The above opinions given constitute general market commentary, and do not constitute the opinion or advice of IC Markets or any form of personal or investment advice.
Any opinions, news, research, analyses, prices, other information, or links to third-party sites contained on this website are provided on an "as-is" basis, are intended only to be informative, is not an advice nor a recommendation, nor research, or a record of our trading prices, or an offer of, or solicitation for a transaction in any financial instrument and thus should not be treated as such. The information provided does not involve any specific investment objectives, financial situation and needs of any specific person who may receive it. Please be aware, that past performance is not a reliable indicator of future performance and/or results. Past Performance or Forward-looking scenarios based upon the reasonable beliefs of the third-party provider are not a guarantee of future performance. Actual results may differ materially from those anticipated in forward-looking or past performance statements. IC Markets makes no representation or warranty and assumes no liability as to the accuracy or completeness of the information provided, nor any loss arising from any investment based on a recommendation, forecast or any information supplied by any third-party.
Double Top Alert: Key Resistance at 1.3570 Before US PCE DataGBPUSD PLAN – MAY 27 | Double Top Alert: Key Resistance at 1.3570 Before US PCE Data
GBPUSD is currently testing a critical resistance zone near 1.3570, forming a potential Double Top pattern. As markets await this week’s US Core PCE inflation release, the pair may be at risk of a short-term pullback.
🌍 MACRO FUNDAMENTALS
USD Rebounds Slightly ahead of April’s PCE inflation report – a key Fed inflation gauge due this Friday.
GBP Under Pressure as dovish tones from Bank of England (BoE) officials signal a potential pause in rate hikes.
UK Political Uncertainty and sluggish EU-UK trade talks continue to dampen investor confidence in the pound.
📊 TECHNICAL ANALYSIS
Price Structure: GBPUSD surged from 1.3446 support but is now facing resistance near 1.3570, where a Double Top formation is emerging.
Key Levels:
Resistance: 1.3570 – 1.3580 (previous high and psychological barrier)
Support 1: 1.3496 (confluence of EMA89 and 38.2% Fibonacci retracement)
Support 2: 1.3446
Indicators:
EMA13, EMA34 show early signs of bearish crossover on the 30-minute chart.
RSI approaches overbought territory, hinting at potential bearish divergence.
🎯 TRADE SETUP (IF PRICE REJECTS 1.3570)
🔻 SELL SETUP
Entry: 1.3570 – 1.3550
Stop-Loss: 1.3595
Take-Profit Targets:
TP1: 1.3496
TP2: 1.3446
📌 A bullish breakout only becomes valid if price closes strongly above 1.3590 on the H1 chart.
🧠 STRATEGIC NOTES
Wait for a clear reaction or bearish confirmation near 1.3570 before entering trades.
Avoid chasing trades mid-range; focus on clean breakouts or rejections.
PCE data may trigger volatility — manage risk tightly and prepare for directional momentum.
👉 What do you think of this Double Top scenario? Will GBPUSD reject or break through resistance? Drop your analysis below and follow for daily structured plans!

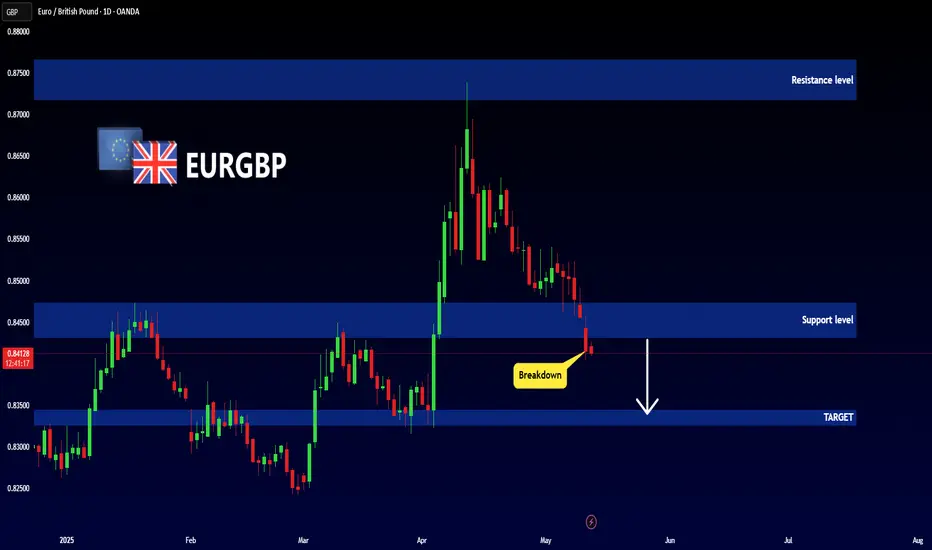
EURGBP - NEW BREAKDOWNHello Traders !
The EURGBP reached the resistance level (0.87176 - 0.87660) and failed to break it !
The price broke the support level (0.84736 - 0.84322).
So, I expect a bearish move📉
______________
TARGET: 0.83450🎯
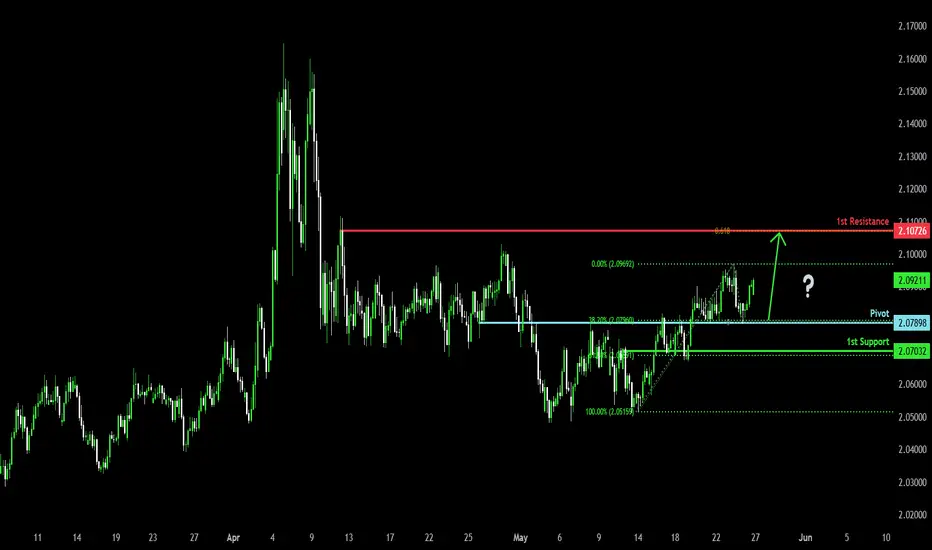
Potential bullish rise?GBP/AUD has bounced off the pivot, which acts as an overlap support and could rise to the 1st resistance, which lines up with the 61.8% Fibonacci projection.
Pivot: 2.0789
1st Support: 2.0703
1st Resistance: 2.1072
Risk Warning:
Trading Forex and CFDs carries a high level of risk to your capital and you should only trade with money you can afford to lose. Trading Forex and CFDs may not be suitable for all investors, so please ensure that you fully understand the risks involved and seek independent advice if necessary.
Disclaimer:
The above opinions given constitute general market commentary, and do not constitute the opinion or advice of IC Markets or any form of personal or investment advice.
Any opinions, news, research, analyses, prices, other information, or links to third-party sites contained on this website are provided on an "as-is" basis, are intended only to be informative, is not an advice nor a recommendation, nor research, or a record of our trading prices, or an offer of, or solicitation for a transaction in any financial instrument and thus should not be treated as such. The information provided does not involve any specific investment objectives, financial situation and needs of any specific person who may receive it. Please be aware, that past performance is not a reliable indicator of future performance and/or results. Past Performance or Forward-looking scenarios based upon the reasonable beliefs of the third-party provider are not a guarantee of future performance. Actual results may differ materially from those anticipated in forward-looking or past performance statements. IC Markets makes no representation or warranty and assumes no liability as to the accuracy or completeness of the information provided, nor any loss arising from any investment based on a recommendation, forecast or any information supplied by any third-party.