GBP CHF BUY (POUND STERLING - SWISS FRANC)Hi there.
Price is forming a reversal pattern to change its direction.
Watch strong price action at the current levels for buy.
GBP-CHF

GBPCHF will test the weekly support? 🦐GBPCHF on the 4h chart is moving inside a descending channel.
The market is testing now the support area at 1.25900 and according to Plancton's strategy if the price will break below we will set a nice short order.
--––
Follow the Shrimp 🦐
Keep in mind.
🟣 Purple structure -> Monthly structure.
🔴 Red structure -> Weekly structure.
🔵 Blue structure -> Daily structure.
🟡 Yellow structure -> 4h structure.
⚫️ Black structure -> <4h structure.
Here is the Plancton0618 technical analysis , please comment below if you have any question.
The ENTRY in the market will be taken only if the condition of the Plancton0618 strategy will trigger.
Leave a comment that is helpful or encouraging. Let's master the markets together
GBPCHF a bear trap 🦐GBPCHF after a few tests of the support area attempt to break below creating a bear trap with a false breakout.
The price is now moving in a bullish price action and according to Plancton's strategy if the market will break above the resistance area we will set a nice long order according to Plancton's strategy.
--––
Follow the Shrimp 🦐
Keep in mind.
🟣 Purple structure -> Monthly structure.
🔴 Red structure -> Weekly structure.
🔵 Blue structure -> Daily structure.
🟡 Yellow structure -> 4h structure.
⚫️ Black structure -> <4h structure.
Here is the Plancton0618 technical analysis , please comment below if you have any question.
The ENTRY in the market will be taken only if the condition of the Plancton0618 strategy will trigger.
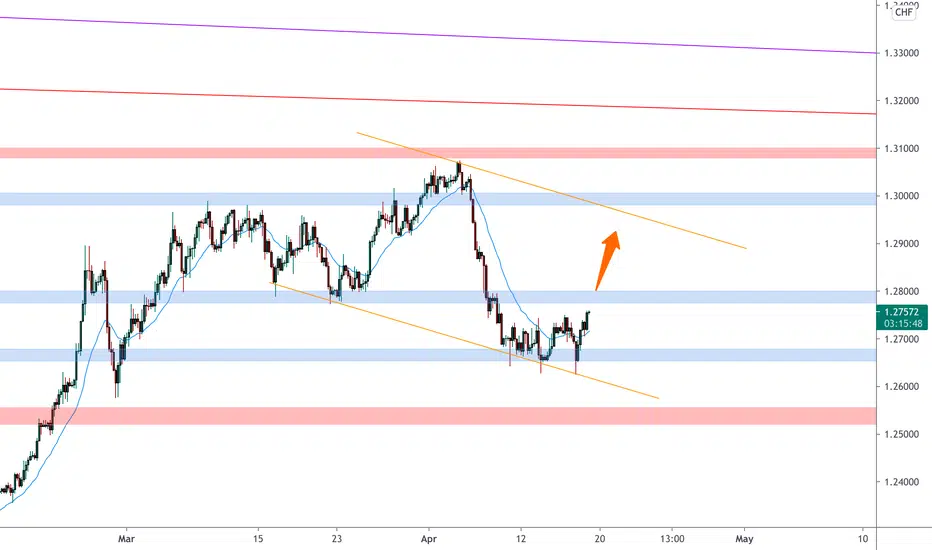
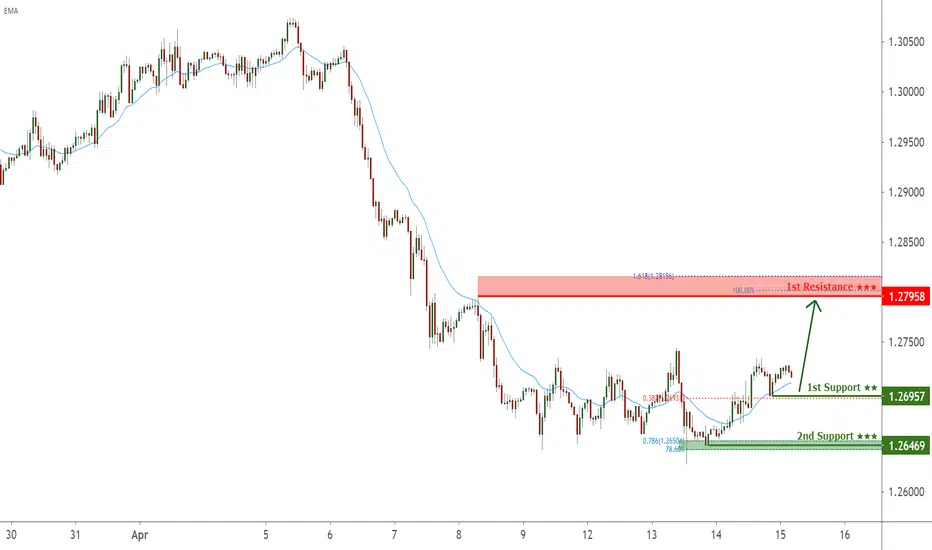
GBPCHF facing bullish pressure, potential for bounce!Prices are facing bullish pressure from ascending trendline support and horizontal swing low support in line with 61.8% Fibonacci retracement and 61.8% Fibonacci extension. Prices might push up towards 1st resistance in line with horizontal swing high resistance, 100% Fibonacci extension, and -61.8% Fibonacci retracement. If prices fall through 1st support, prices might take support from 2nd support which is a horizontal swing low support, in line with 50% Fibonacci retracement and 127.2% Fibonacci extension. EMA is also below prices, showing a bullish pressure for prices.

GBPCHF - DAY TRADE VIEWGBPCHF - Momentum is in favour of buyers & as per the trend analysis, technical indicators it's a good buy.
My approach will be a buy here at current price 1.27700
Maintain stop loss around 1.27050
Potential upside 1.28600 - 1.29300
Trade as per your risk appetite, I will be glad to see your likes & comment.
Why you should follow this tradingview account ?
Managed by top most renowned trader - Pulak Priyesh
10 + years of trading experience
Professional Day trader
Excellence award winning mentor
Professional chart, clear chart without junks.
Major S/R levels with inner insights
Frequent Day & Swing trade levels
All major and minor FX/INDICES covered. Thanks

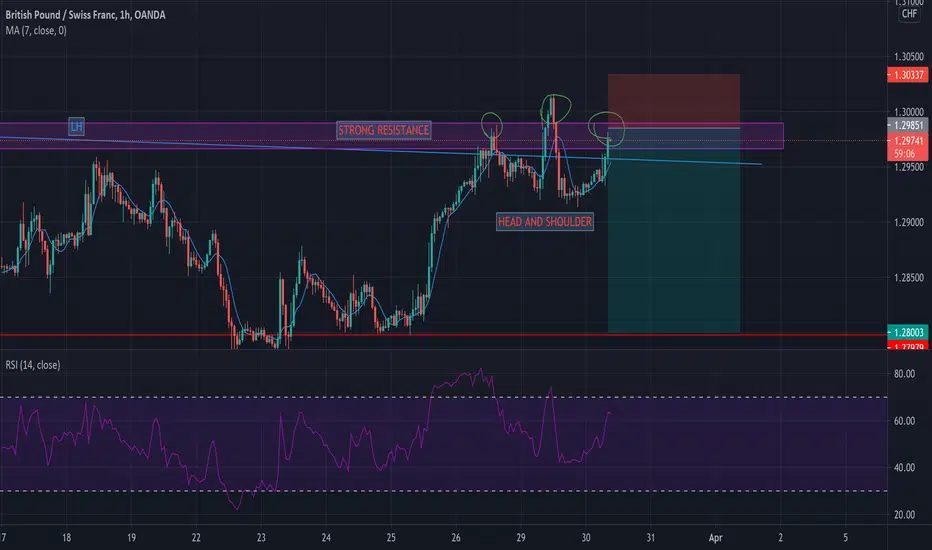
GBPCHF - PERFECT RETESTGBPCHF has created a perfect retest where we can see heavy bearish price action. For confirmation, wait for the ascending trendline to break and enter with stops above the correction.
Goodluck and trade safe!
GBPCHF - PERFECT RETESTGBPCHF has created a perfect retest where we can see heavy bearish price action. For confirmation, wait for the ascending trendline to break and enter with stops above the correction.
Goodluck and trade safe!
GBPCHF on a bullish move 🦐GBPCHF after the test of the weekly resistance at the 1.31 area has bounced over the lower trendline of the a descending channel.
The price is moving for a test of the resistance structure and according to Plancton's strategy if the price will break above we will set a nice long order opportunity.
--––
Follow the Shrimp 🦐
Keep in mind.
🟣 Purple structure -> Monthly structure.
🔴 Red structure -> Weekly structure.
🔵 Blue structure -> Daily structure.
🟡 Yellow structure -> 4h structure.
⚫️ Black structure -> <4h structure.
Here is the Plancton0618 technical analysis , please comment below if you have any question.
The ENTRY in the market will be taken only if the condition of the Plancton0618 strategy will trigger.
Likely to short this ,in a range now on h4....
If you like my analysis and it helped you ,do give me a thumbs ups on tradingview! 🙏
And if you would like to show further support for me, you can gift me some coins on tradingview! 😁
Thank you!
Disclaimers:
The analysis shared through this channel are purely for educational and entertainment purposes only. They are by no means professional advice for individual/s to enter trades for investment or trading purposes.
The author/producer of these content shall not and will not be responsible for any form of financial/physical/assets losses incurred from trades executed from the derived conclusion of the individual from these content shared.
Thank you, and please do your due diligence before any putting on any trades!
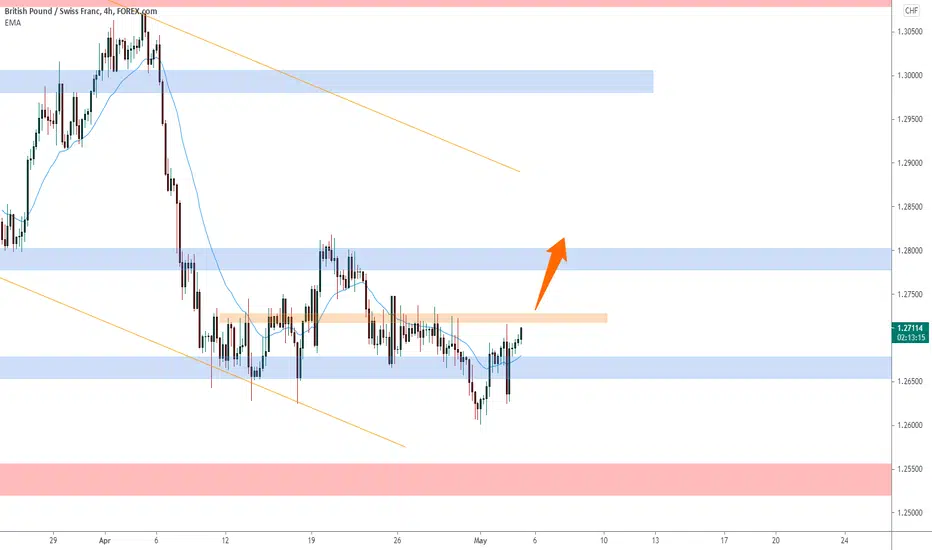
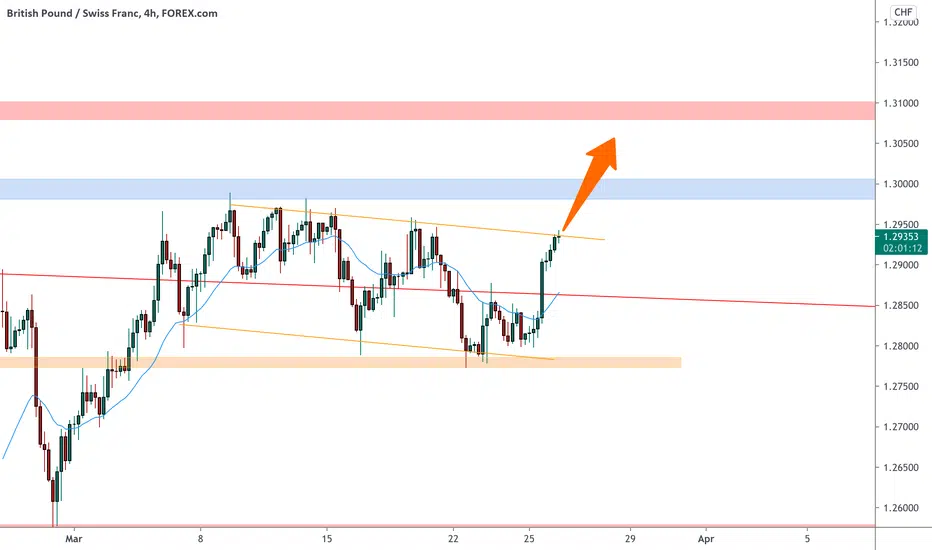
Potential Buy for GBP/CHF !As you the price has broken out the descending trend and now after a correction it is time to go Long!
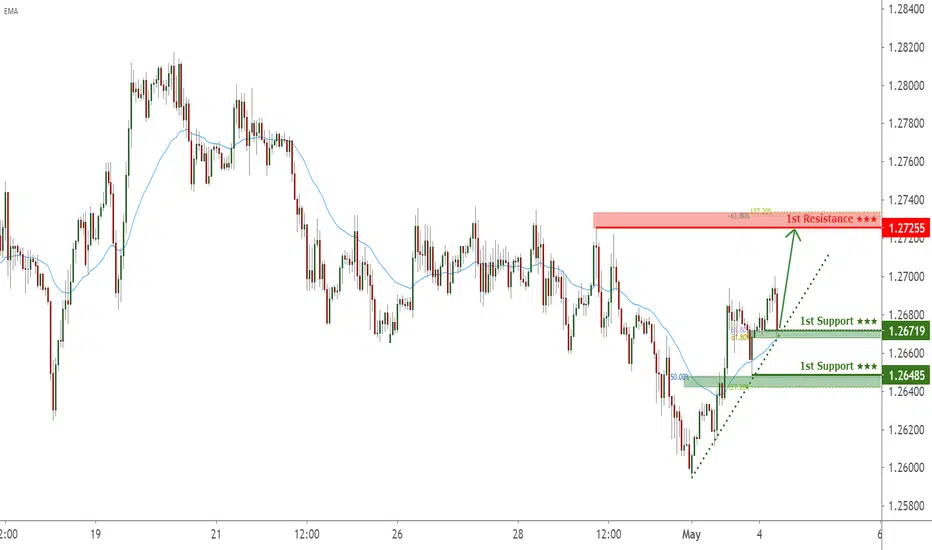
GBPCHF facing bullish pressure, potential for further upside!Prices are facing bullish pressure from horizontal swing low support, which is in line with 38.2% Fibonacci retracement. Prices might push up further to horizontal swing high resistance which is in line with 161.8% Fibonacci retracement and 100% Fibonacci extension. If prices push down further, prices might take support from 2nd support which is a horizontal swing low support in line with 78.6% Fibonacci extension and 78.6% Fibonacci retracement. EMA is also below prices showing a bullish pressure for prices.
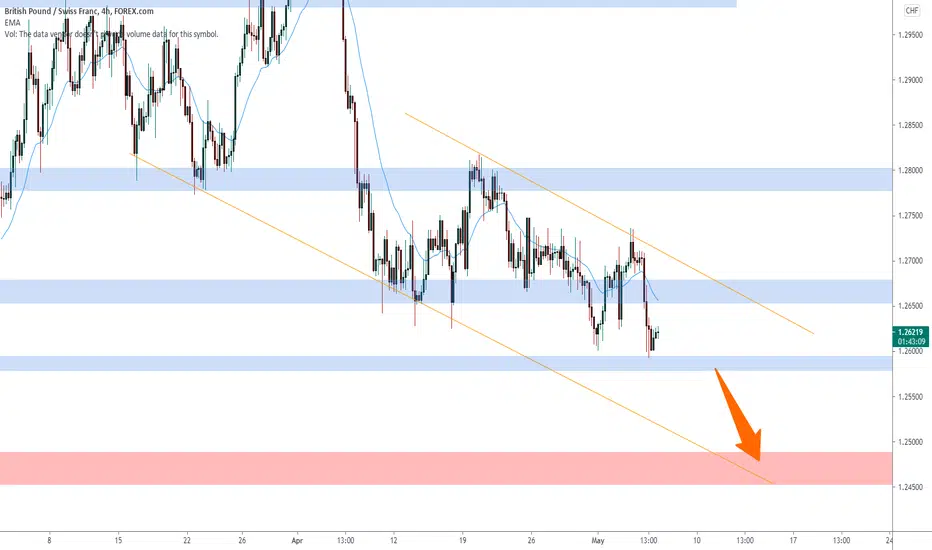
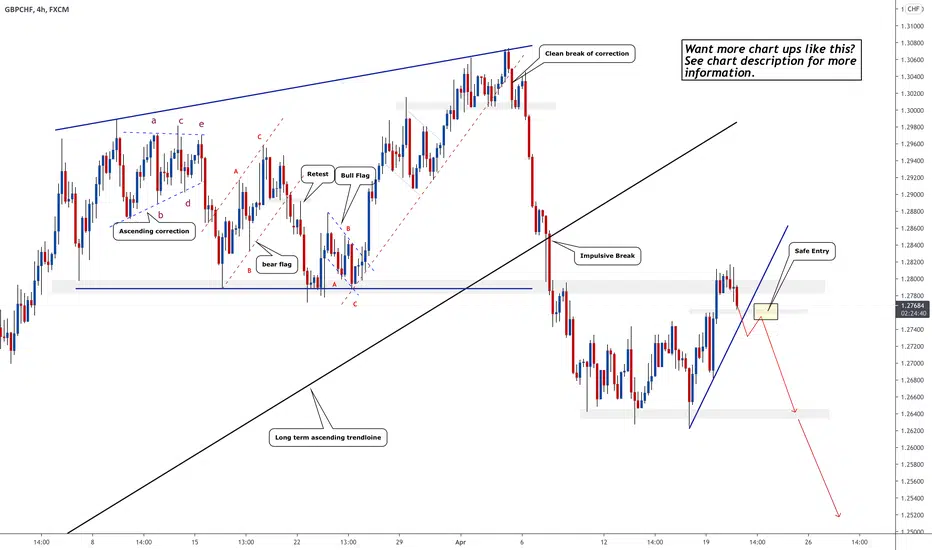
GBPCHF - Bear Run Started?GBPCHF could be on the verge of a bear run. But first, we require a break of the zone indicated and the long term ascending trendline.
Wait for an impulsive break and the bearish correction before getting in. We're anticipating GBP weakness overall.
Goodluck and trade safe!
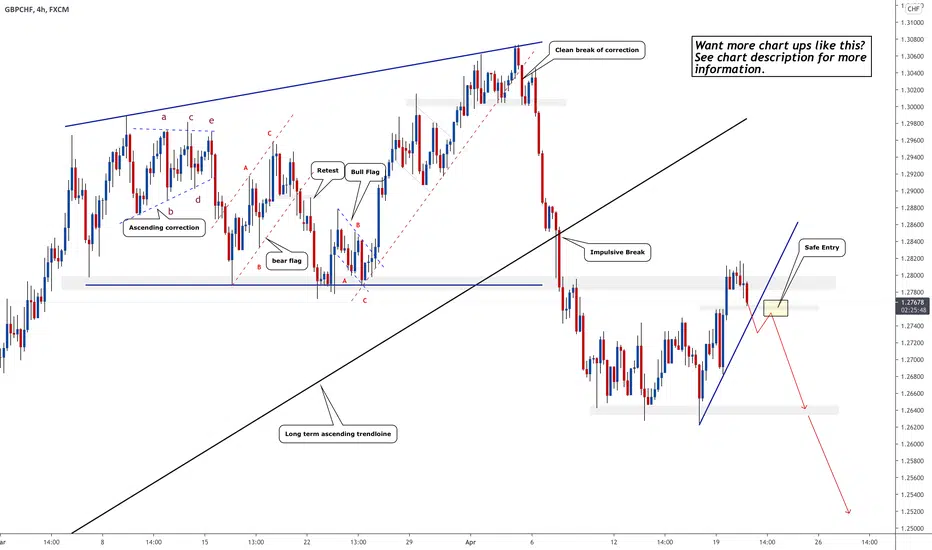


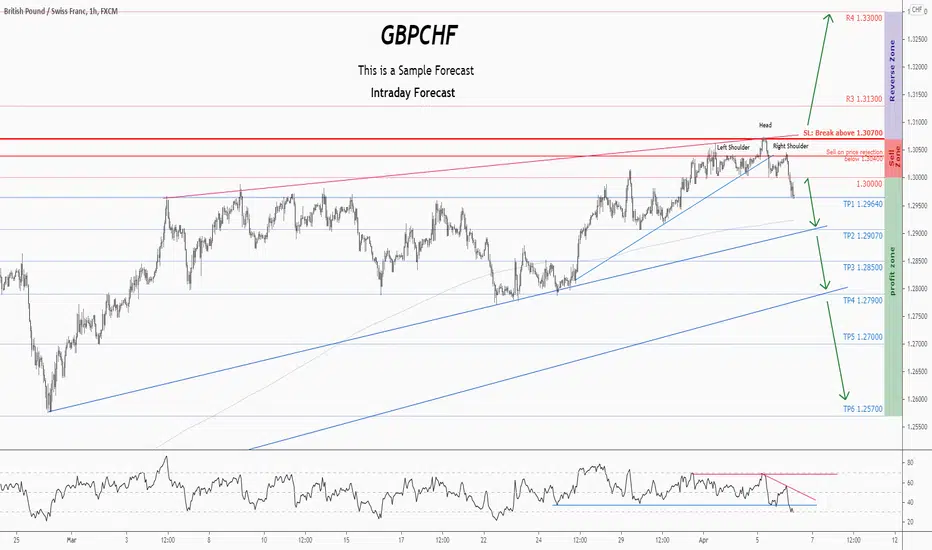
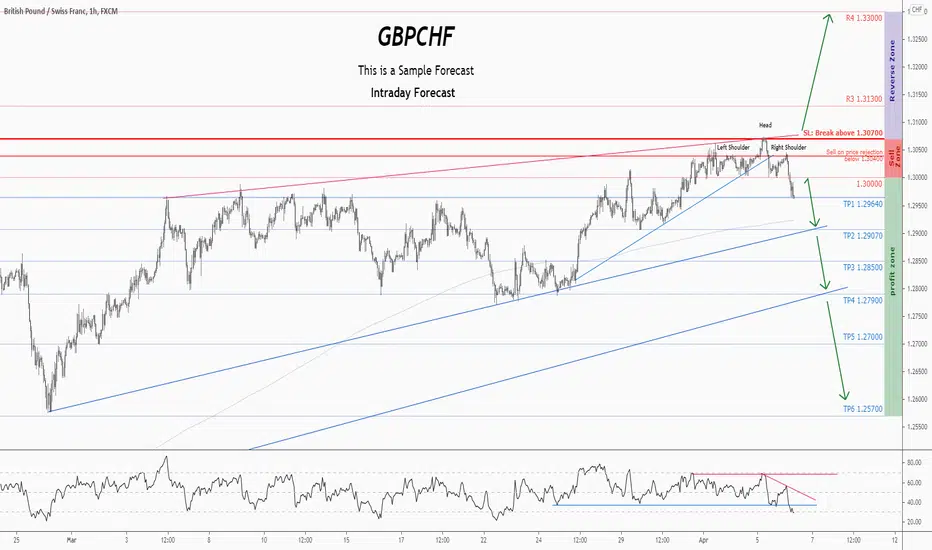
💡Don't miss the great sell opportunity in GBPCHFTrading suggestion:
". There is still a possibility of temporary retracement to suggested resistance line (1.30000).
if so, traders can set orders based on Price Action and expect to reach short-term targets."
Technical analysis:
. GBPCHF is in a range bound and the beginning of downtrend is expected.
. The price is above the 21-Day WEMA which acts as a dynamic support.
. The RSI is at 30.
Take Profits:
TP1= @ 1.29640
TP2= @ 1.29070
TP3= @ 1.28500
TP4= @ 1.27900
TP5= @ 1.27000
TP6= @ 1.25700
SL: Break Above R2
❤️ If you find this helpful and want more FREE forecasts in TradingView
. . . . . Please show your support back,
. . . . . . . . Hit the 👍 LIKE button,
. . . . . . . . . . . Drop some feedback below in the comment!
❤️ Your Support is very much 🙏 appreciated!❤️
💎 Want us to help you become a better Forex trader?
Now, It's your turn!
Be sure to leave a comment let us know how you see this opportunity and forecast.
Trade well, ❤️
ForecastCity English Support Team ❤️
💡Don't miss the great sell opportunity in GBPCHFTrading suggestion:
". There is still a possibility of temporary retracement to suggested resistance line (1.30000).
if so, traders can set orders based on Price Action and expect to reach short-term targets."
Technical analysis:
. GBPCHF is in a range bound and the beginning of downtrend is expected.
. The price is above the 21-Day WEMA which acts as a dynamic support.
. The RSI is at 29.
Take Profits:
TP1= @ 1.29640
TP2= @ 1.29070
TP3= @ 1.28500
TP4= @ 1.27900
TP5= @ 1.27000
TP6= @ 1.25700
SL: Break Above R2
❤️ If you find this helpful and want more FREE forecasts in TradingView
. . . . . Please show your support back,
. . . . . . . . Hit the 👍 LIKE button,
. . . . . . . . . . . Drop some feedback below in the comment!
❤️ Your Support is very much 🙏 appreciated!❤️
💎 Want us to help you become a better Forex trader?
Now, It's your turn!
Be sure to leave a comment let us know how you see this opportunity and forecast.
Trade well, ❤️
ForecastCity English Support Team ❤️
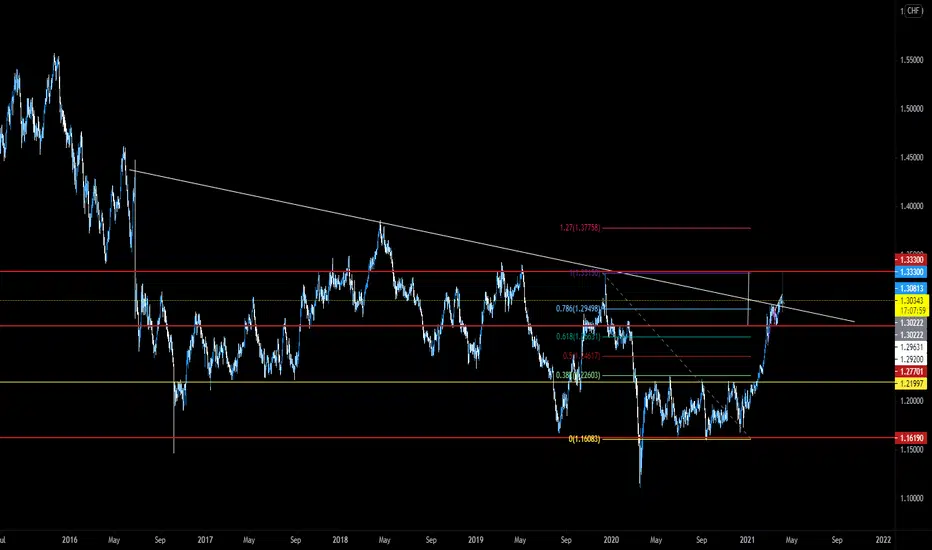
GBPCHF BULLS a multi year trend line was broken ,price is currenlty at retest level 1.30. am expecting it to move all the way up to 1.38-40
GBPCHF will break above? 🦐GBPCHF is moving inside a descending channel.
The market is now testing the upper trendline after the tet of the support area.
According to Plancton strategy if the market will break above we will set a nice long order.
--––
Follow the Shrimp 🦐
Keep in mind.
🟣 Purple structure -> Monthly structure.
🔴 Red structure -> Weekly structure.
🔵 Blue structure -> Daily structure.
🟡 Yellow structure -> 4h structure.
⚫️ Black structure -> <4h structure.
Here is the Plancton0618 technical analysis , please comment below if you have any question.
The ENTRY in the market will be taken only if the condition of the Plancton0618 strategy will trigger.
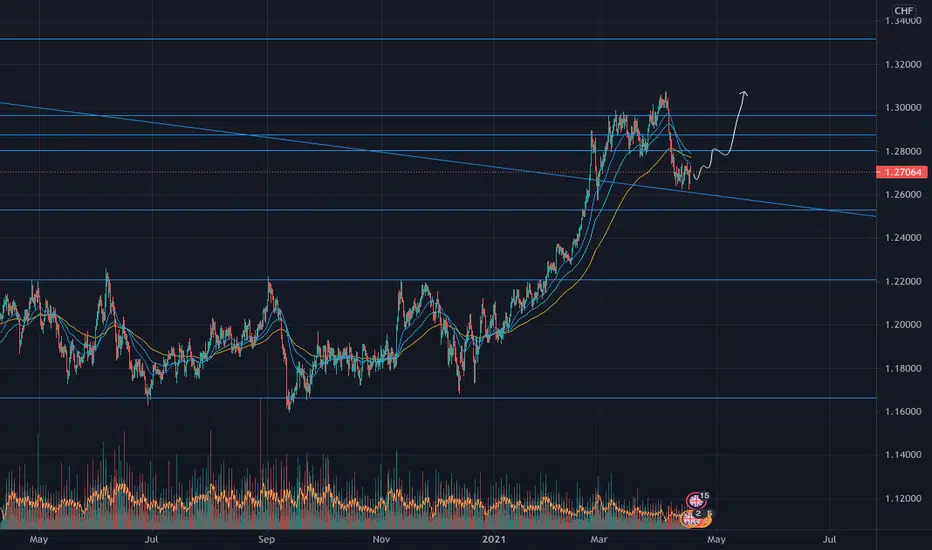
GBPCHF: Be Prepared For The Next Swing Move
GBPCHF is currently consolidating in a local horizontal trading range.
Taking into consideration that the pair is trading in a long term bullish trend,
chances are high that at some moment the market will start growing again.
To catch the next wave, wait for a breakout of the underlined horizontal resistance.
It will be your trigger to catch a trend following trade.
Next goal will be 1.315
Please, support my work with like and comment!

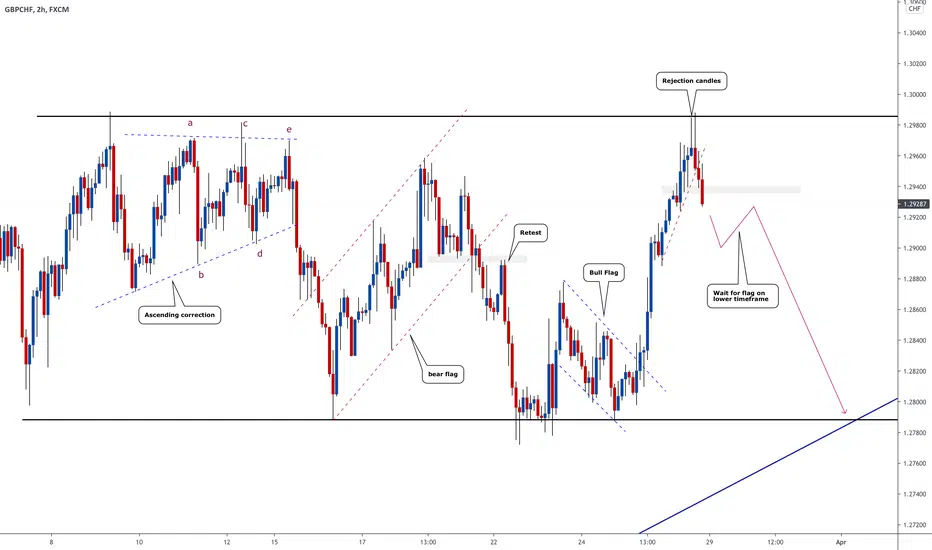
GBPCHF - Short Term SellsThis pair has been making clear flags and has been abiding by the basic rules of trading patterns.
Wait for a flag on the lower timeframe and enter on the break of flag. See below for bigger timeframe analysis.
Goodluck and trade safe!