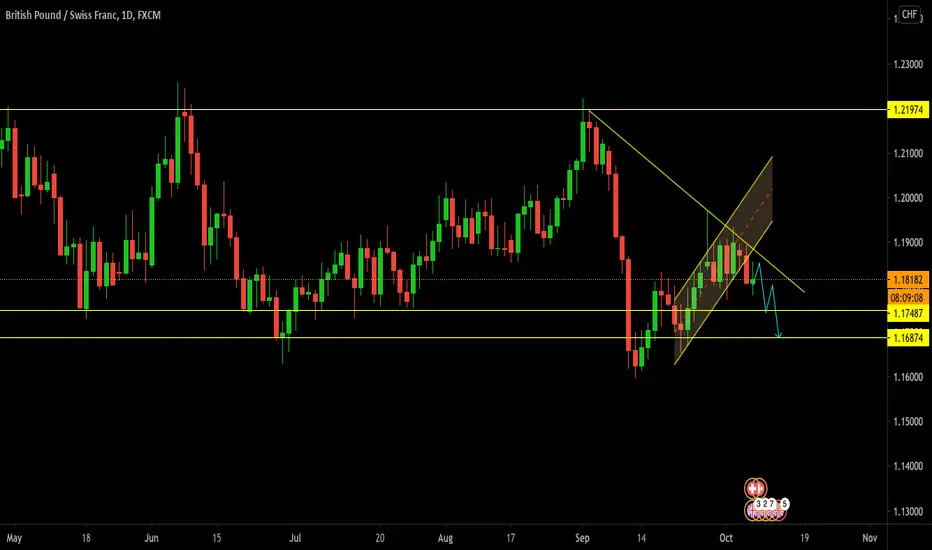
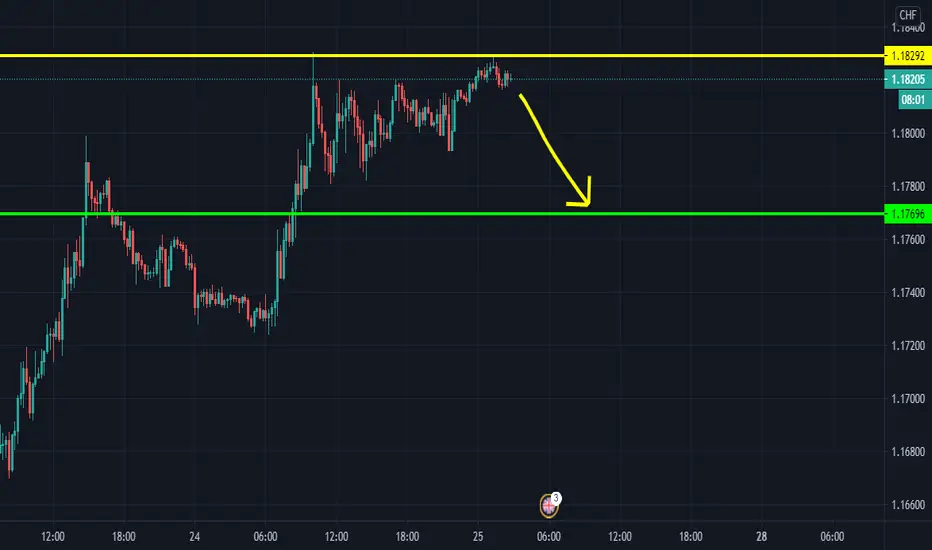
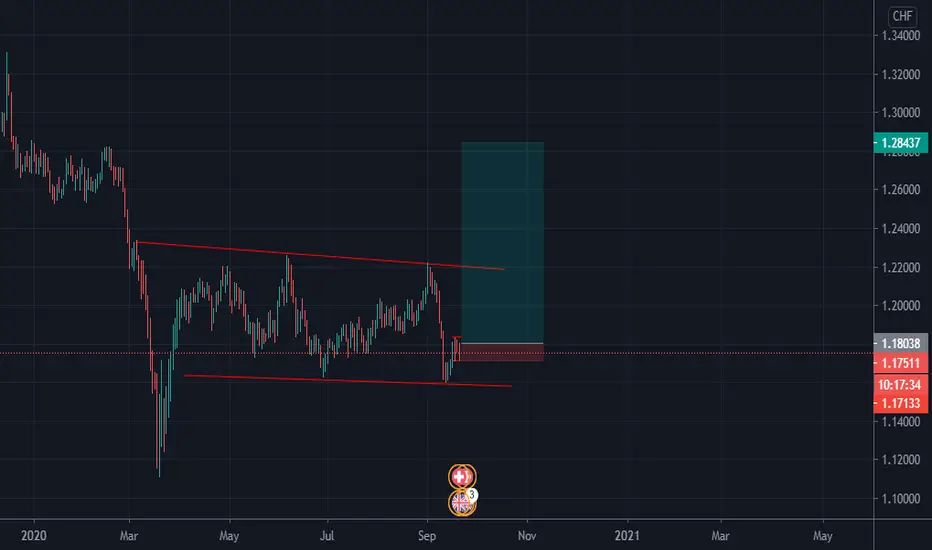
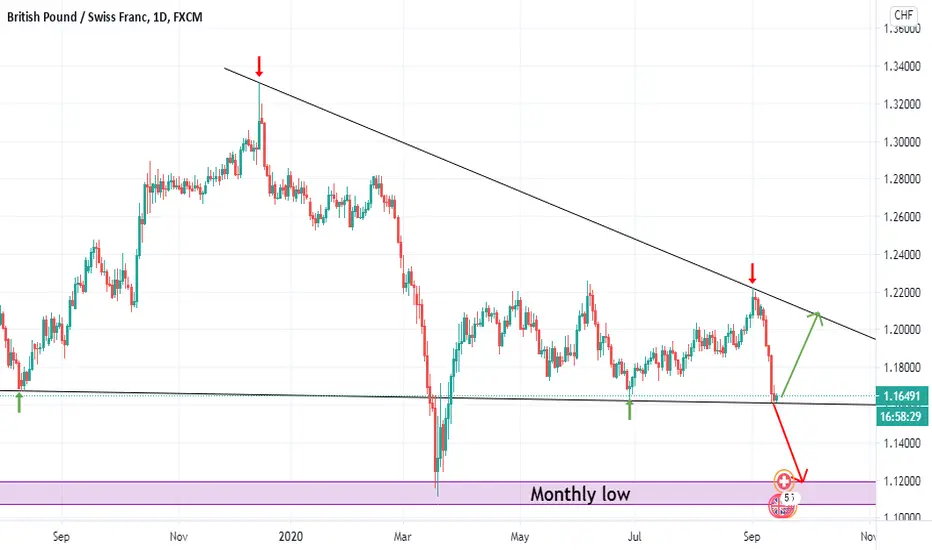
GBPCHF - ROAD MAP EXPECTED MOVE GBPCHF - Parallel channel breakdown is there on the daily chart, expected move is in the downtrend.
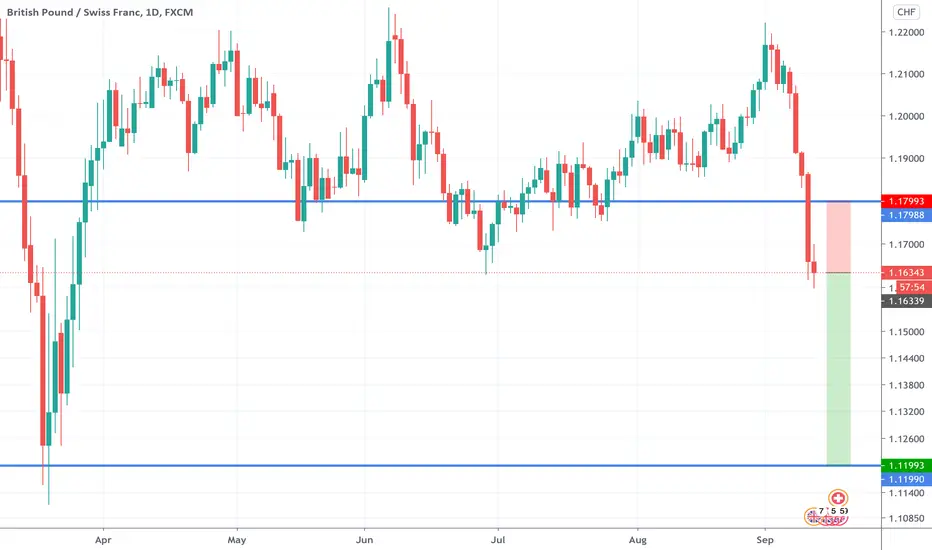
My approach will be a sell position in the range 1.18220 - 1.18450
Maintain stop loss around 1.19350
Potential downside target 1.16870
Follow the levels as mentioned
Traders, if you liked this idea hit the like button & write in the comment section.
Why you should follow this tradingview account ?
Managed by top most renowned trader - Pulak Priyesh
10 + years of trading experience
Professional Day trader
Excellence award winning mentor
Professional chart, clear chart without junks.
Major S/R levels with inner insights
Frequent Day & Swing trade levels
All major and minor FX/INDICES covered
Thanks !!
GBP-CHF
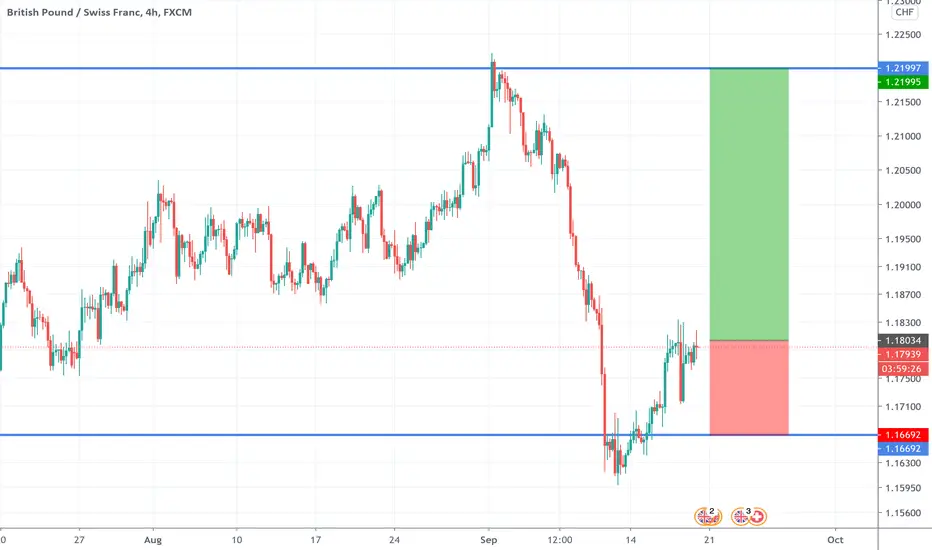
GBPCHF on a break of the resistance 🦐GBPCHF on the daily chart after hitting weekly support at 1.16500 is consolidating below a resistance level at 1.19 level.
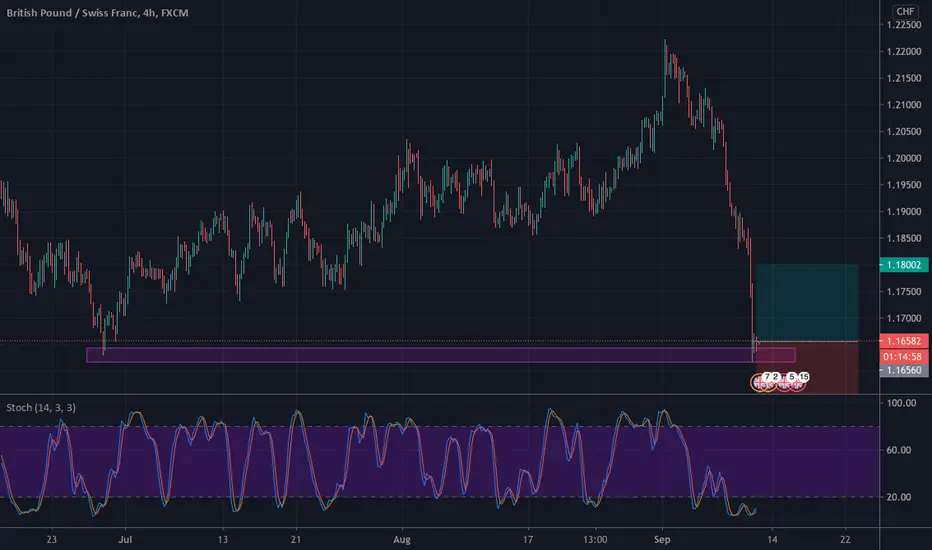
On the 4h chart the price found a minor support at the 1.18 area.
IF the market will break and close above the daily structure we can set a nice long order according to Plancton's strategy.
–––––
Follow the Shrimp 🦐
Here is the Plancton0618 technical analysis, please comment below if you have any question.
The ENTRY in the market will be taken only if the condition of Plancton0618 strategy will trigger.


Don't miss the great buy opportunity in GBPCHFTrading suggestion:
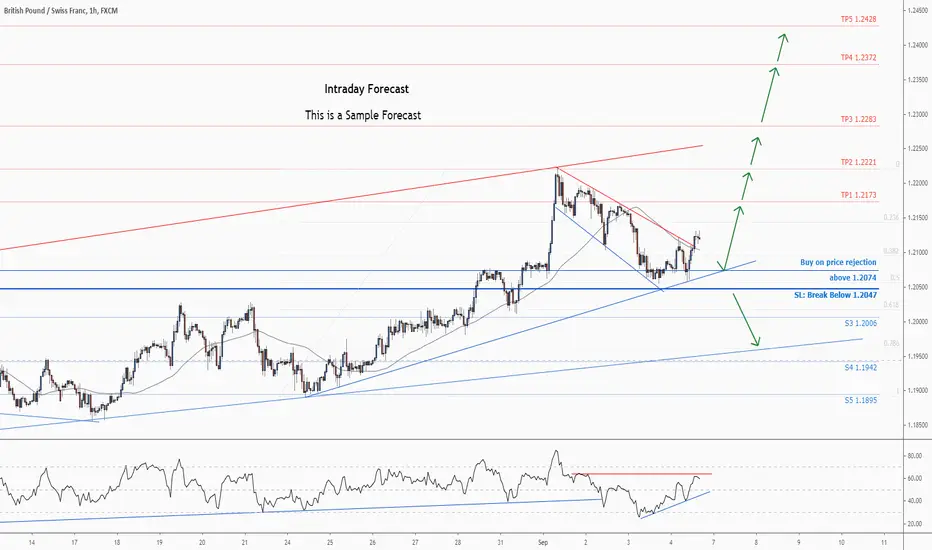
". There is a possibility of temporary retracement to suggested support line (1.2074).
. if so, traders can set orders based on Price Action and expect to reach short-term targets."
Technical analysis:
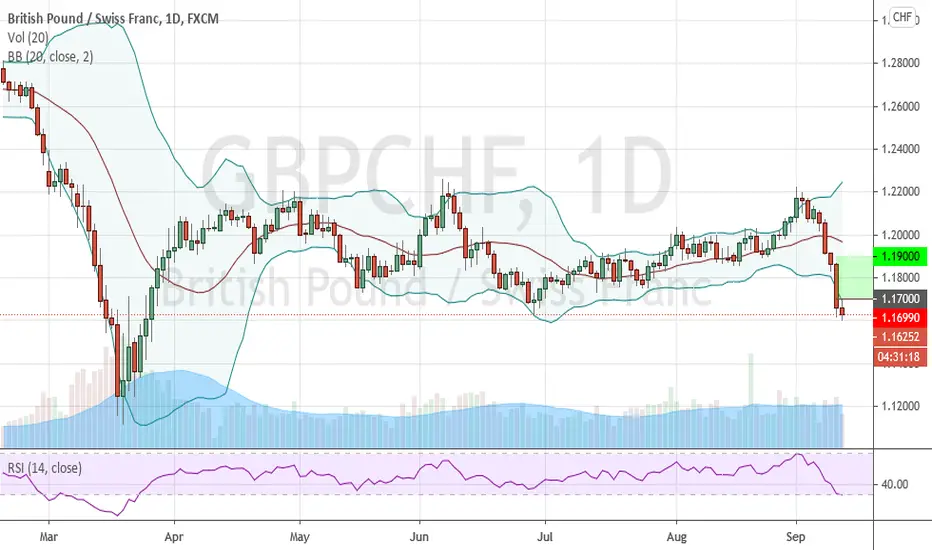
. GBPCHF is in a range bound and the beginning of uptrend is expected.
. The price is above the 21-Day WEMA which acts as a dynamic support.
. The RSI is at 60.
Take Profits:
TP1= @ 1.2173
TP2= @ 1.2221
TP3= @ 1.2283
TP4= @ 1.2372
TP5= @ 1.2428
SL= Break below 1.2047
❤️ If you find this helpful and want more FREE forecasts in TradingView
. . . . . Please show your support back,
. . . . . . . . Hit the 👍 LIKE button,
. . . . . . . . . . Drop some feedback below in the comment!
❤️ Your Support is very much 🙏 appreciated! ❤️
💎 Want us to help you become a better Forex trader ?
Now, It's your turn !
Be sure to leave a comment let us know how do you see this opportunity and forecast.
Trade well, ❤️
ForecastCity English Support Team ❤️
Weekend Chart Mark-up's : GBP CHFIf you are looking for a buy or a sell I feel price will use these prior zones to find its way through structure in price movement .

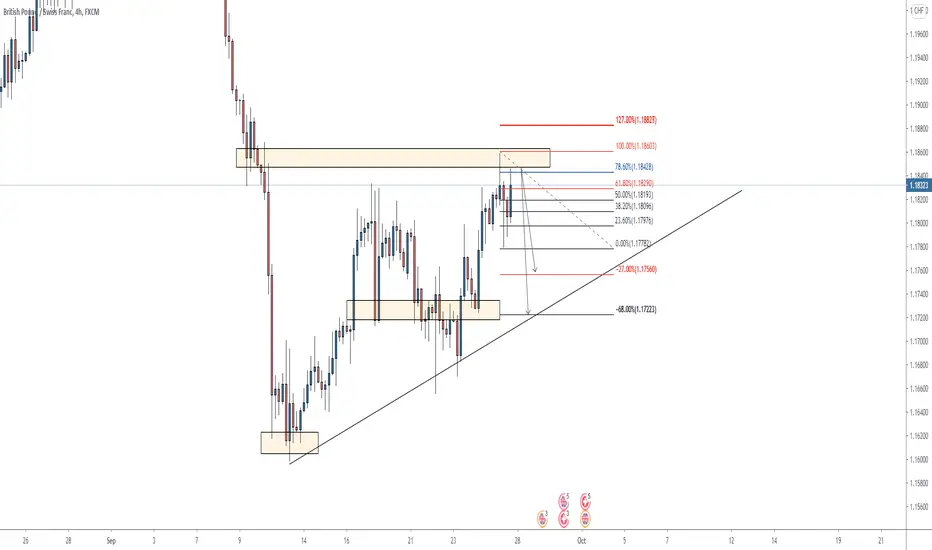
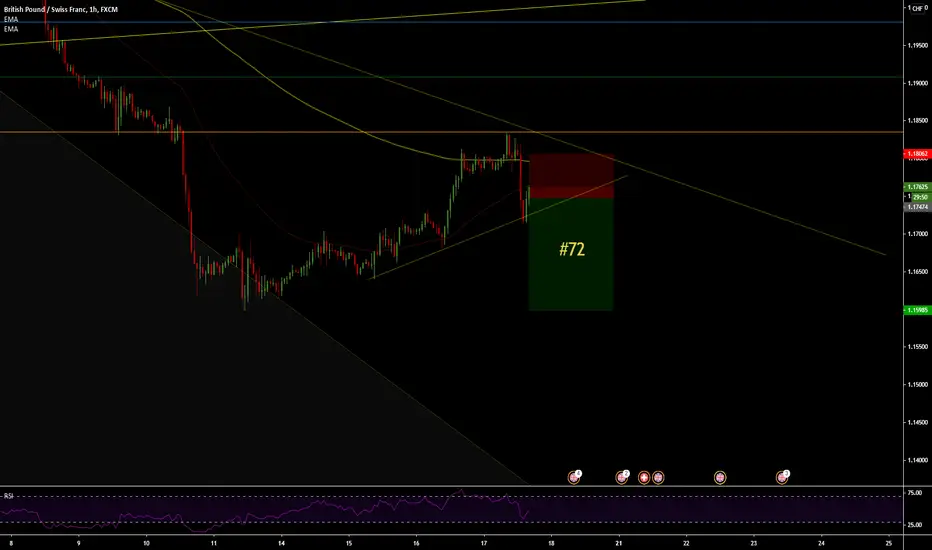
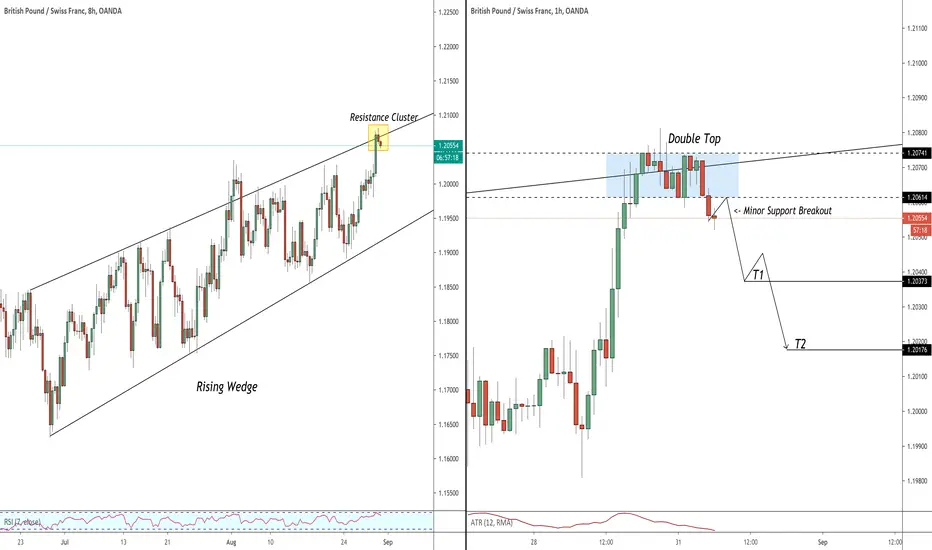
GBPCHF: How To Catch a Pullback?
good morning, guys
GBPCHF reached a strong resistance of a rising wedge pattern.
taking into consideration oversold rsi with divergence on 8h/4h charts
and a double top formation with a confirmed violation of its minor support on 1h,
chances are high that the price will retrace.
to catch a bearish movement you can sell the retest of broken support or just enter aggressively depending on the desired r/r.
targets:
1.2037
1.2017
stop above the tops
good luck!
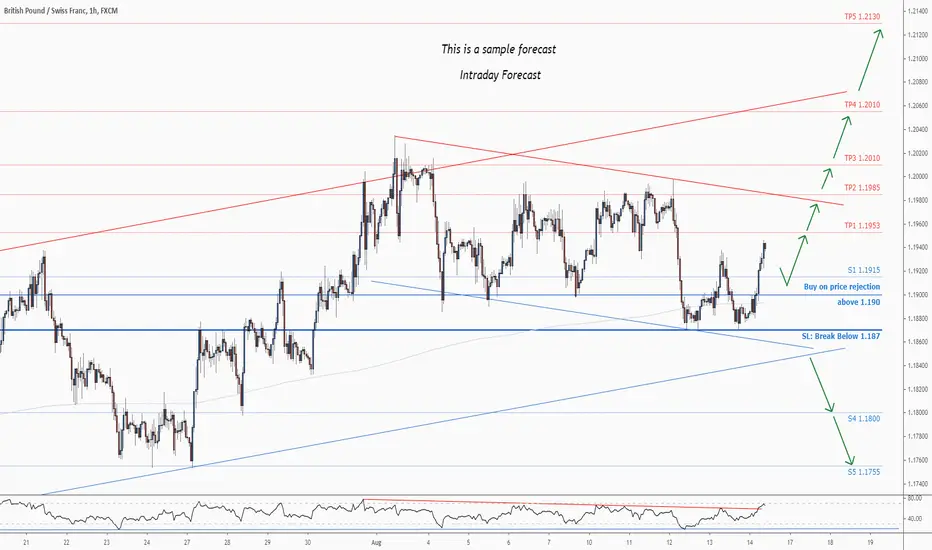
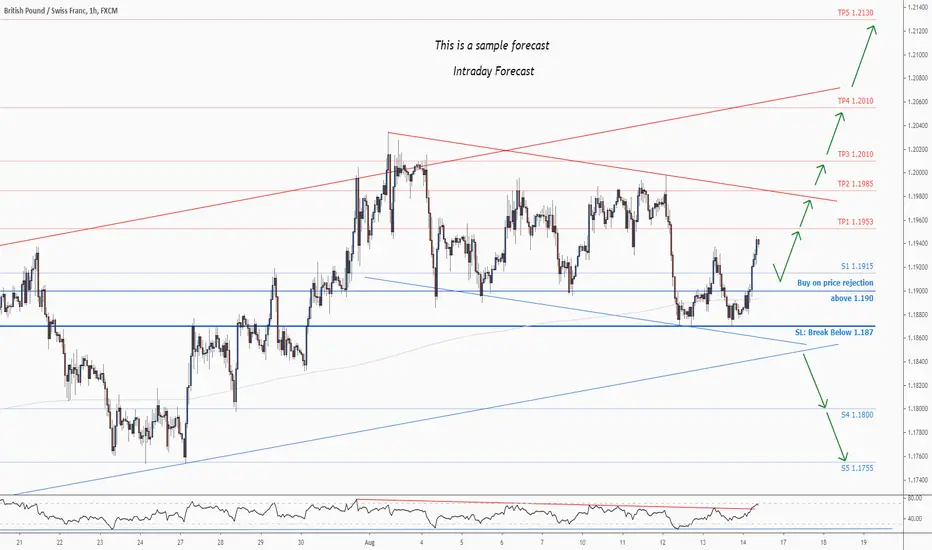
Don't miss the great buy opportunity in GBPCHFTrading suggestion:
. There is a possibility of temporary retracement to suggested support line (1.19). if so, traders can set orders based on Price Action and expect to reach short-term targets.
Technical analysis:
. GBPCHF is in a range bound and the beginning of uptrend is expected.
.The price is above the 21-Day WEMA which acts as a dynamic support.
. The RSI is at 41.
Take Profits:
TP1= @ 1.1953
TP2= @ 1.1985
TP3= @ 1.2010
TP4= @ 1.2055
TP5= @ 1.2130
SL= Break below S3
❤️ If you find this helpful and want more FREE forecasts in TradingView
. . . . . Please show your support back,
. . . . . . . . Hit the 👍 LIKE button,
. . . . . . . . . . . Drop some feedback below in the comment!
❤️ Your Support is very much 🙏 appreciated! ❤️
💎 Want us to help you become a better Forex trader ?
Now, It's your turn !
Be sure to leave a comment let us know how do you see this opportunity and forecast.
Trade well, ❤️
ForecastCity English Support Team ❤️


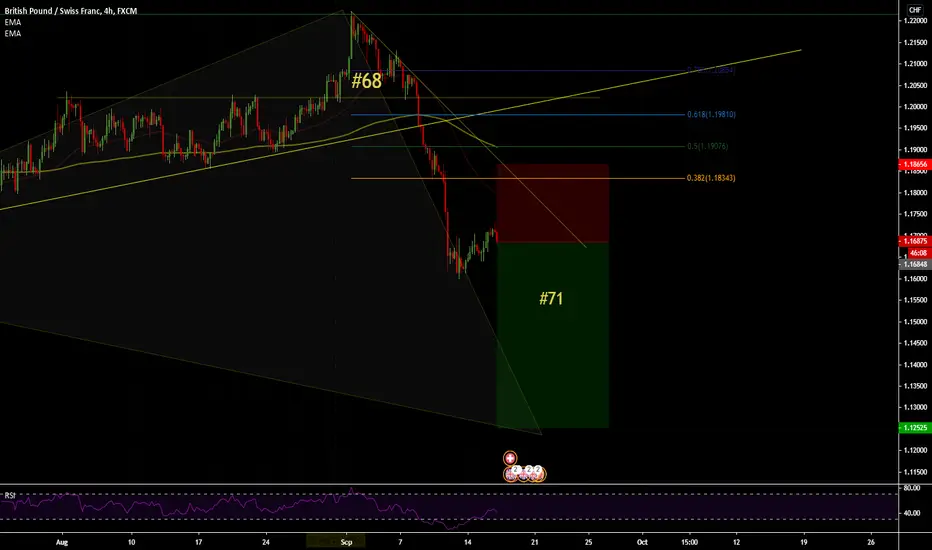
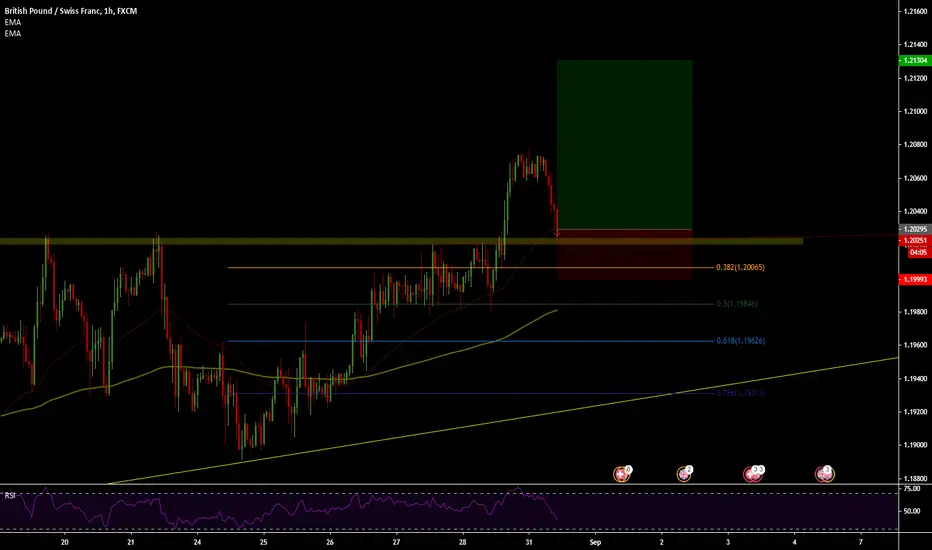
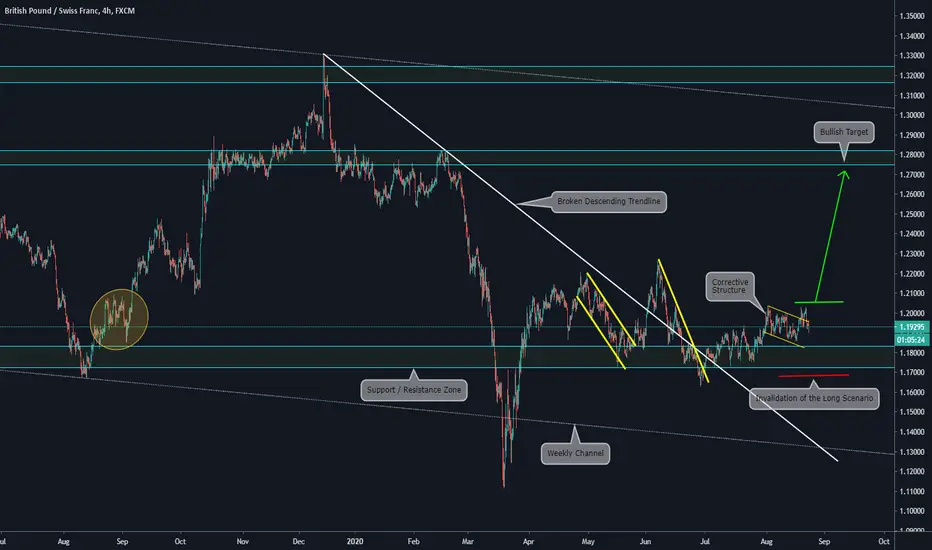
Trade Idea on GBPCHF / BullishMain items we can see on the chart:
a) The price has broken a descending trendline
b) The reversion happened after the price reached a major Support Zone
c) Currently, we can see a clear corrective structure
d) Our Trade idea is: ENTRY LEVEL on the green arrow starting zone / STOP LEVEL below the corrective structure / TAKE PROFIT LEVEL at the end of the green arrow / BREAKEVEN LEVEL at 1.24000
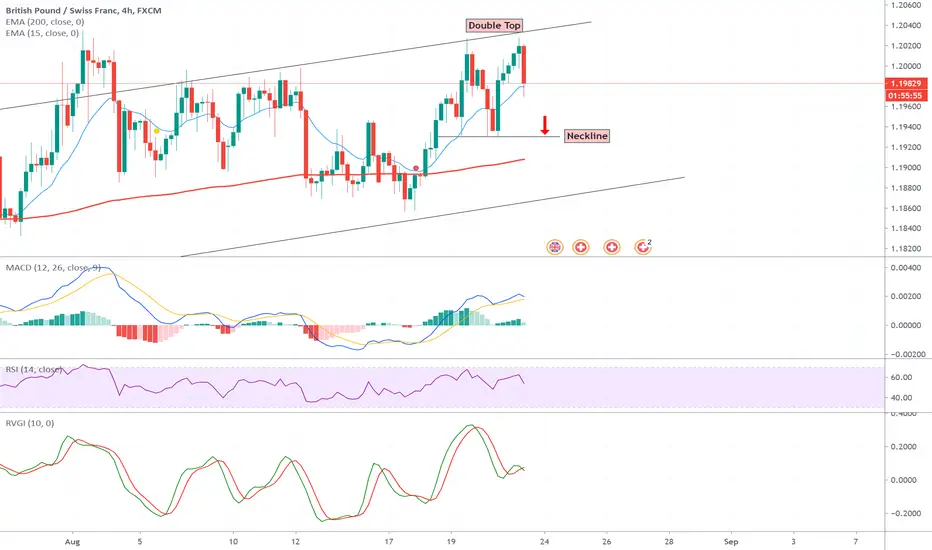
Double Top GBP/CHFGBP/CHF has been in an ascending channel pattern recently, with a possible double top forming.
What is a double top?
A double top occurs when the price moves upward and struggles to continue its bullish momentum and so it returns back down only to move upward again (forming the neckline) and reverse at the same price level. At this point, we look for the price to break the neckline on its way down. This creates a double top' pattern. With this pattern, there must be a visible neckline in order for there to be a double top set up.
The break of the neckline can show the potential for a short trade. it is important to make sure the neckline has been broken before entering a short trade.
If the neckline is clearly broken, we could expect the price to return to the support level at 1.1865
I will be keeping an eye on this pair for the rest of the trading hours today and on the opening on Sunday night.