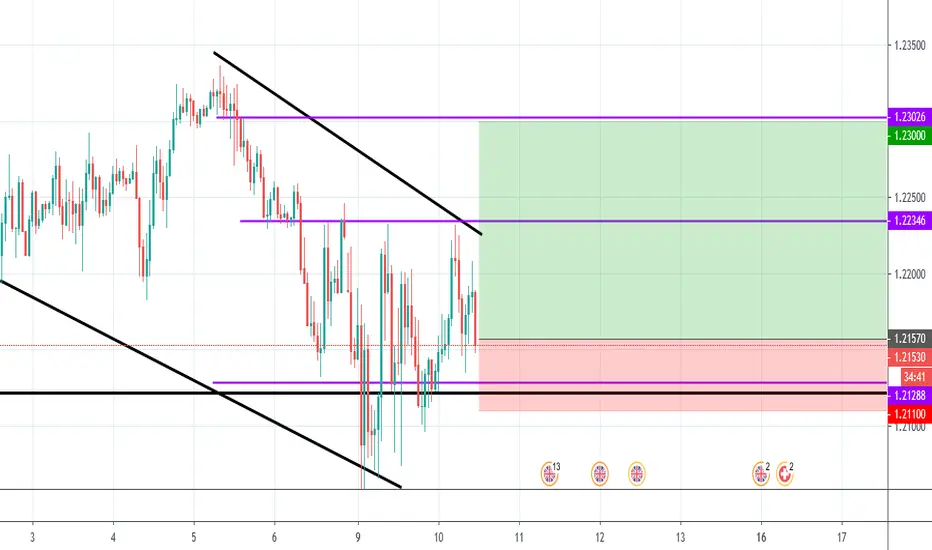
GBPCHFHi all,
we have 2 scenario for GBPCHF,
wait for confirm ,
my idea is short but wait for confirm!
good luck!
GBP-CHF
Swing short Judging by my indicators and the candle formation I can see this pair running out of steam.
The bears are creeping in for a beautiful swing short.
Once we hit the TP we intend to ride the recovery wave back to the top for a weekly swing long.
Happy trading all!!
Stay inside, wash your hands and get tho's pips!
P.A.E.N

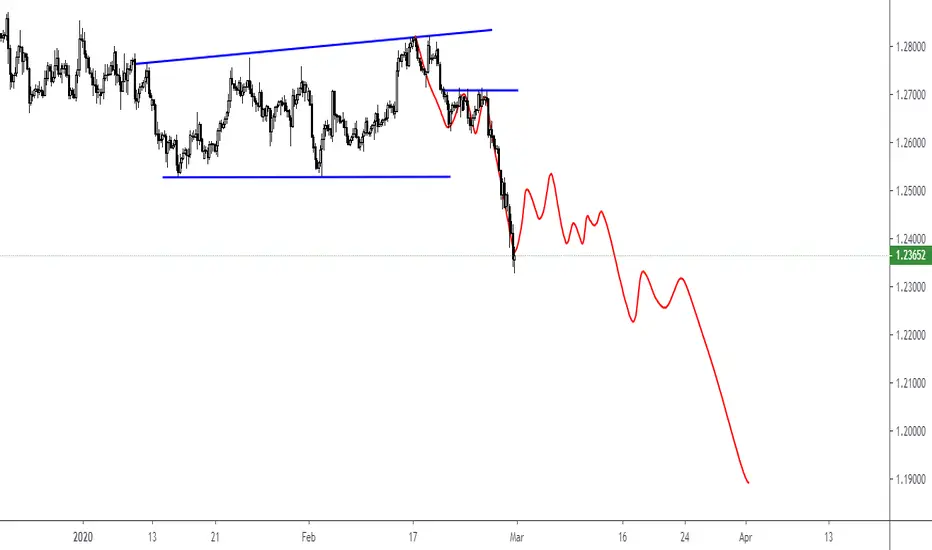
GBPCHF - INTRADAY - 31. MAR. 2020Welcome to our weekly trade setup ( GBPCHF )!
-
1 HOUR
Bearish market open and pressure.
4 HOUR
Prices broke 1.19000 and instantly started to pullback.
OVERALL
Break and close of psychological turning area done, freefall with pretty high chances now!
-
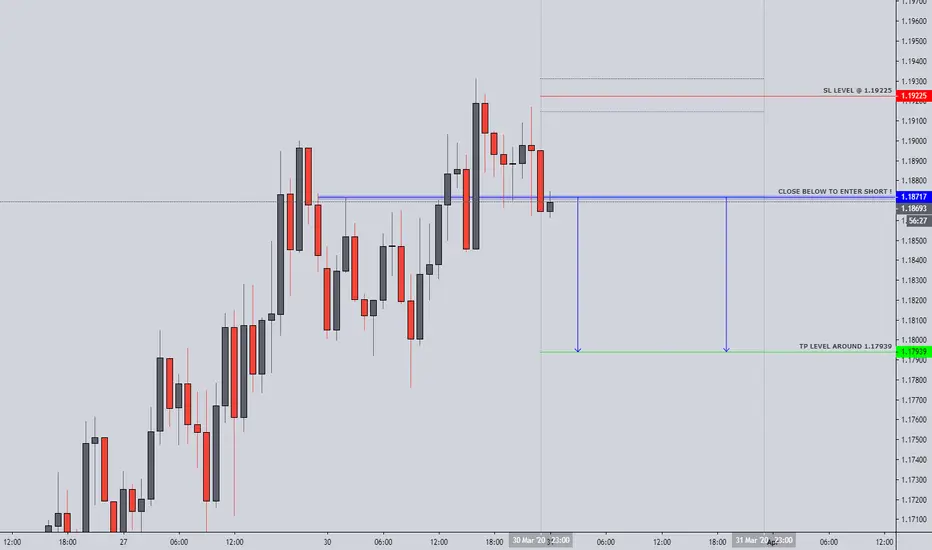
FOREX INTRADAY
SELL GBPCHF
ENTRY LEVEL @ 1.18700
SL @ 1.19230
TP @ 1.17940
Max Risk. 0.5% - 1%!
(Remember to add a few pips to all levels - different Brokers!)
Leave us a comment or like to keep our content for free and alive.
Have a great week everyone!
ALAN
Boris Johnson has a Death SentenceCorona is venereal
It has invaded the imperial
From Parliament to Big Ben
The country shall burn Again

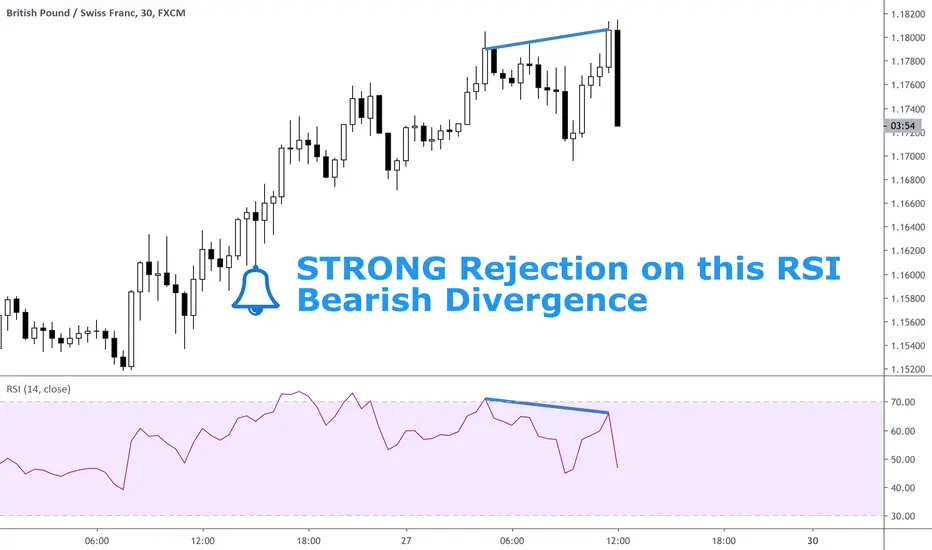
GBPCHF RSI Bearish Divergence! [QUICKUPDATES]Hey all, the Trading Guru is back with another entry on a new series called 'Quick Updates'.
We just got a very strong rejection on GBPCHF after the price made an RSI Bearish Divergence. This means that a temporary top might have been printed, and a new bearish downtrend can start.
--- What is The Quick Update Series All About? ---
I am starting a new tag (quickupdates) where I quickly share great opportunities based on TA for shorter timeframes, such as 4h, 1h, and 15m. It will not contain just a short explanation, in order to keep the velocity up and make sure you get to see the opportunities as fast as possible.
Follow me for consistent high quality updates, with clear explanations and charts.
Please like this post if you learned something to support me.
- Trading Guru
--------------------------------------------------------------
Disclaimer!
This post does not provide financial advice. It is for educational purposes only!
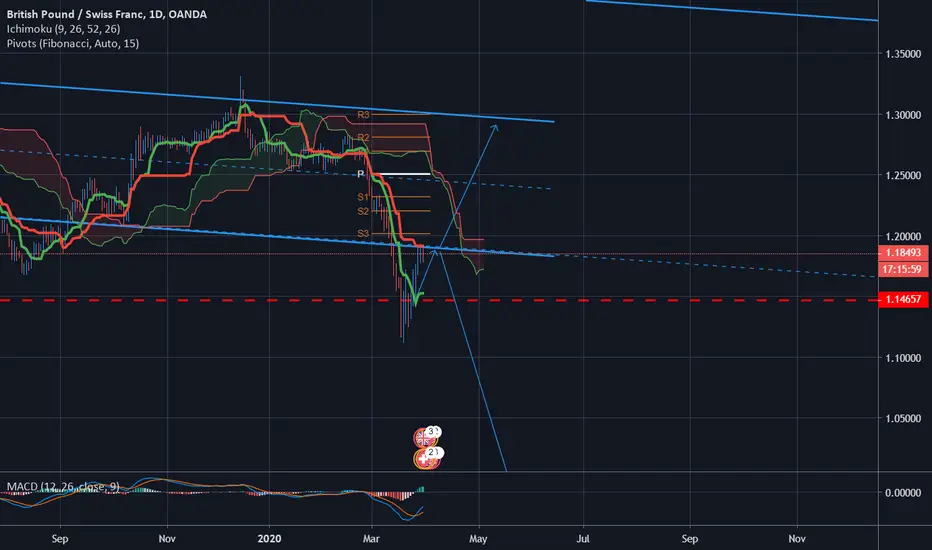
GBPCHF AnalysisAre we going to see a strong recovery on the board or just pullbacks and profit taking for more sells to enter the market? what's your opinion? have we already bottomed out?
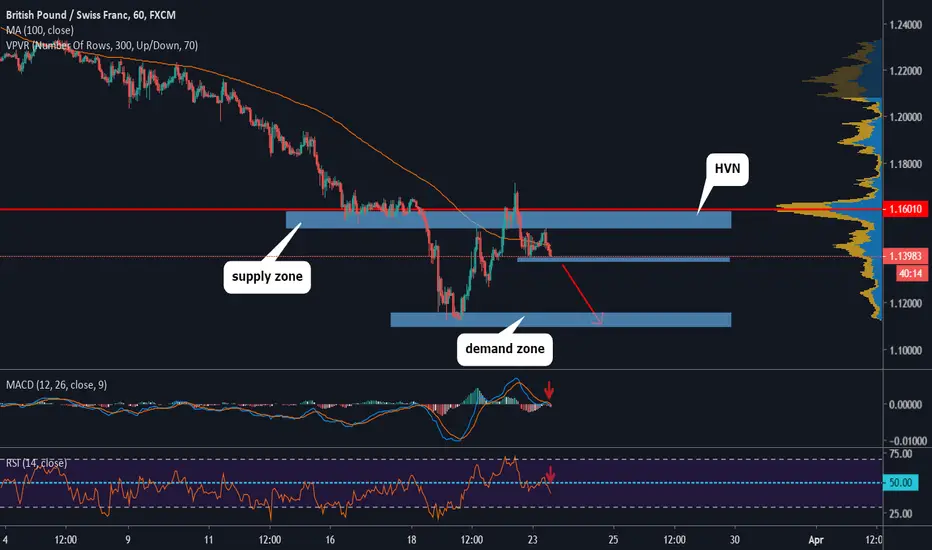
GBPCHF SHORT TRADEGBPCHF is based below supply zone at level 1.1569
and below HVN at level 1.1601 which indicates that pair is in distribution phase
Price is below SMA 100 H1 frame
MACD shows bearish momentum
RSI is below level 50
we r waiting to break support level 1.3880 to open short trade to target demand zone at level 1.1115
GBPCHF for a buy based on news (Scalp)Based on news and support, we could see GBPCHF go for a long.
Scalping Take Profit: 1.1240-1.13+
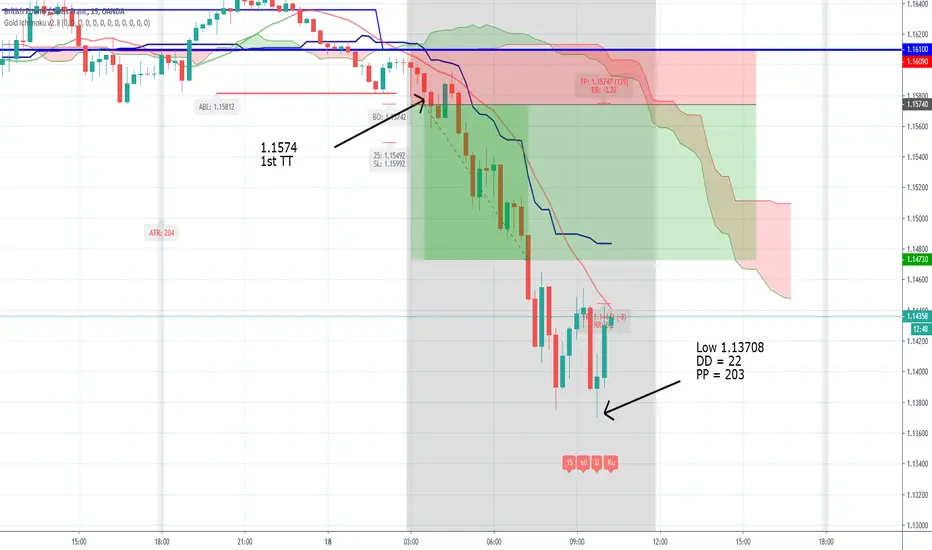
GBPCHF Documented Type 1 trade reached PT +101 PipsHere is today's GBPCHF trade which took a little to get going but then easily reached it's PT (+101 pips).
good Solid trade, all 4 horseman aligned :)
Allen
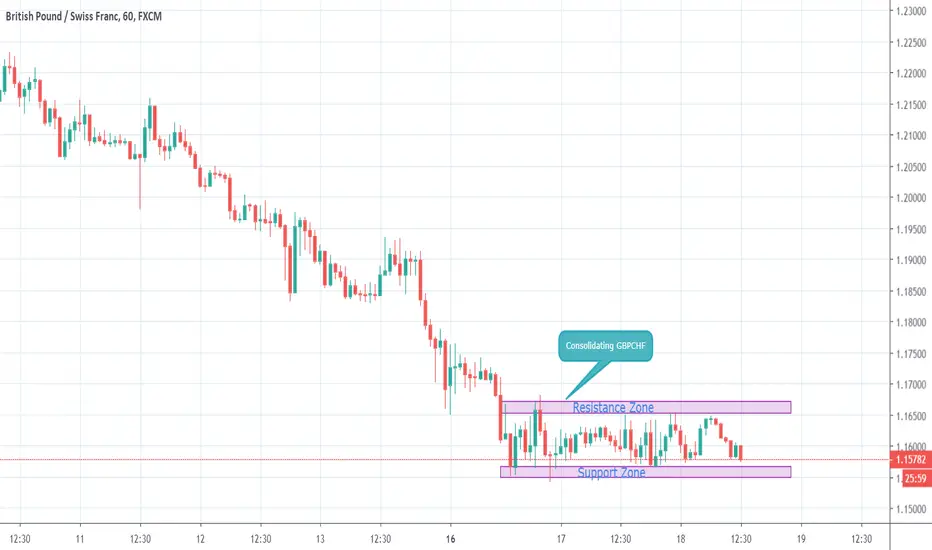
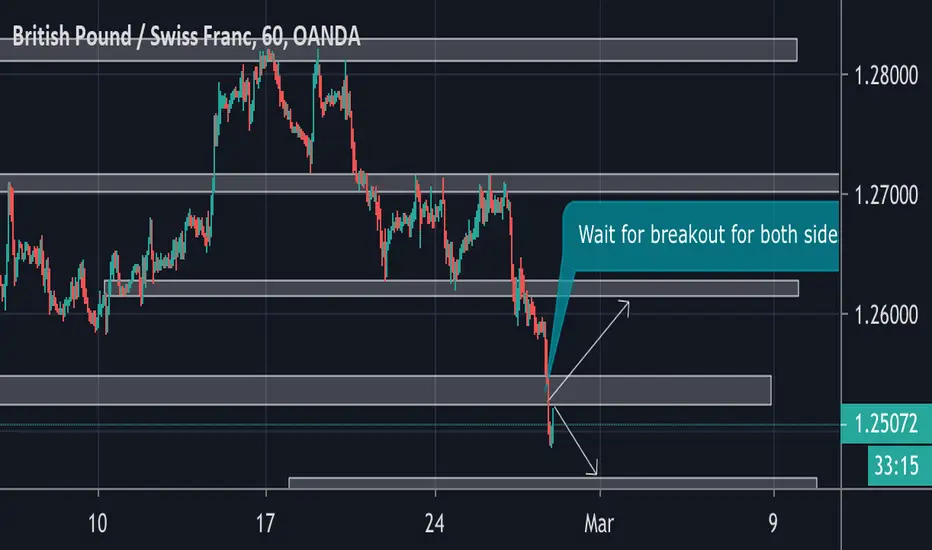
GBPCHF Consolidating Range for tradingGBPCHF is consolidating for sometime we might see more consolidation in GBPCHF if anyone want to trade one can trade at support zone and resistance with stoploss . after break consolidation range on either side one can trade on breakout side for longer term perspective.
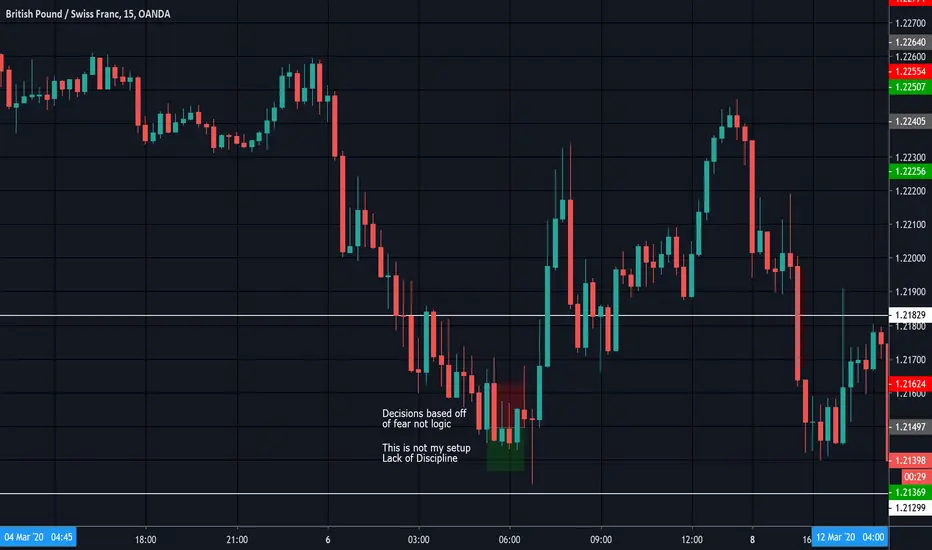
GBF/CHF short setupI post these charts of my trades for accountability reasons. I want to keep myself honest because this endeavor is a serious one. This trade was not based off of logic but fear. I wanted to be in the market because of FOMO. I have some work to do with regard to discipline
What will you do with 400 pips? BUY NOW!!#GBPCHF - Tendency: Bullish
Price just finished retracement and I see it move as much as 400 pips to the upside.
Like and Follow to show support for more analysis!
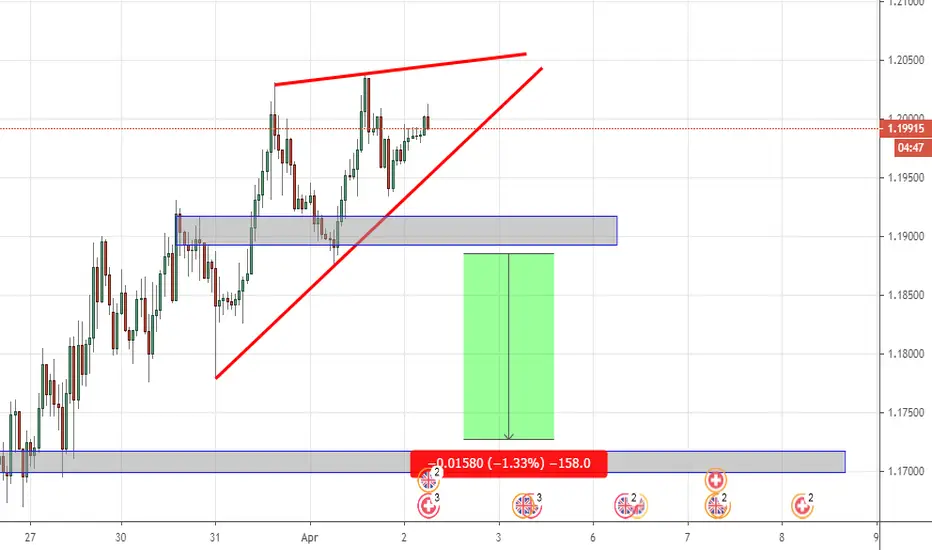
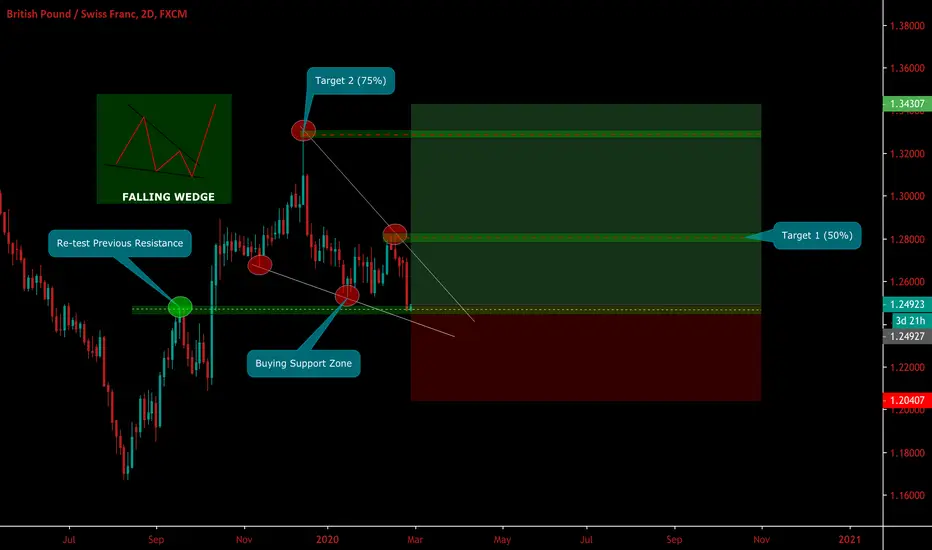
GBP/CHF - FALLING WEDGE - BUYPOTENTIAL TRADE: GBP/CHF
I am looking to enter long on this currency pair for the following reasons:
- Falling wedge chart pattern is very evident.
- Re-test of the previous resistance structure
- Buying the descending trend-line.
- Buying support zone has been slightly violated. Discounted price for bulls.
If you found this idea useful, leave a like and follow me for more analysis and trading signals.
If you have any questions, feel free to ask in the comment question. I respond to all comments!
You must always use correct risk management when following any analysis.
Happy Trading!
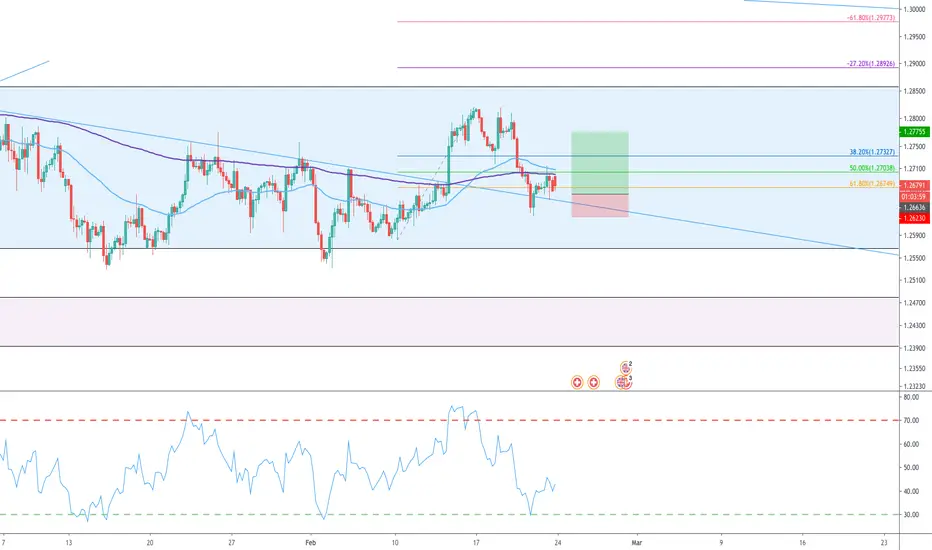
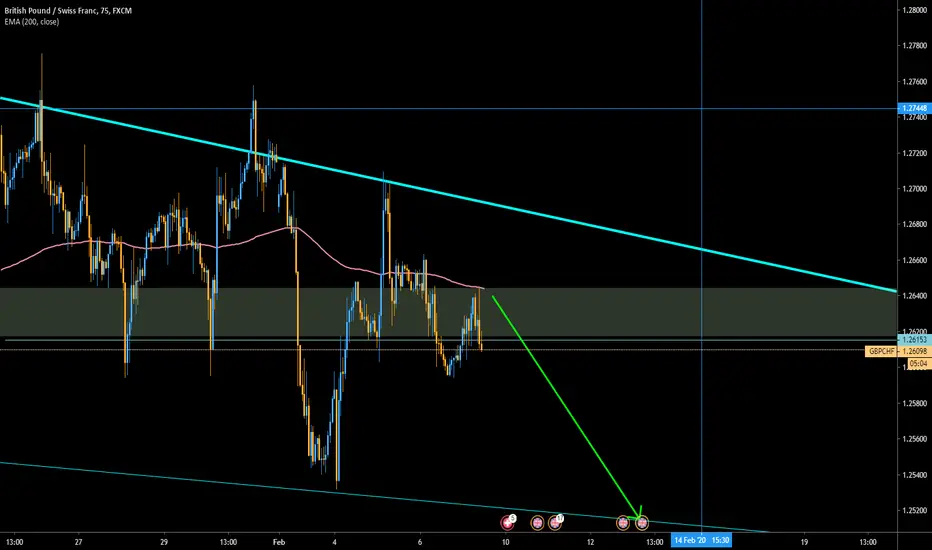
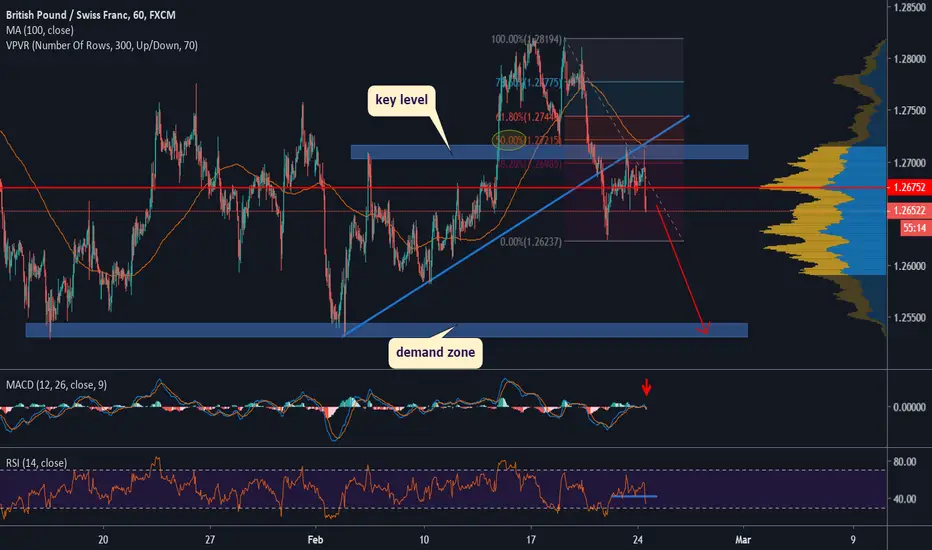
GBPCHF SHORT TRADEGBPCHF retested broken uptrendline
Price rejected from key level and 50% Fibonacci level of preceding bearish wave at 1.2713
Below SMA 100
MACD shows bearish momentum
RSI is in downtrend
Price is based below HVN at level 1.2675 which indicates that pair is in distribution phase
It's expected for price going down towards demand zone at level 1.2531
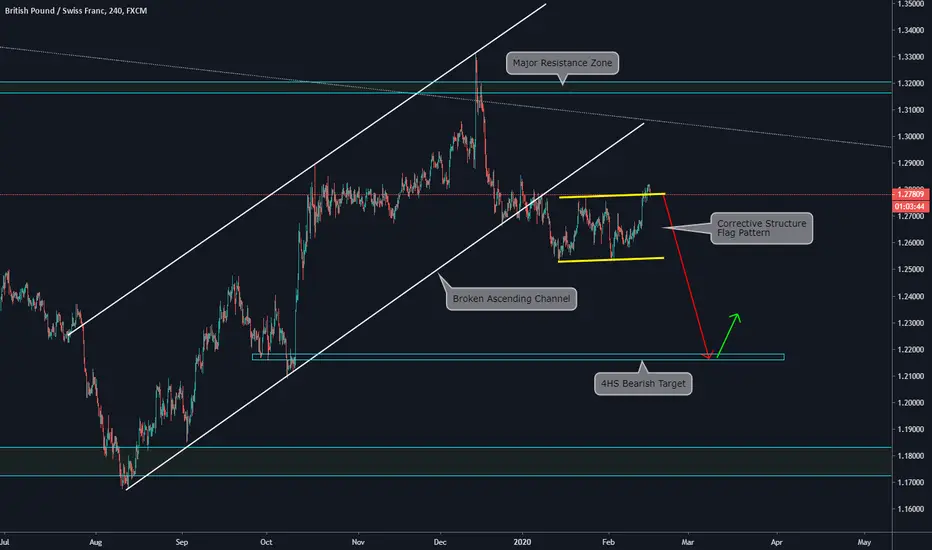
GBPCHF Possible Short Scenario by ThinkingAntsOkUse this as a guide to develop your setup.
Main items we can see on the 4HS chart:
a)The main ascending channel has been broken
b)After the Breakout, a corrective structure was formed
c)Currently, we can see a Flag Pattern (continuation structure)
d)We expect a continuation of the bearish movement towards the next support zone
GBPCHF Long IdeaA small long idea. Will see the reaction to the upper range resistance line before next move on this pair.
GBPCHF Risk off hit Asia, time for CHF to comeback ? short....Hi Traders,
all details entry, stop and target on the video
Enjoy