GBP CHF sell Opportunitymarket has reached a resistance level right below 50 EMA and formed a nice bearish engulfing candle
we can enter the trade now with stops above swing high
GOod luck
FIrst Target : 1:1 R/R
Trade Green
GBP-CHF
GBP/CHF: Conditional buy order -> 80 pips profit trade! Hi guys,
A nice 80-pip target profit for this conditional trade, go and check out the idea!
If you like my ideas please add a like/comment!
Best,
Jesse

GBP/CHF 1H Chart: Downside risks in short termGBP/CHF has been trading in a descending channel since May. This movement south has been bounded in a more senior channel valid for four months. The bottom boundary of the junior pattern was tested two weeks ago. Since then, the Pound was driven by slight bullish pressure.
After failing to overcome the 55-, 100– and 200-hour SMAs near 1.3050, the rate breached this minor channel and began falling closer to a channel line and the monthly S1 circa 1.2980. It is likely that downward pressure prevails today and sends the rate to this support cluster or even lower until to 1.29.
By and large, the strong resistance at 1.3050 should be surpassed later this week just to form a breakout from the senior channel and reach the 200-day SMA and the 61.80% Fibonacci retracement at 1.3240.

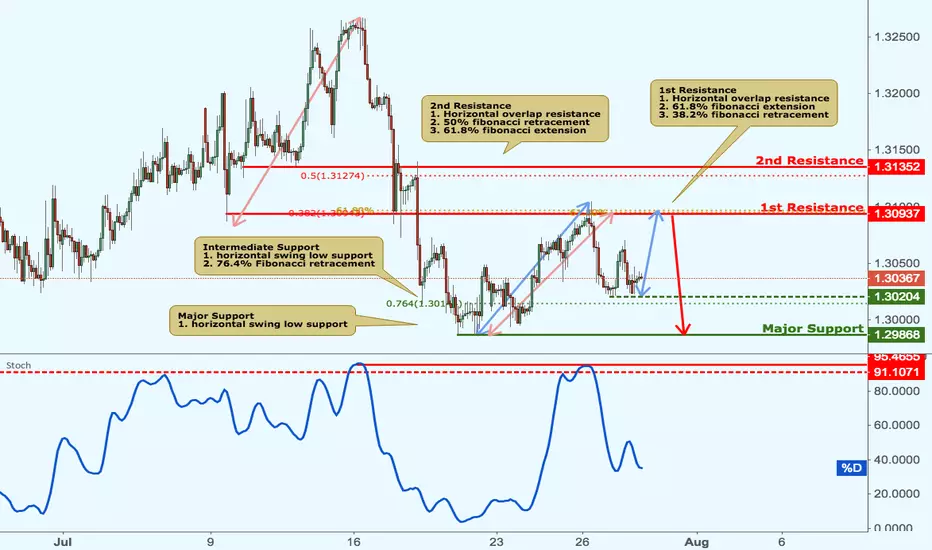
GBPCHF approaching resistance, potential drop! GBPCHF is approaching our first resistance at 1.3093 (horizontal overlap resistance, 61.8% fibonacci extension, 38.2% fibonacci retracement) where a strong reaction might occur below this level, pushing price down to our major support at 1.2986 (horizontal swing low support). A breakout below our intermediate support at 1.3020 (horizontal swing low support, 76.4% fibonacci retracement) might provide the bearish accleration to our major support target.
Stochastic (55,5,3) is also approaching our resistance and a reation below this level might see a corresponding drop in price.
Trading CFDs on margin carries high risk.
Losses can exceed the initial investment so please ensure you fully understand the risks.
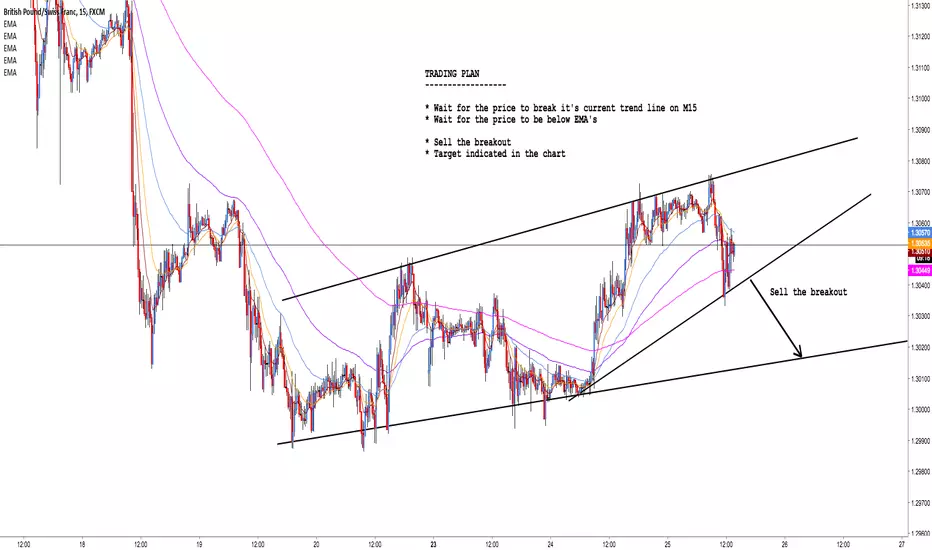
GBP/CHF: Selling the breakout Hi guys,
GBP/CHF in a bearish view this time.
Will sell the breakout.
Best,
Jesse
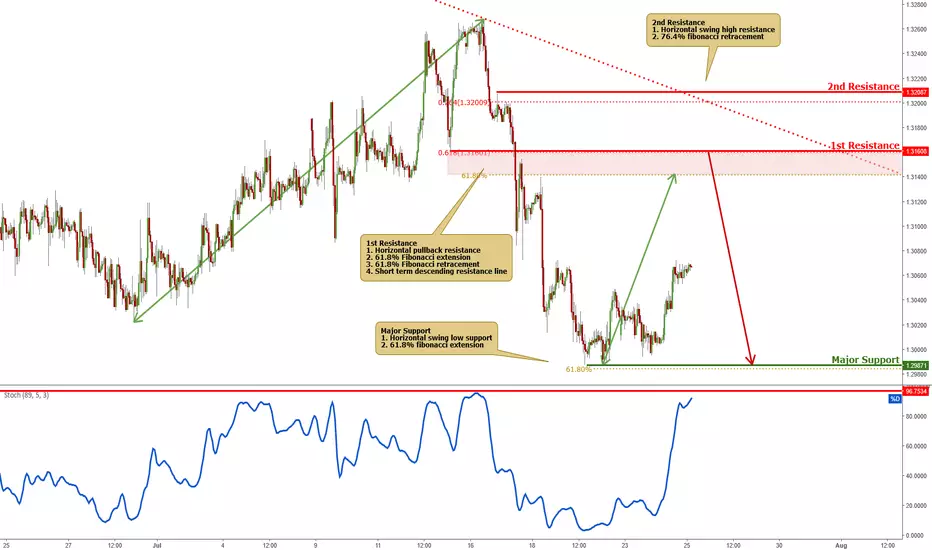
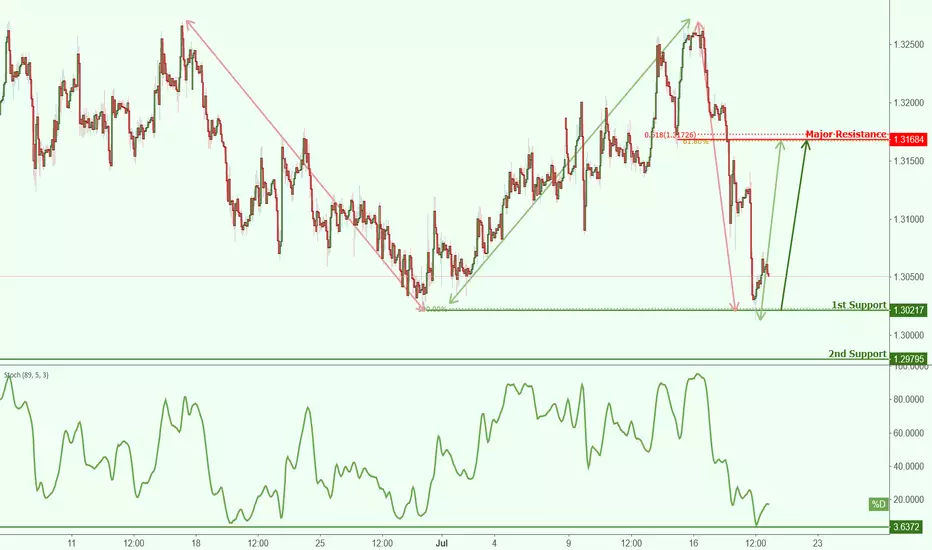
GPBCHF approaching resistance, potential drop! Price is approaching our first resistance at 1.3160 (horizontal pullback resistance, 61.8% Fibonacci retracement, 61.8% Fibonacci extension, short term descending resistance line) and might potentially drop to our major support at 1.2987 (horizontal swing low support, 61.8% Fibonacci extension).
Stochastic (89,5,3) is also approaching resistance and we might see a corresponding drop in price should it react off this level.
Trading CFDs on margin carries high risk.
Losses can exceed the initial investment so please ensure you fully understand the risks.
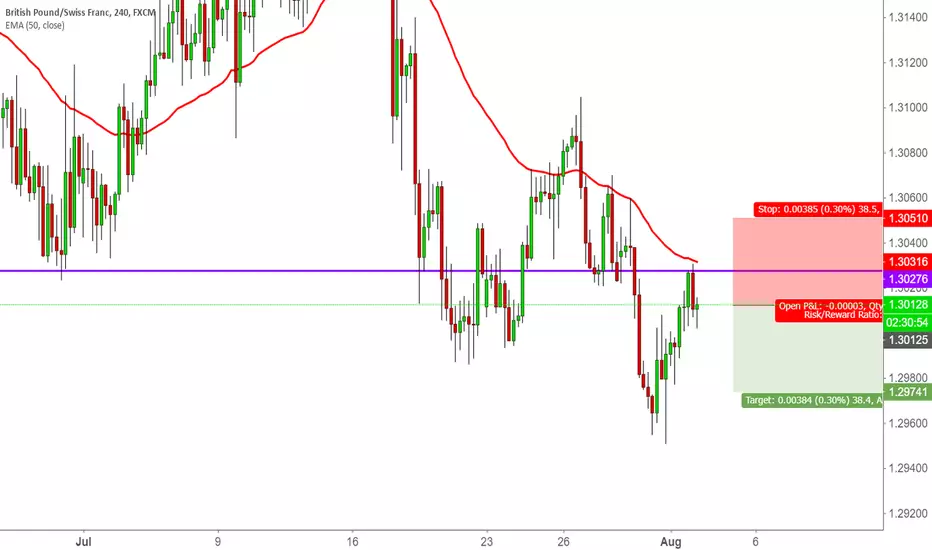
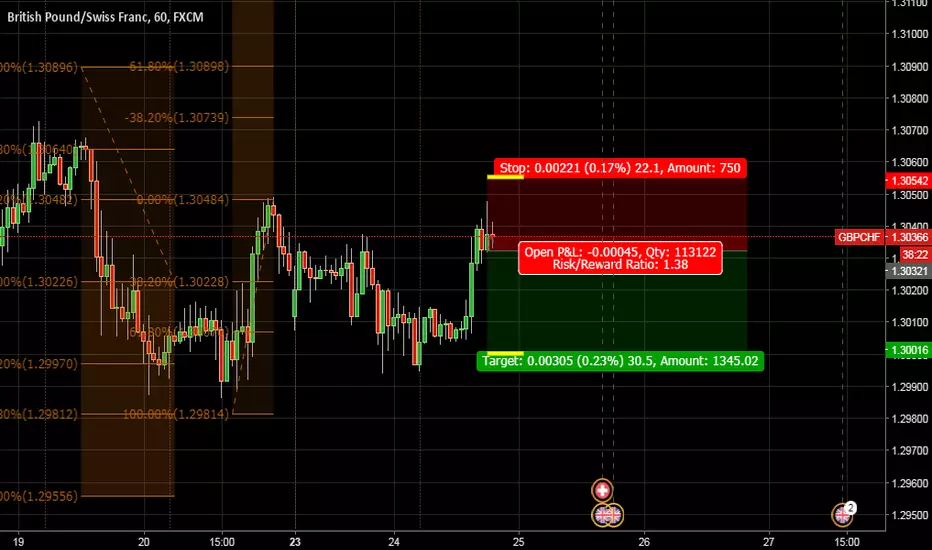
GBPCHF ShortSame logic as my GBPCAD (I might regret this lol). Shorted this pair with TP @1.30016 and SL @1.30542.
Daily:
Weekly:
Confidence: C (because I've been impulsive)
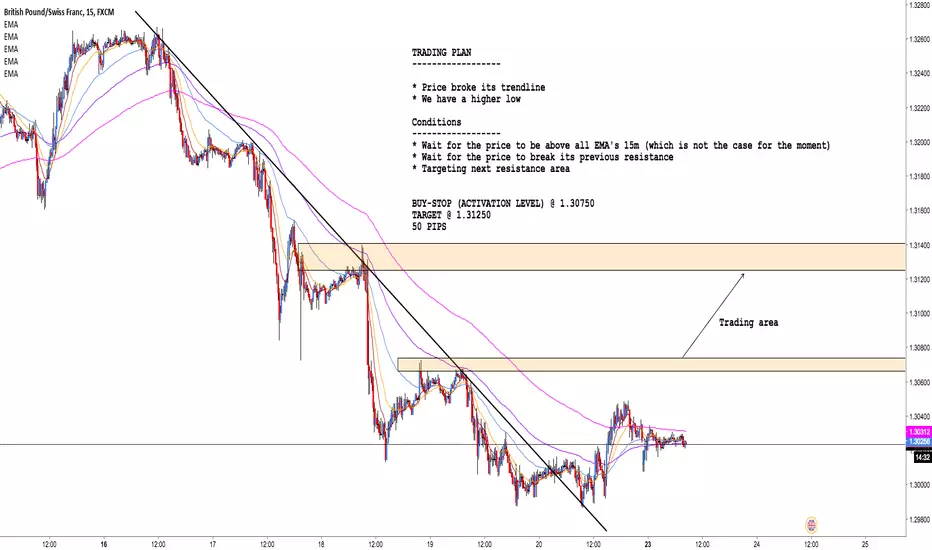
GBP/CHF: Conditional buy order (50 PIPS)Hi guys,
Check out my new idea on GBP/CHF.
It could be a nice trade, with a profit of 50 pips!
Do not hesitate to like/comment my ideas.
Trade with care.
Best,
Jesse
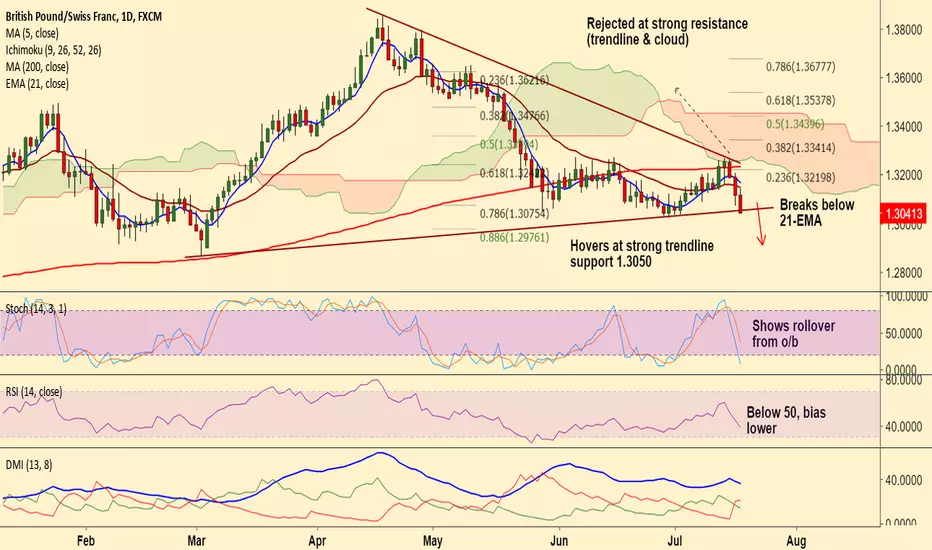
GBP/CHF short setupBritish Pound under selling pressure after UK’s inflation figures failed to meet expectations.
UK headline CPI rose at an annualized 2.4% y/y missing forecasts at 2.6%. Core CPI fell to 1.9% y/y.
Poor inflation figures could pour cold water over expectations of a rate hike by the Bank of England at its August meeting.
GBP/CHF is extending weakness after break below 21-EMA.
Technical indicators on daily charts have turned bearish. Stochs and RSI are sharply lower.
Price is hovering around strong trendline support at 1.3050. Break below to see further weakness.
Watch out for break below 1.3050 for further weakness, target 1.3025/ 1.30/ 1.2975
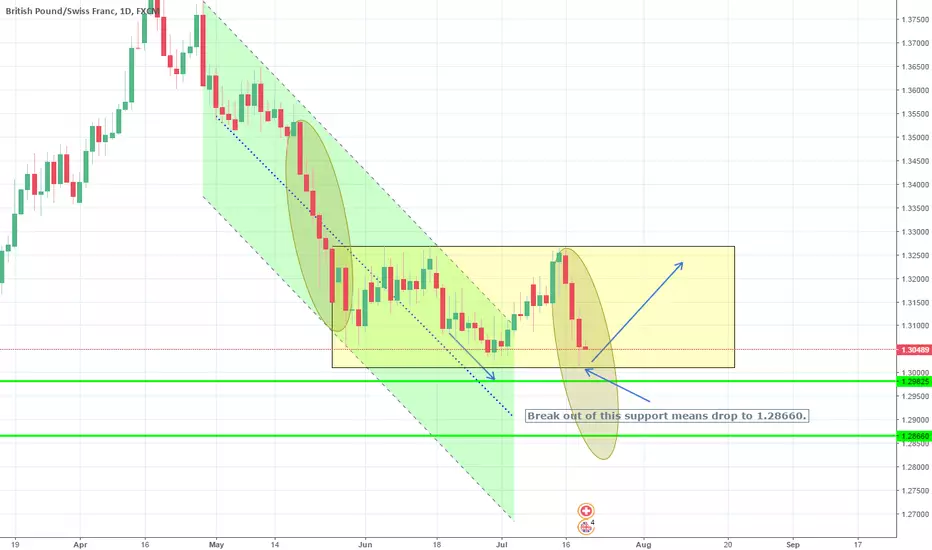
Rectangle spotted. Sideways.GBPCHF is trading within a 1.3022 - 1.3268 Rectangle on 1D (MACD = 0, ATR = 0.0080, Ultimate Oscillator = 50.855). Our trade is a long, TP = 1.32380, but if 1.30105 breaks, we'll stop and short to 1.28660.
GPBCHF is approaching support, potential bounce!GPBCHF is approaching our first support at 1.3021 (horizontal swing low support, 100% Fibonacci extension) and a strong bounce might occur above this level pushing price up to our major resistance at 1.3168 (horizontal overlap resistance, 61.8% Fibonacci extension, 61.8% Fibonacci retracement).
Stochastic (89,5,3) is also approaching support and a bounce off this level might see a corresponding rise in price.
Trading CFDs on margin carries high risk.
Losses can exceed the initial investment so please ensure you fully understand the risks.
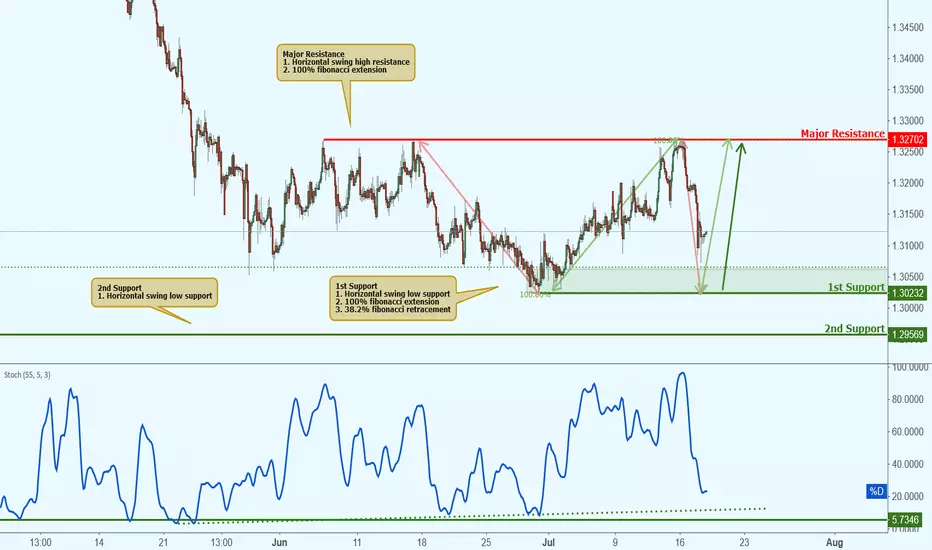
GBPCHF approaching support, potential bounce! Price is approaching our first support at 1.3023 (horizontal swing low support, 38.2% Fibonacci retracement, 100% Fibonacci extension) where a strong bounce might occur above this level pushing price up to our major resistance at 1.3270 (horizontal swing high resistance, 100% Fibonacci extension).
Stochastic (55,5,3) is also approaching our major support where a bounce off this level might see a corresponding rise in price.
Trading CFDs on margin carries high risk.
Losses can exceed the initial investment so please ensure you fully understand the risks.
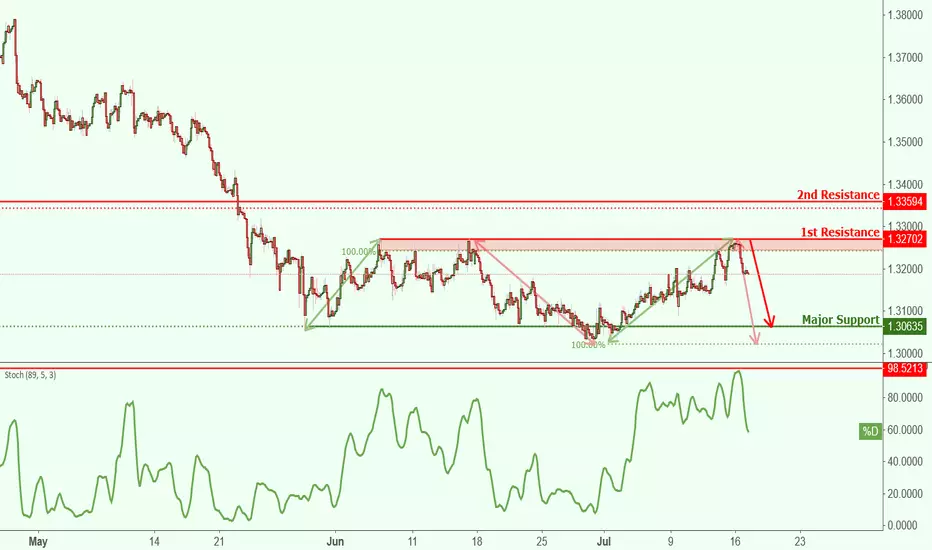
GBPCHF approaching resistance, potential drop! GBPCHF is approaching our first resistance at 1.3270 (horizontal swing high resistance, 100% Fibonacci extension) where a strong reaction might occur below this level pushing price down to our major support at 1.3063 (horizontal swing low support, 38.2% Fibonacci retracement, 100% Fibonacci extension).
Stochastic (89,5,3) is also reacting off our resistance and we might see a corresponding drop in price.
Trading CFDs on margin carries high risk.
Losses can exceed the initial investment so please ensure you fully understand the risks.
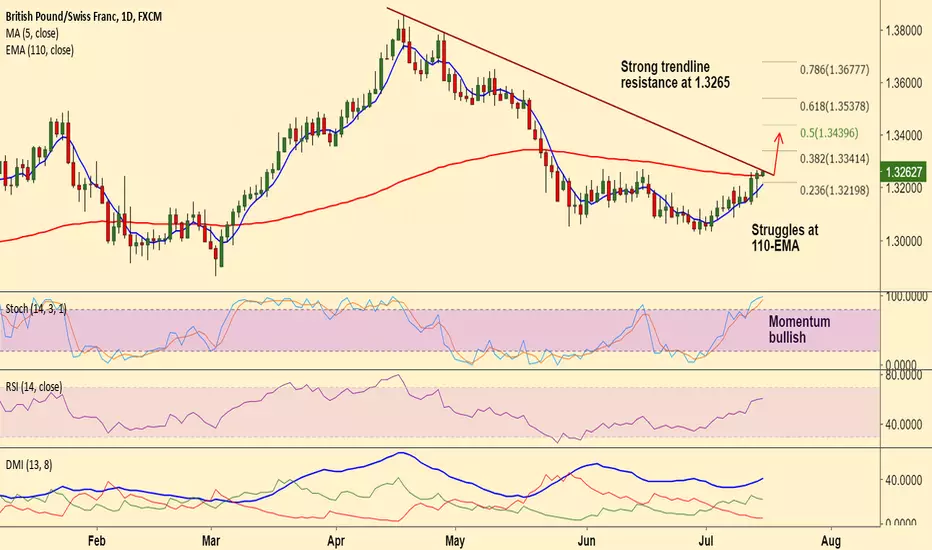
GBP/CHF - stay long on breakout at 1.3265GBP/CHF upside remains capped at major trendline resistance at 1.3265. Break above could take the pair higher.
Price action has broken above 200-DMA at 1.3231, but is struggling to extend gains above.
Technical indicators are bullish on the daily chart. Momentum bullish, RSI above 50.
Breakout at major trendline resistance at 1.3265 could see test of 38.2% Fib at 1.3241.
Retrace below 200-DMA could invalidate the bullish bais.
Support levels - 1.3231 (200-DMA), 1.3210 (5-DMA), 1.3167 (21-EMA)
Resistance levels - 1.3265 (trendline), 1.33, 1.3329 (100-DMA)
Good to go long on breakout above trendline at 1.3265, SL: 1.3230, TP: 1.33/ 1.3340/ 1.34.
GBP/CHF Technical analysis The MACD indicator is in the positive zone and points on Buy deals. The Stochastic indicator is directed to the overbought zone and supports purchases. The RSI also supports Buy deals. Resistance levels are around the marks of 1.3075, 1.3085 and 1.31. The pivot level is at the mark of 1.3055. Support levels are at 1.3036, 1.3026. The price is traded in the lateral channel, above the moving average.
In total Buy deals are preferred.
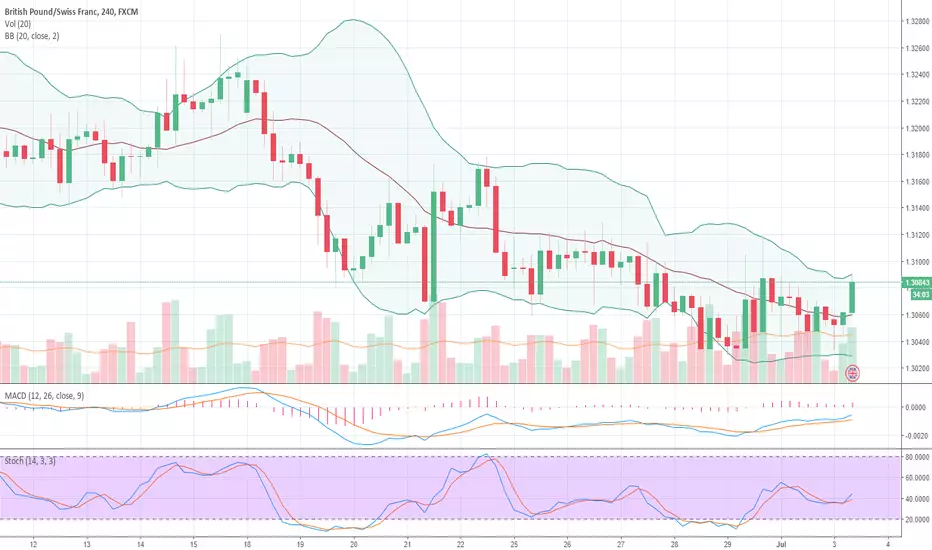
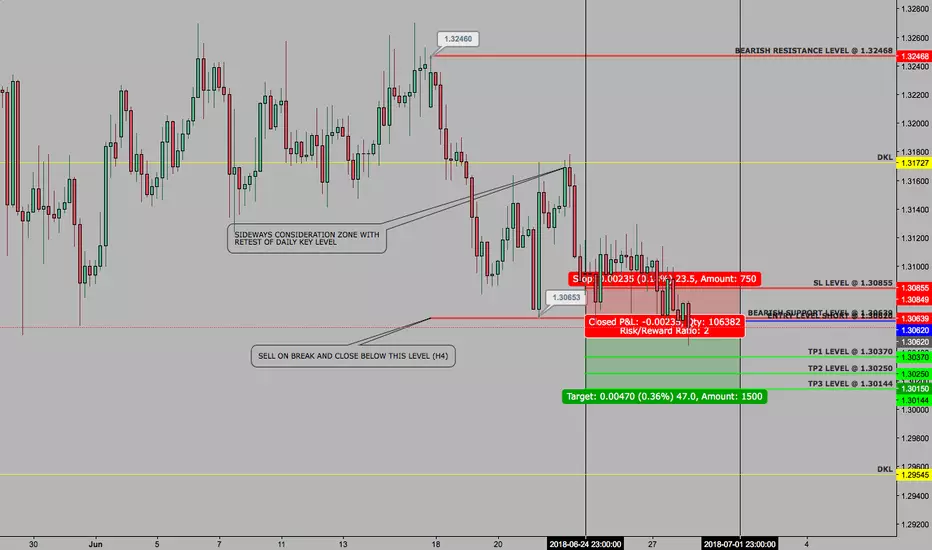
GBPCHF - SETUP - WEEKLY CONTINUATION - 28 JUNEWELCOME TO DACAPITAL TRADING!!
GBPCHF just started moving as expected, quick Timeframe breakdown for free and everybody.
4 HOUR
Slow bearish movement for now but we formed new lows.
DAILY
Market was considering last two weeks but is on right direction now.
WEEKLY
Overall very bearish with only 2 small bullish Candle overall in the last whole Wave
LEVELS
SHORT @ 1.30620
SL @ 1.30855
TP1 @ 1.30370
TP2 @ 1.30250
TP3 @ 1.30144
Weekly trend continuation, move SL to BE if TP1 hit and close partial Profits at every TP Level.!
Enjoy our limited Free Content and Setups,
leave us a like and Comment!!
DACAPITAL TRADING
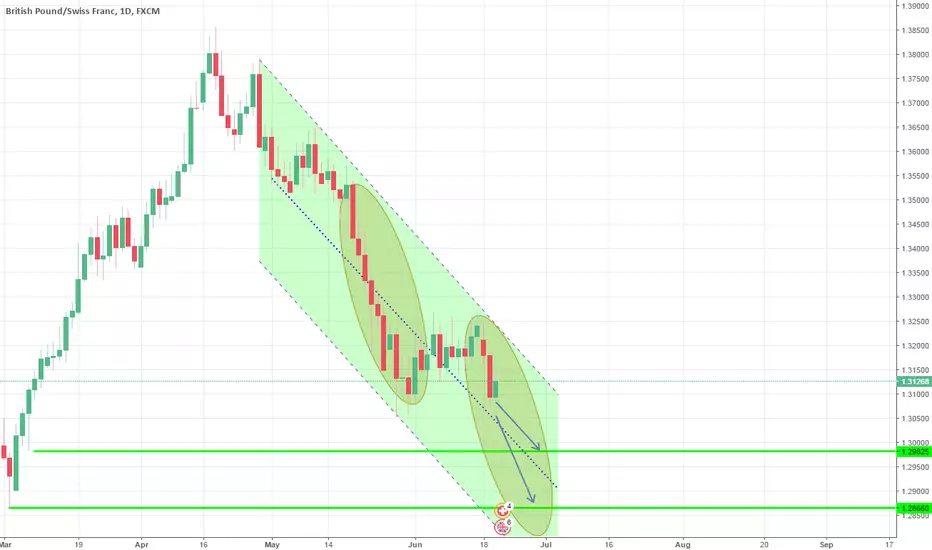
1D Channel Down. Short.GBPCHF is on a typical 1D Channel Down (RSI = 39.234, ADX = 40.425, Highs/Lows = -0.0024) which after a 20 day consolidation is looking to break the previous Lower Low (1.30533) and hit the 1.29825 and 1.28660 supports.
GBP/CHFI would be looking to trade any smaller flags down for continuation of downtrend. Looks like it completed a 4hr wave 4 correction. Plus, I nailed GA sell entry and GN came right off that zone in my markup.
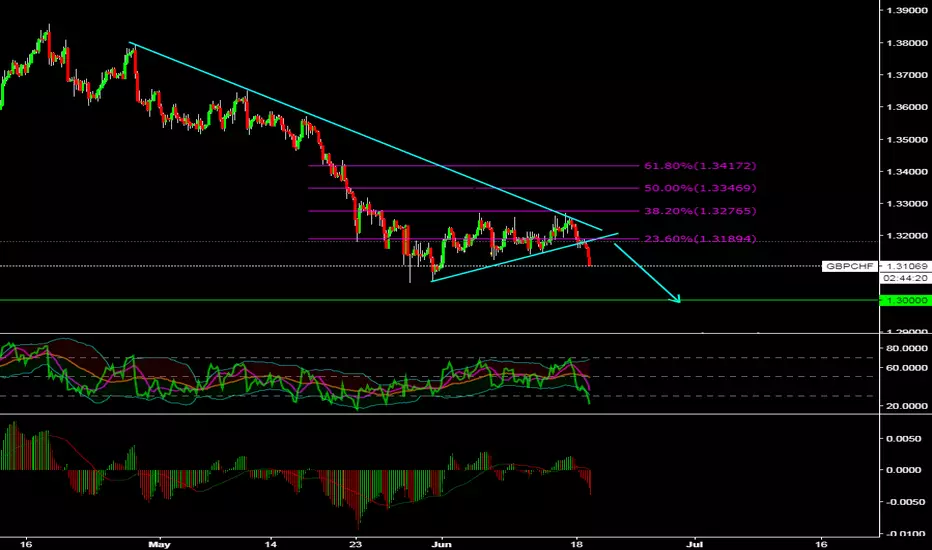
GBP/CHF 1H Chart: Triangle reaches maturityThe Sterling has been trading sideways against the Swiss Franc since late May, as it failed to depreciate after breaching a one-year senior channel to the downside. In addition, this movement has been stranded in an ascending triangle pattern with the lower boundary being a trend-line and the upper one—the 1.3266 mark.
Given that this pattern was entered from above, a breakout should occur southwards and subsequently be followed by a decline. The maturity of this pattern suggests that this breakout should occur in the nearest time. A possible short-term target for the following week in this bearish scenario is the weekly S3 and the 50.0% Fibonacci retracement at 1.3032.
Conversely, an upside breakout of the 55– and 100-period (4H) SMAs at 1.32 should result in a surge up to the 200-period SMA and the monthly R1 at 1.35.

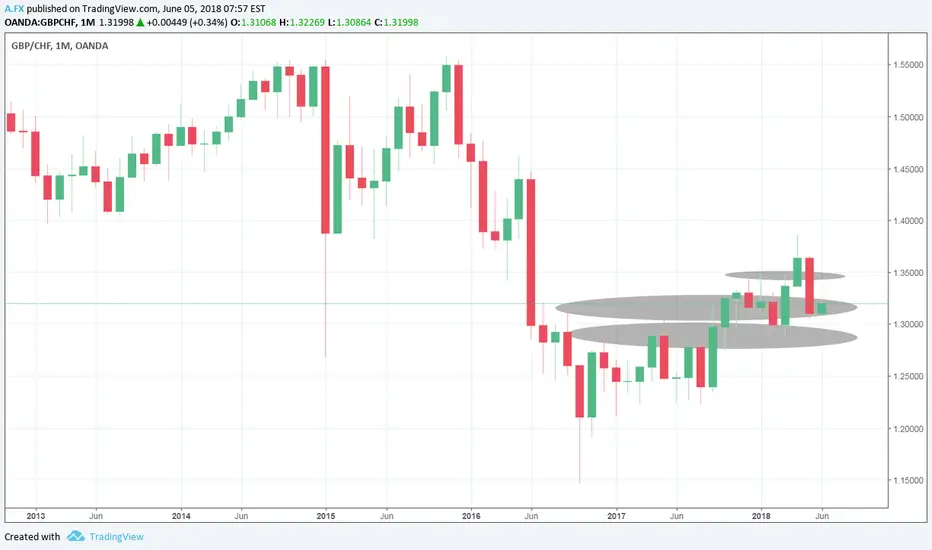
Areas that may bring support to GBPCHFPrice may be finding support around 1.295, 1.31, and 1.35. So, I will be looking for bull candles on the daily time frame around these price levels. If I see bull candles on the daily time frame, then I will move to the 1H to place buy limit orders at previous market levels.
Shorting GBPCHFI'm late to this pair, if I was looking to short. If price returns to the 1.345 area, then I'll consider shorting it only, if price begins to post daily bear candles on the daily time frame. Once I see those bear candles, then I'll move to the 1H to begin placing sell limit orders.

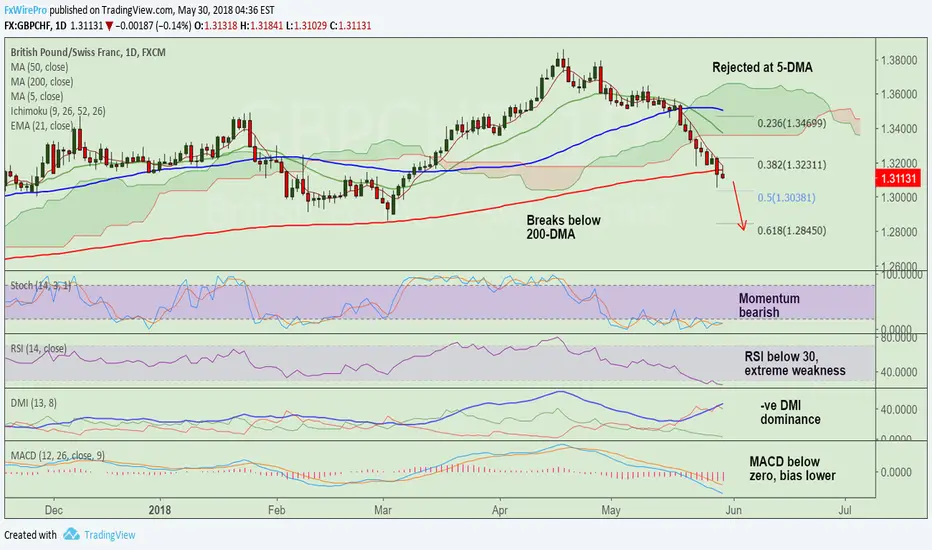
GBP/CHF breaks 200-DMA, stay shortTechnical Analysis: Bias Bearish
- Price breaks below 200-DMA at 1.3156
- Recovery attempts rejected at 5-DMA at 1.3185
- Momentum indicators show highly bearish bias
- RSI well below 30 levels shows bearish bias
- MACD below zero, biased lower and we see -ve DMI dominance
Support levels - 1.3038 (50% Fib), 1.2955 (Nov 15 low), 1.2845 (61.8% Fib)
Resistance levels - 1.3160 (200-DMA), 1.3185 (5-DMA), 1.3231 (38.2% Fib)
Good to go short, SL: 1.3185, TP: 1.3040/ 1.30/ 1.2955/ 1.29/ 1.2845
GBP/CHF 1H Chart: Sterling approaches senior channelThe Sterling began depreciating against the Swiss Franc after reaching a two-year high of 1.3850 mid-April. During the past two weeks, this depreciation accelerated in strength and the pair consequently fell 2.90% until the 1.3150 mark.
It is possible that the pair still edges lower down to this barrier, likewise supported by the monthly S2, within the following trading days. This scenario is supported by daily technical indicators.
Subsequently, the Sterling should respect this senior channel and thus reverse near 1.3150. A possible upside target within the following two weeks is the 61.8% Fibo retracement and a medium-term channel at 1.3550.
