🔥 NEW: GBPCHF 🔥 DAY TRADE 🔥-SL @ 1.1395 🚫
SLO @ 1.1380 ⏳
SSO @ 1.1366 ⏳
TP1 @ 1.1340 (shaving 25%)
TP2 @ 1.1315 (shaving 25%)
TP3 @ 1.1300 (shaving 25%)
TP4 @ 1.1275 (closing ALL Sell Orders)
SUPPORT @ 1.1266
IBR @ 1.1250
GBP-CHF

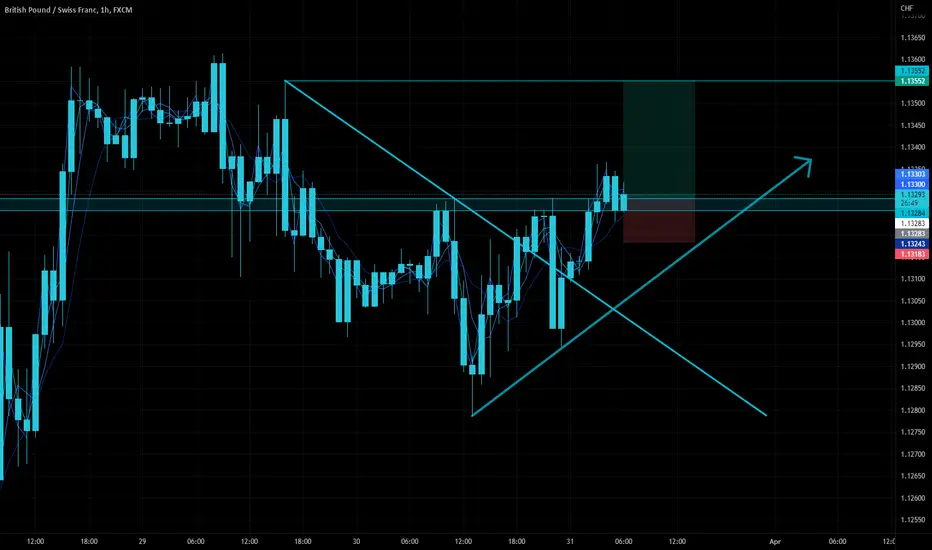
GBPCHF Potential UpsidesHello Traders!
In tomorrow's trading session, our focus will be on GBPCHF, as we keep a close eye on a potential buying opportunity within the 1.13200 zone. GBPCHF had been entrenched in a downtrend, but it recently succeeded in breaking out from it. Currently, it is in a correction phase, gradually approaching the retrace area located at the 1.13200 support and resistance zone.
Wishing you all safe and successful trades!
Trade safe, Joe.
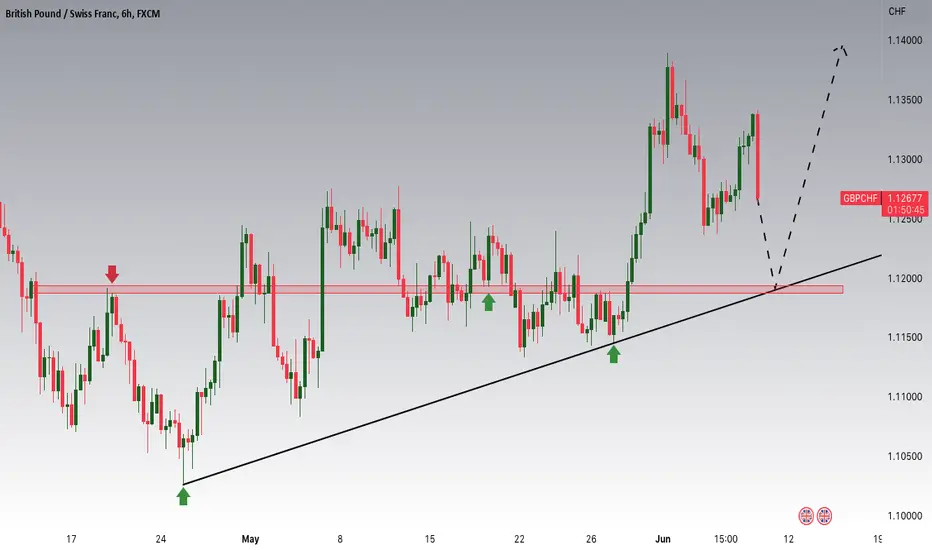
GBPCHF Potential UpsidesHey Traders, in today's trading session we are monitoring GBPCHF for a buying opportunity around 1.12000 zone, GBPCHF is trading in an uptrend and currently is in a correction phase in which it is approaching the major trend at 1.12 support and resistance zone.
Trade safe, Joe.
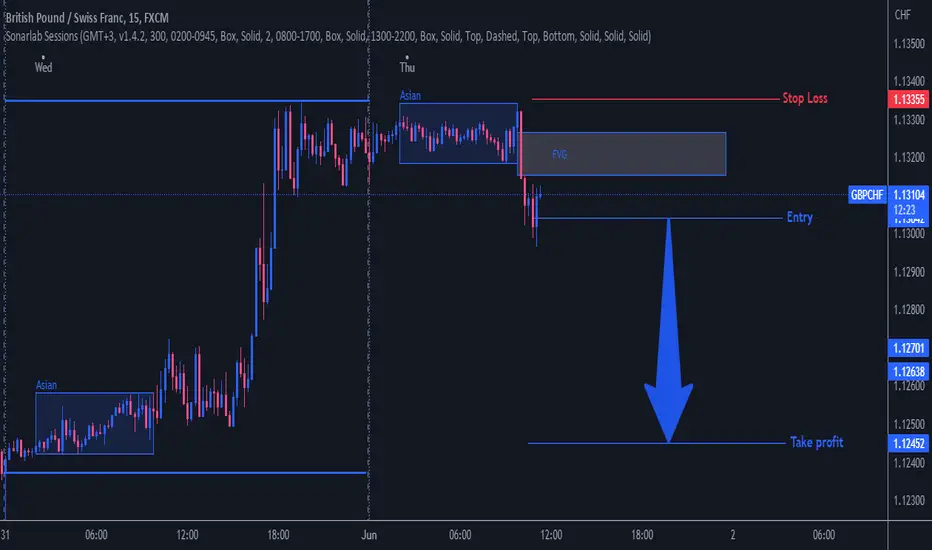
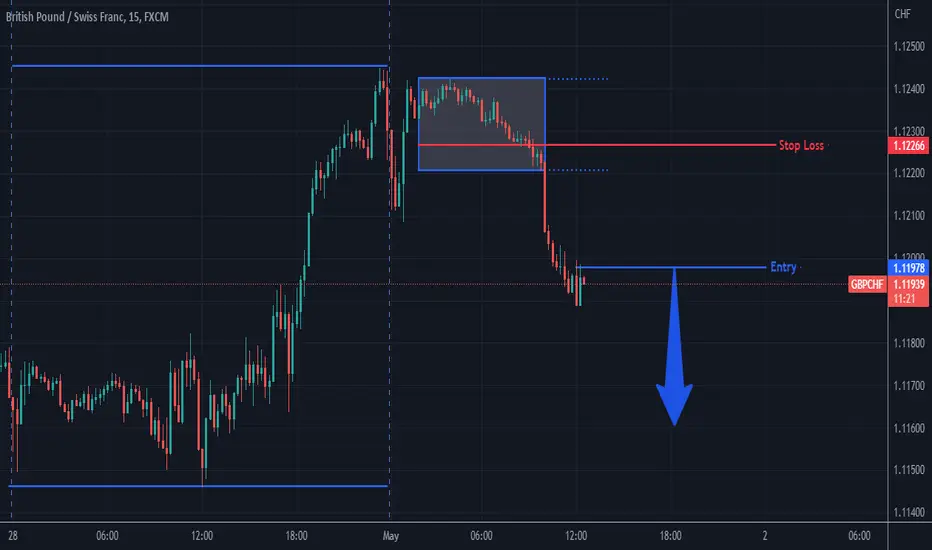
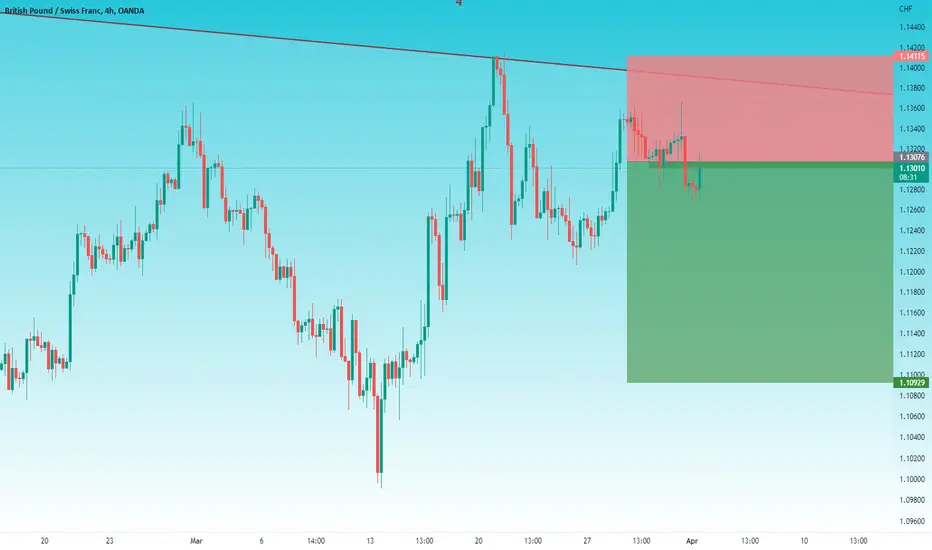
LOB Trade: Short position on GBPCHFLOB entry on GBPCHF 15 Mins for a Short position.
R:R 2
FVG Above to be filled before market eventually goes down.
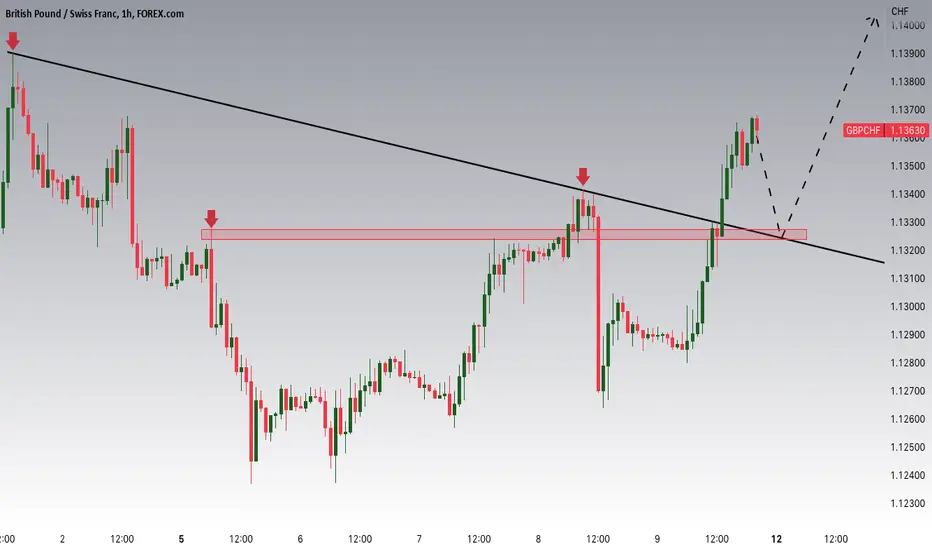
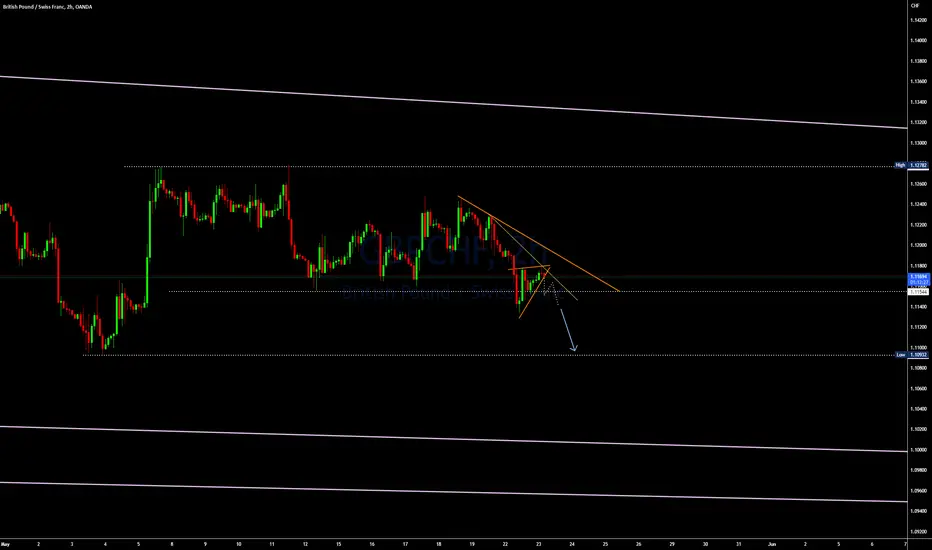
SELL TRADE SETUP ON GBPCHFHey Traders,
Check this sell opportunity out on GBPCHF.
The pair is in an overall ranging market and the next phase down to correct the FVG just made a nice pennant pattern.
I will be anticipating for a break and then jump into a sell trade.
Watch out.
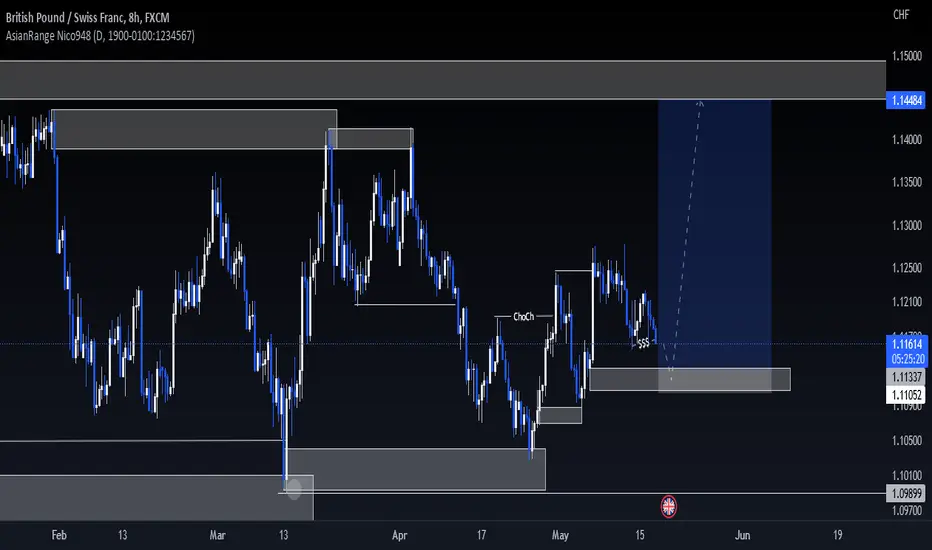
GBPCHF to the moon? Highy probableAfter price tapped into higher timeframe POI, it gave us a shift of market structure on the inner trend which could be the beginning of its expansion to the upside. Price preceded to break further structure and has now retraced back to fill in the fvg formed during its move. It has now formed liquidity above our POI that it could use to fuel its expansion to the upside
GBPCHF Potential DownsidesHey Traders, in today's trading session we are monitoring GBPCHF for a selling opportunity around 1.127 zone, GBPCHF is trading in a downtrend and currently seems to be in a correction phase in which it is approaching the major trend at 1.127 support and resistance zone. We would consider some potential CHF longs as it's considered a safe haven currency.
Trade safe, Joe.
GBPCHF Potential DownsidesHey Traders, in tomorrow's trading session we are monitoring GBPCHF for a selling opportunity around 1.13600 zone, GBPCHF is trading in a downtrend and currently seems to be in a correction phase in which it is approaching the major trend at 1.136 support and resistance zone, We would consider some potential CHF longs as it's considered a safe haven currency in this type of environment.
Trade safe, Joe.
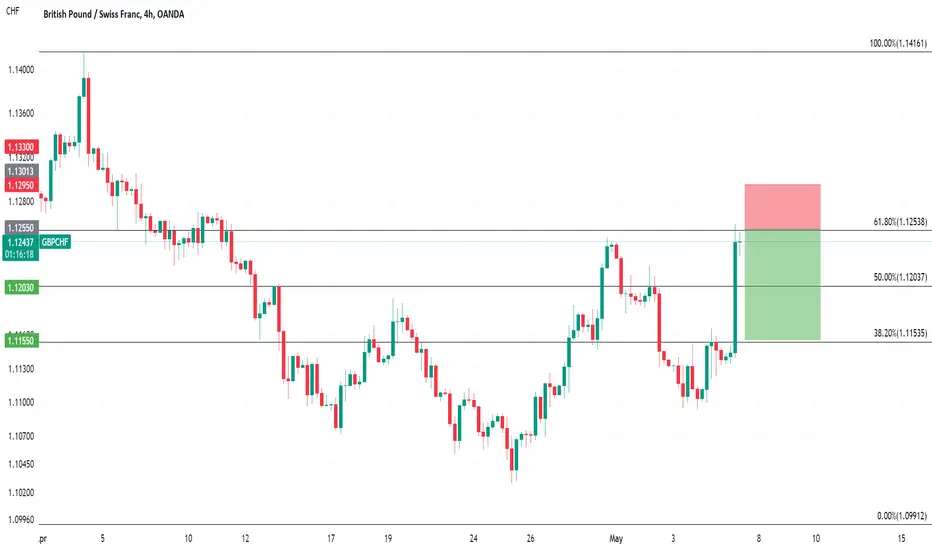
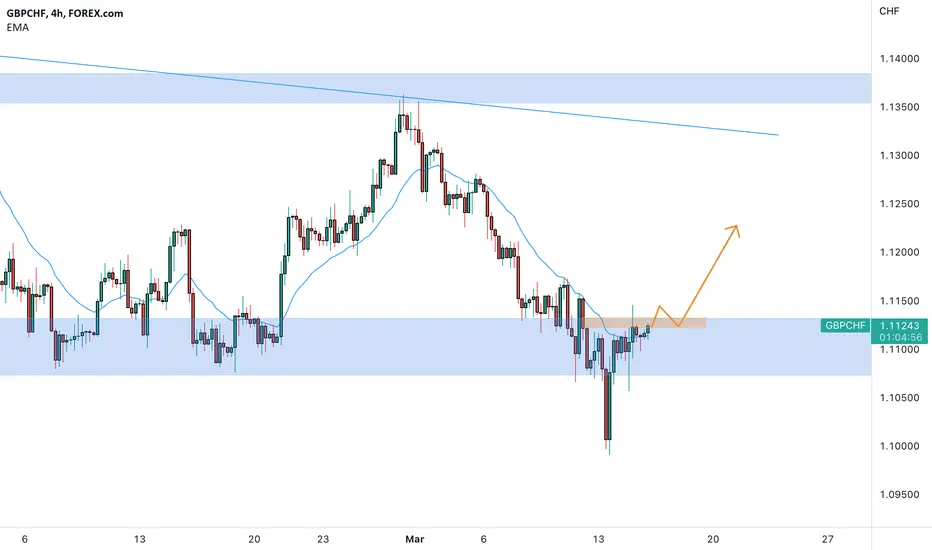
GBPCHF to turnaround at 61.8% retracement?GBPCHF - Intraday
Buying pressure from 1.1108 resulted in prices rejecting the dip.
The current move higher is expected to continue.
Although this gives the medium term bias a mild bullish edge, we expect intraday trading to continue to be mixed and volatile.
Preferred trade is to sell into rallies.
Further downside is expected although we prefer to set shorts at our bespoke resistance levels at 1.1270, resulting in improved risk/reward.
We look to Sell at 1.1255 (stop at 1.1295)
Our profit targets will be 1.1150 and 1.1130
Resistance: 1.1250 / 1.1315 / 1.1415
Support: 1.1150 / 1.1080 / 1.0990
Risk Disclaimer
The trade ideas beyond this page are for informational purposes only and do not constitute investment advice or a solicitation to trade. This information is provided by Signal Centre, a third-party unaffiliated with OANDA, and is intended for general circulation only. OANDA does not guarantee the accuracy of this information and assumes no responsibilities for the information provided by the third party. The information does not take into account the specific investment objectives, financial situation, or particular needs of any particular person. You should take into account your specific investment objectives, financial situation, and particular needs before making a commitment to trade, including seeking advice from an independent financial adviser regarding the suitability of the investment, under a separate engagement, as you deem fit.
You accept that you assume all risks in independently viewing the contents and selecting a chosen strategy.
Where the research is distributed in Singapore to a person who is not an Accredited Investor, Expert Investor or an Institutional Investor, Oanda Asia Pacific Pte Ltd (“OAP“) accepts legal responsibility for the contents of the report to such persons only to the extent required by law. Singapore customers should contact OAP at 6579 8289 for matters arising from, or in connection with, the information/research distributed.
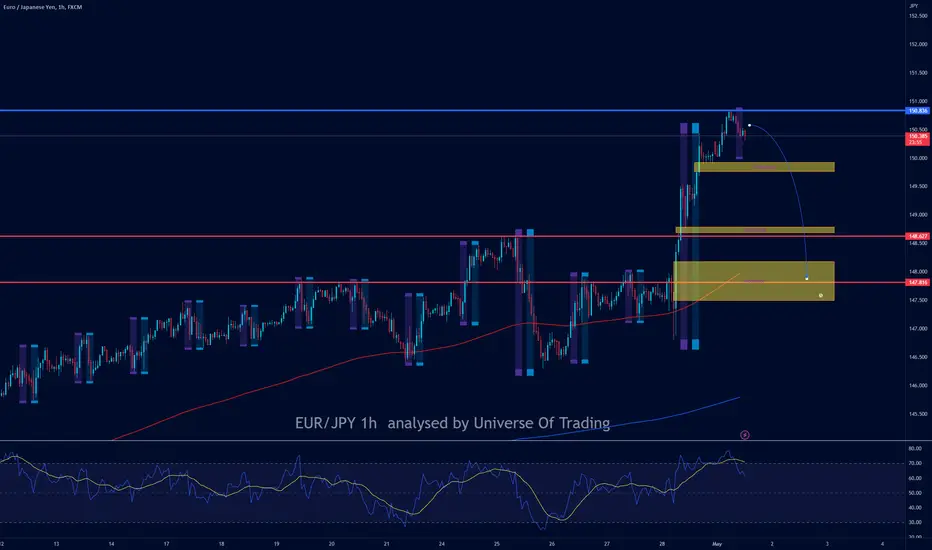
JPY pair analysis Idea of assembly on a JPY currency basis, Attention all these ideas are not to take but you can use them to develop your strategies for this week.
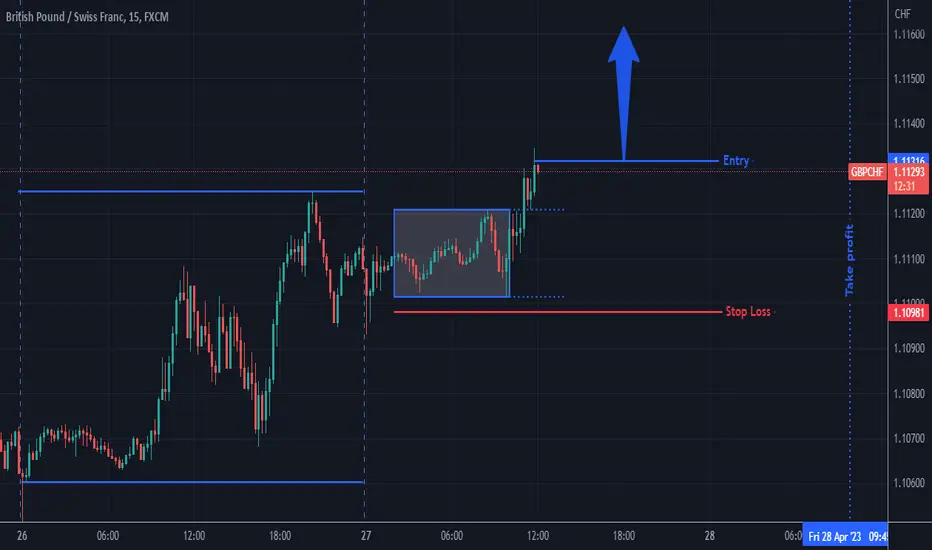
LOB Trade: Long position on GBPCHFLOB entry on GBPCHF 15 Mins for a Long position.
SL Below the Asian session.
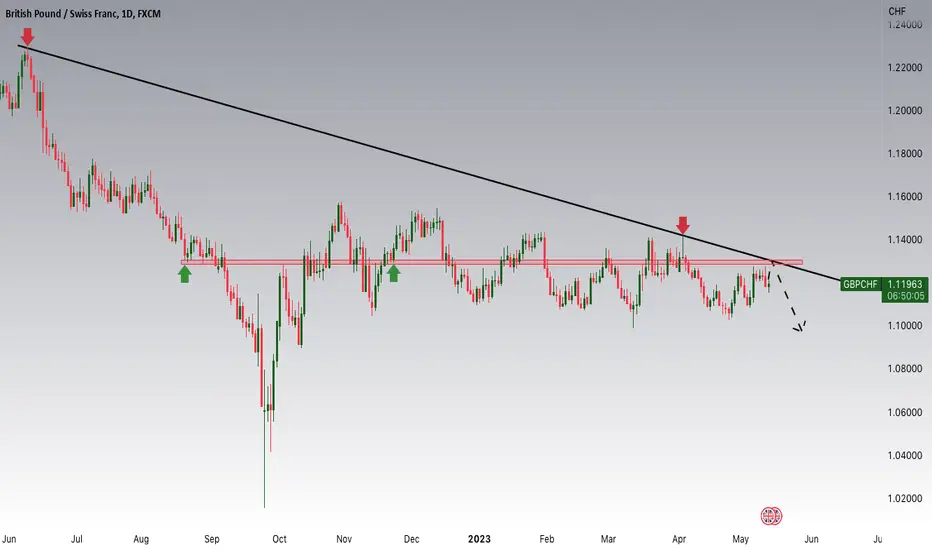
GBPCHF Potential DownsidesHey traders, in tomorrow's trading session we are monitoring GBPCHF for a selling opportunity around 1.113 zone, GBPCHF is trading in a downtrend and now seems to be in a correction phase in which it is approaching the major trend at 1.114 resistance zone.
Trade safe, Joe.
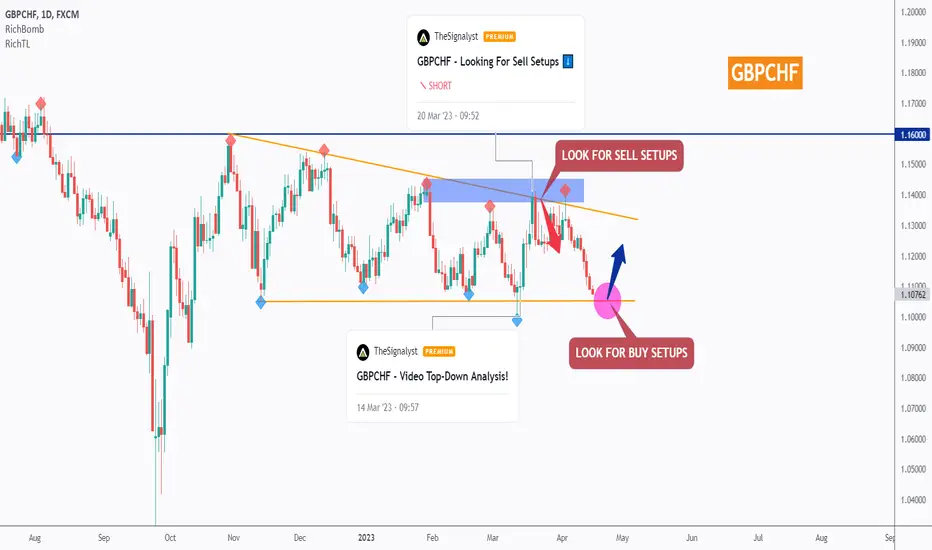
GBPCHF - Bears Took Over, Now What For The Bulls!Hello TradingView Family / Fellow Traders. This is Richard, also known as theSignalyst.
GBPCHF has been stuck inside a range in the shape of a symmetrical triangle.
As per my last analysis (attached on the chart), GBPCHF was around the upper orange trendline so we were looking for sell setups.
Now GBPCHF is approaching the lower trendline, so we will be looking for buy setups.
Moreover, the lower orange trendline is a support zone.
🏹 So the highlighted purple circle is a strong area to look for buy setups as it is the intersection of a support / lower orange trendline.
As per my trading style:
As GBPCHF is sitting around the purple circle zone, I will be looking for bullish reversal setups (like a double bottom pattern, trendline break , and so on...)
📚 Always follow your trading plan regarding entry, risk management, and trade management.
Good luck!
All Strategies Are Good; If Managed Properly!
~Rich
GBPCHF Potential DownsidesHey Traders, in today's trading session we are monitoring GBPCHF for a selling opportunity around 1.11700 zone, GBPCHF is trading in an uptrend and now seems to be attempting to break it out with current market classic safe haven strength. If we get dips below 1.11 i would watch a potential retrace of the trend from the 1.117 supply area.
Trade safe, Joe.
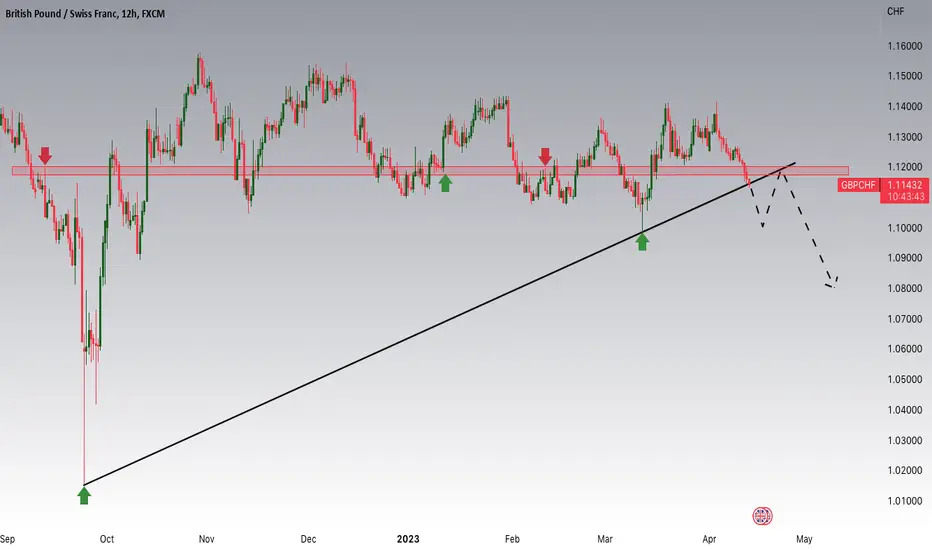
GBPCHF - Video Top-Down Analysis! UpdateHello TradingView Family / Fellow Traders. This is Richard, also known as theSignalyst.
Here is a detailed update top-down analysis for GBPCHF .
Which scenario do you think is more likely to happen? and Why?
Always follow your trading plan regarding entry, risk management, and trade management.
Good Luck!.
All Strategies Are Good; If Managed Properly!
~Rich

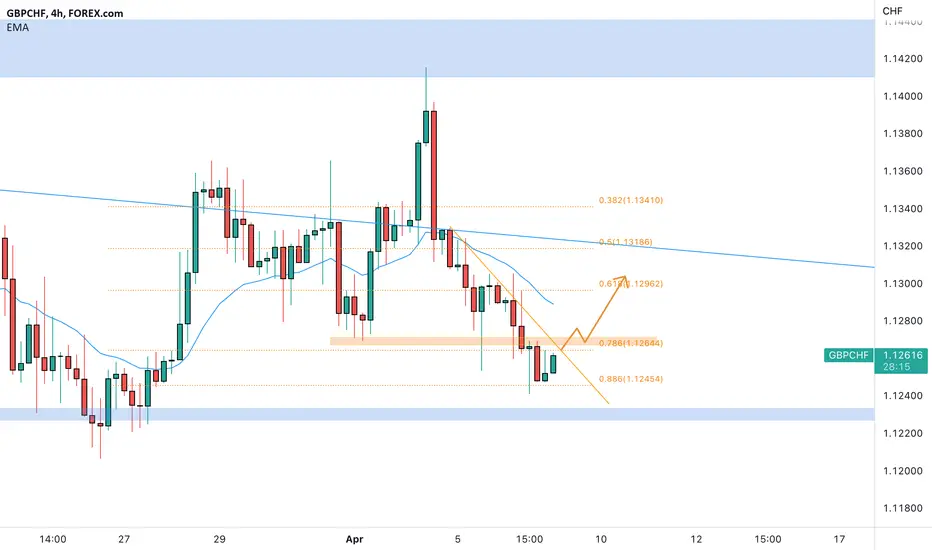
GBPCHF a turn at the 0.886 🦐GBPCHF on the 4h chart after last week's profit has retraced at the 0.886 Fibonacci level.
The price respects a descending trendline and moves below a descending resistance.
How can i approach this scenario?
I will wait for a potential break of the interested area and if the market will satisfy the Plancton's MTB strategy i will set a nice long order.
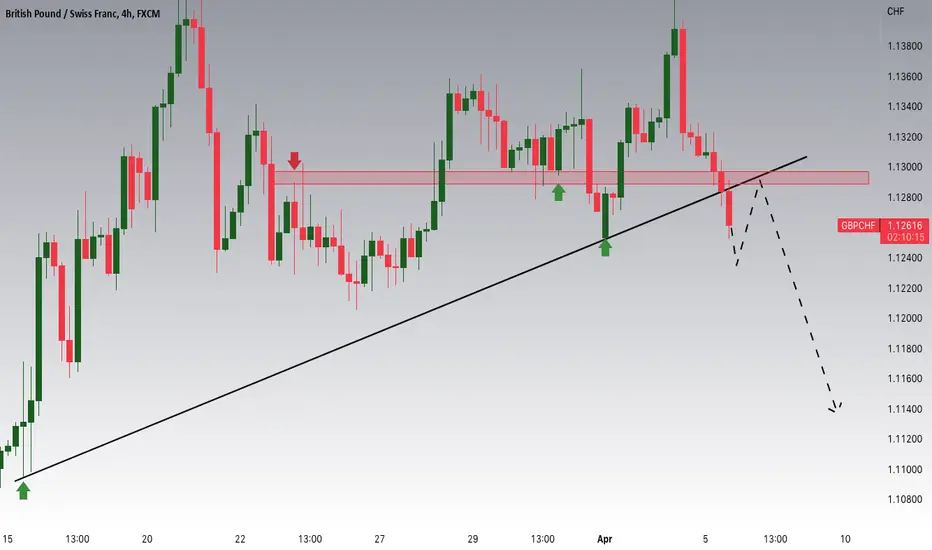
GBPUSD Potential downsidesHey traders, in today's trading session we are monitoring GBPCHF for a selling opportunity around 1.13 zone, GBPCHF was trading in an uptrend and successfully managed to break it out. if we get any decent pullback i will be watching a potential retrace of the trend around 1.13 support and resistance zone. Considering also that CHF is considered as a safe haven in time of uncertainty along with JPY.
Trade safe, Joe.
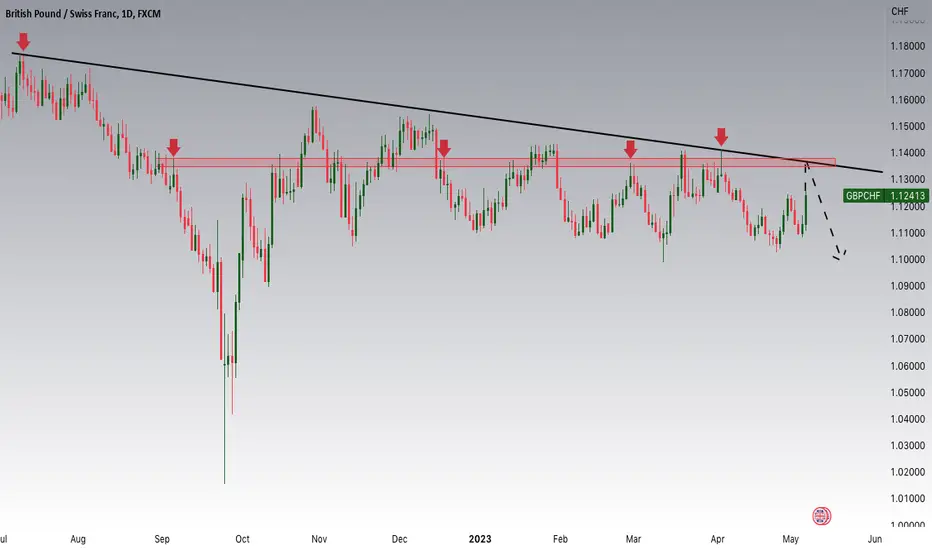
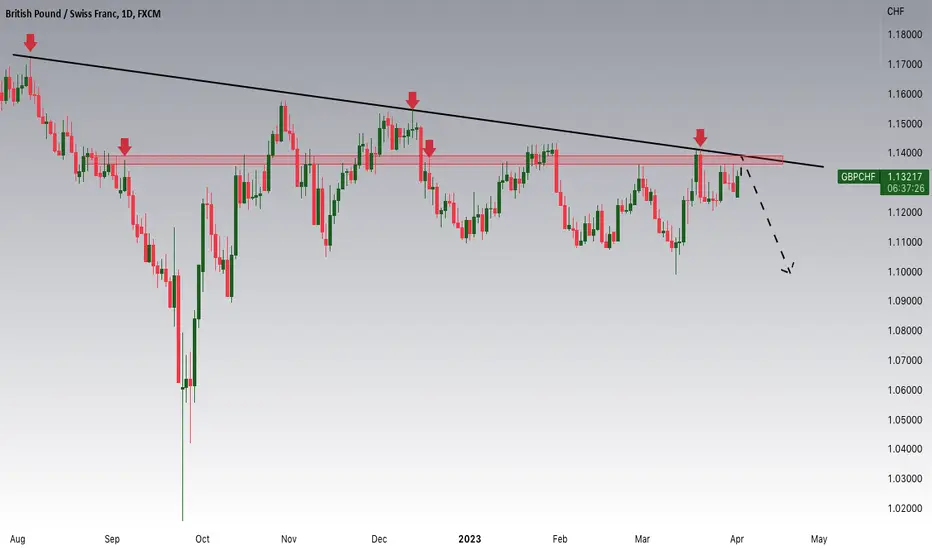
GBPCHF Potential downsidesHey Traders, in today's trading session we are monitoring GBPCHF for a selling opportunity around 1.138 zone, GBPCHF is trading in a downtrend and now seems to be in a correction phase in which extending pullbacks are approaching the major trend around 1.13600 support and resistance zone.
Trade safe, Joe.
gbpchf short 4hIf we see the entry signal in this zone with the set loss limit, we will enter the matter of the degree of ascent, but keep in mind that this signal is used in the upper periods, so you must be patient enough, but if the goals are achieved, there will be a good profit.
GBPCHF long idea — Falling wedgeGBPCHF broke above a falling wedge pattern which indicates that this market will continue up for some extra pips.
GBPCHF on a liquidity grab 🦐GBPCHF on the 4h chart after the test of the daily support creates a false breakout of the area where the market took the liquidity below the support zone.
The price immediately climbed over the support and is now trading below a minor resistance structure.
According to Plancton's strategy IF the price will break above and satisfy the MTB strategy we can set a nice long order.
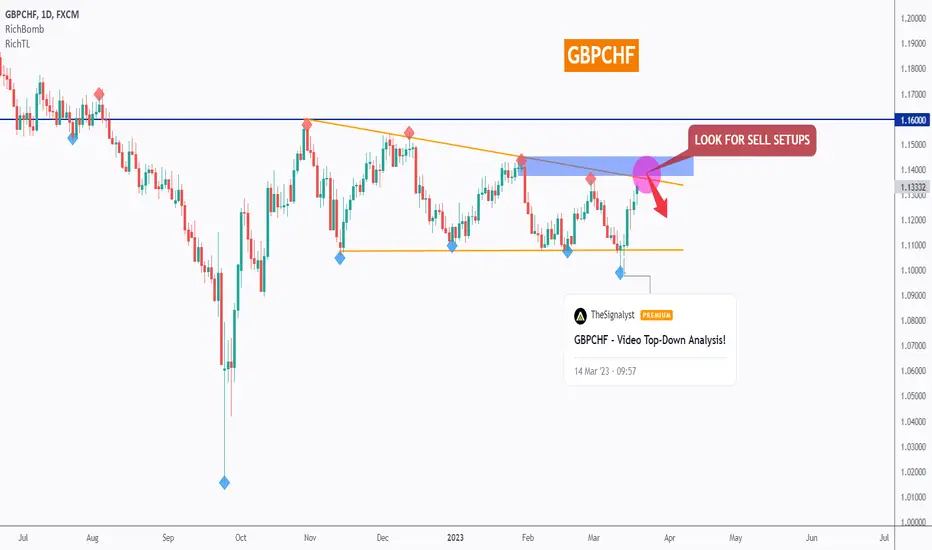
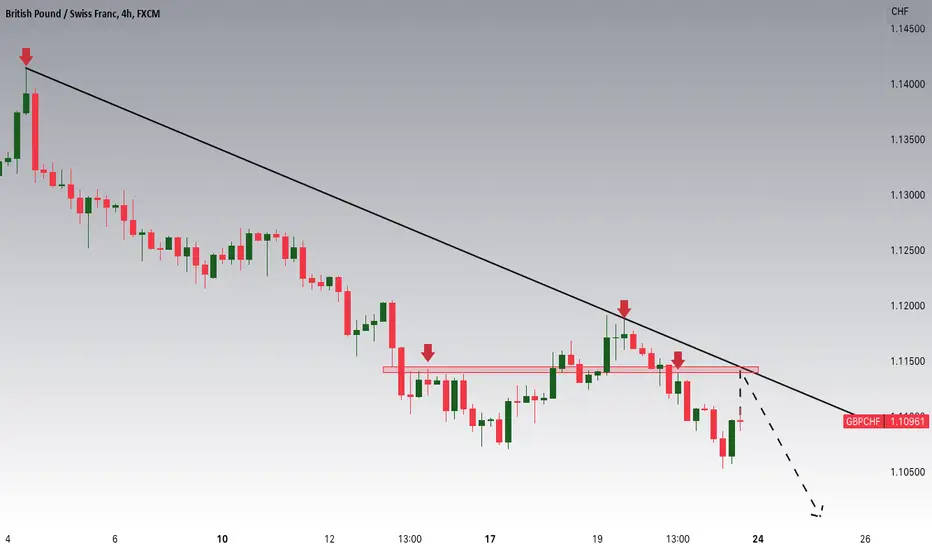
GBPCHF - Looking For Sell Setups ⬇️Hello TradingView Family / Fellow Traders. This is Richard, also known as theSignalyst.
GBPCHF is stuck inside a range in the shape of a symmetrical triangle.
As per my last analysis (attached on the chart), GBPCHF was around the lower orange trendline so we were looking for buy setups.
Now GBPCHF is approaching the upper trendline, so we will be looking for sell setups.
Moreover, the blue zone is a strong supply.
🏹 So the highlighted purple circle is a strong area to look for sell setups as it is the intersection of the blue supply and upper orange trendline. (acting as non-horizontal resistance)
As per my trading style:
As GBPCHF is sitting around the purple circle zone, I will be looking for bearish reversal setups (like a double top pattern, trendline break , and so on...)
📚 Always follow your trading plan regarding entry, risk management, and trade management.
Good luck!
All Strategies Are Good; If Managed Properly!
~Rich